Exhibit (c)(10)

PRELIMINARY CONFIDENTIAL DRAFT – FOR DISCUSSION PURPOSES ONLY Project Francis Conflicts Committee GP LLC Discussion Materials of the Board of Directors of Arkose April 18, 2018 PRIVATE AND CONFIDENTIAL. This document is being sent to you for your information only as an investment banking client of Gol dman Sachs and should not be forwarded outside of your organization. This document has been prepared by the Investment Banking Division and is not a produ ct of Goldman Sachs Global Investment Research. This document should not be used as a basis for trading in the securities or loans of the companies name d herein or for any other investment decision. This document does not constitute an offer to sell the securities or loans of the companies named herein or a solic itation of proxies or votes and should not be construed as consisting of investment advice. Goldman Sachs does not provide accounting, tax, or legal advice.

GRAPHIC


PRELIMINARY CONFIDENTIAL DRAFT – FOR DISCUSSION PURPOSES ONLY Disclaimer These materials have been prepared and are provided by Goldman Sachs on a confidential basis solely for the information and assistance of the Conflicts Committee of Board of Directors of Arkose GP LLC (the “Committee"), the general partner of Arkose GP LP (the "Company"), in connection with its consideration of the matters referred to herein. These materials and Goldman Sachs’ presentation relating to these materials (the “Confidential Information”) may not be disclosed to any third party or circulated or referred to publicly or used for or relied upon for any other purpose without the prior written consent of Goldman Sachs. The Confidential Information was not prepared with a view to public disclosure or to conform to any disclosure standards under any state, federal or international securities laws or other laws, rules or regulations, and Goldman Sachs does not take any responsibility for the use of the Confidential Information by persons other than those set forth above. Notwithstanding anything in this Confidential Information to the contrary, the Company may disclose to any person the US federal income and state income tax treatment and tax structure of any transaction described herein and all materials of any kind (including tax opinions and other tax analyses) that are provided to the Company relating to such tax treatment and tax structure, without Goldman Sachs imposing any limitation of any kind. The Confidential Information has been prepared by the Investment Banking Division of Goldman Sachs and is not a product of its research department. Goldman Sachs and its affiliates are engaged in advisory, underwriting and financing, principal investing, sales and trading, research, investment management and other financial and non-financial activities and services for various persons and entities. Goldman Sachs and its affiliates and employees, and funds or other entities they manage or in which they invest or have other economic interests or with which they co-invest, may at any time purchase, sell, hold or vote long or short positions and investments in securities, derivatives, loans, commodities, currencies, credit default swaps and other financial instruments of the Company, any other party to any transaction and any of their respective affiliates or any currency or commodity that may be involved in any transaction. Goldman Sachs’ investment banking division maintains regular, ordinary course client service dialogues with clients and potential clients to review events, opportunities, and conditions in particular sectors and industries and, in that connection, Goldman Sachs may make reference to the Company, but Goldman Sachs will not disclose any confidential information received from the Company. The Confidential Information has been prepared based on historical financial information, forecasts and other information obtained by Goldman Sachs from publicly available sources, the management of the Company or other sources (approved for our use by the Company in the case of information from management and non-public information). In preparing the Confidential Information, Goldman Sachs has relied upon and assumed, without assuming any responsibility for independent verification, the accuracy and completeness of all of the financial, legal, regulatory, tax, accounting and other information provided to, discussed with or reviewed by us, and Goldman Sachs does not assume any liability for any such information. Goldman Sachs does not provide accounting, tax, legal or regulatory advice. Goldman Sachs has not made an independent evaluation or appraisal of the assets and liabilities (including any contingent, derivative or other off-balance sheet assets and liabilities) of the Company or any other party to any transaction or any of their respective affiliates and has no obligation to evaluate the solvency of the Company or any other party to any transaction under any state or federal laws relating to bankruptcy, insolvency or similar matters. The analyses contained in the Confidential Information do not purport to be appraisals nor do they necessarily reflect the prices at which businesses or securities actually may be sold or purchased. Goldman Sachs’ role in any due diligence review is limited solely to performing such a review as it shall deem necessary to support its own advice and analysis and shall not be on behalf of the Company. Analyses based upon forecasts of future results are not necessarily indicative of actual future results, which may be significantly more or less favorable than suggested by these analyses, and Goldman Sachs does not assume responsibility if future results are materially different from those forecast. The Confidential Information does not address the underlying business decision of the Company to engage in any transaction, or the relative merits of any transaction or strategic alternative referred to herein as compared to any other transaction or alternative that may be available to the Company. The Confidential Information is necessarily based on economic, monetary, market and other conditions as in effect on, and the information made available to Goldman Sachs as of, the date of such Confidential Information and Goldman Sachs assumes no responsibility for updating or revising the Confidential Information based on circumstances, developments or events occurring after such date. The Confidential Information does not constitute any opinion, nor does the Confidential Information constitute a recommendation to the Committee, any security holder of the Company or any other person as to how to vote or act with respect to any transaction or any other matter. The Confidential Information, including this disclaimer, is subject to, and governed by, any written agreement between the Company and the Committee, on the one hand, and Goldman Sachs, on the other hand. 1
GRAPHIC


PRELIMINARY CONFIDENTIAL DRAFT – FOR DISCUSSION PURPOSES ONLY Table of Contents I. Executive Summary Appendix A: Additional Materials 2

GRAPHIC


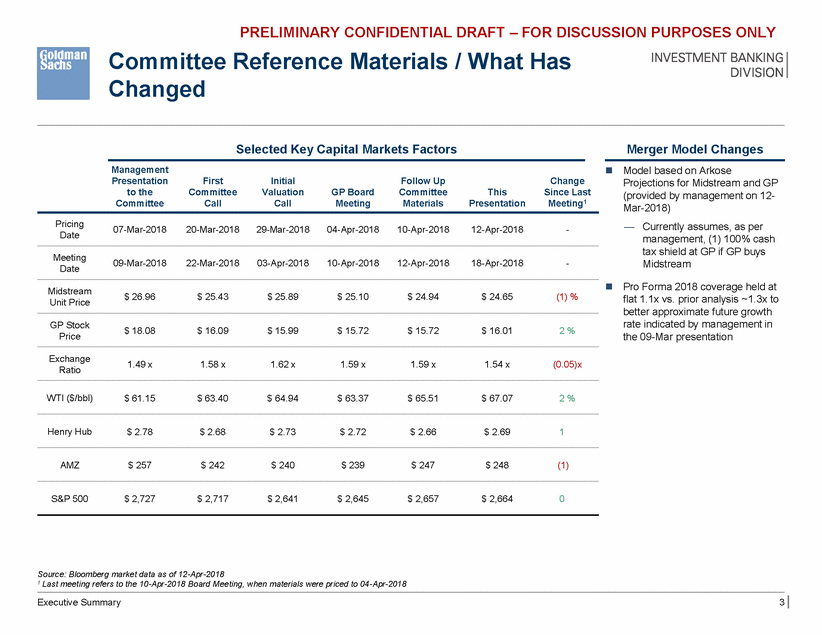
PRELIMINARY CONFIDENTIAL DRAFT – FOR DISCUSSION PURPOSES ONLY Committee Changed Reference Materials / What Has Selected Key Capital Markets Factors Merger Model Changes Management Presentation to the Committee Model based on Arkose Projections for Midstream and GP (provided by management on 12-Mar-2018) First Committee Call Initial Valuation Call Follow Up Committee Materials Change Since Last Meeting1 GP Board Meeting This Presentation Pricing Date — Currently assumes, as per management, (1) 100% cash tax shield at GP if GP buys Midstream 07-Mar-2018 20-Mar-2018 29-Mar-2018 04-Apr-2018 10-Apr-2018 12-Apr-2018 - Meeting Date 09-Mar-2018 22-Mar-2018 03-Apr-2018 10-Apr-2018 12-Apr-2018 18-Apr-2018 - Pro Forma 2018 coverage held at flat 1.1x vs. prior analysis ~1.3x to better approximate future growth rate indicated by management in the 09-Mar presentation Midstream Unit Price $ 26.96 $ 25.43 $ 25.89 $ 25.10 $ 24.94 $ 24.65 (1) % GP Stock Price $ 18.08 $ 16.09 $ 15.99 $ 15.72 $ 15.72 $ 16.01 2 % Exchange Ratio 1.49 x 1.58 x 1.62 x 1.59 x 1.59 x 1.54 x (0.05)x WTI ($/bbl) $ 61.15 $ 63.40 $ 64.94 $ 63.37 $ 65.51 $ 67.07 2 % Henry Hub $ 2.78 $ 2.68 $ 2.73 $ 2.72 $ 2.66 $ 2.69 1 AMZ $ 257 $ 242 $ 240 $ 239 $ 247 $ 248 (1) S&P 500 $ 2,727 $ 2,717 $ 2,641 $ 2,645 $ 2,657 $ 2,664 0 Source: Bloomberg market data as of 12-Apr-2018 1 Last meeting refers to the 10-Apr-2018 Board Meeting, when materials were priced to 04-Apr-2018 Executive Summary 3

GRAPHIC


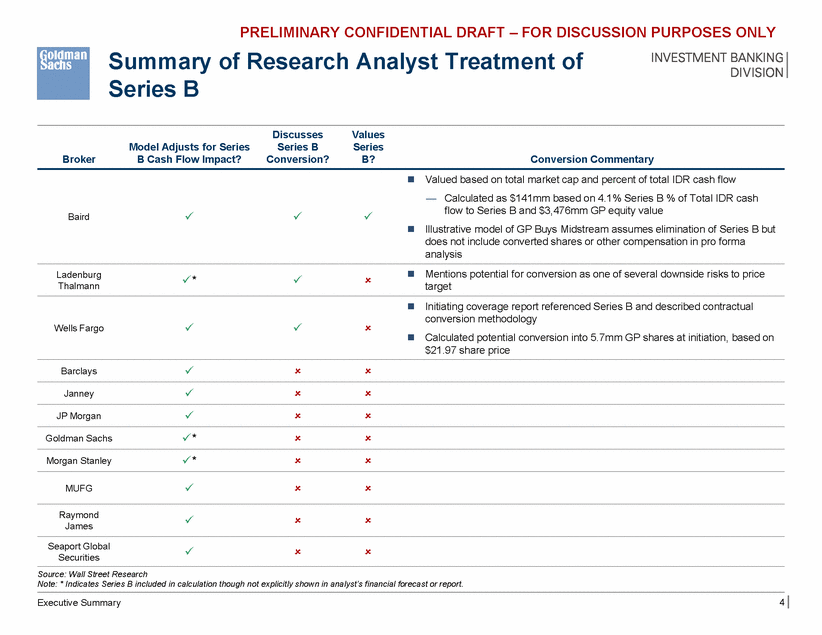
PRELIMINARY CONFIDENTIAL DRAFT – FOR DISCUSSION PURPOSES ONLY Summary of Research Analyst Treatment of Series B Discusses Series B Conversion? Values Series B? Model Adjusts for Series B Cash Flow Impact? Broker Conversion Commentary Valued based on total market cap and percent of total IDR cash flow — Calculated as $141mm based on 4.1% Series B % of Total IDR cash flow to Series B and $3,476mm GP equity value Illustrative model of GP Buys Midstream assumes elimination of Series B but does not include converted shares or other compensation in pro forma analysis    Baird Mentions potential for conversion as one of several downside risks to price target Ladenburg Thalmann *  Initiating coverage report referenced Series B and described contractual conversion methodology Calculated potential conversion into 5.7mm GP shares at initiation, based on $21.97 share price   Wells Fargo  Barclays  Janney  JP Morgan * Goldman Sachs * Morgan Stanley  MUFG Raymond James  Seaport Global Securities  Source: Wall Street Research Note: * Indicates Series B included in calculation though not explicitly shown in analyst’s financial forecast or report. 4 Executive Summary

GRAPHIC


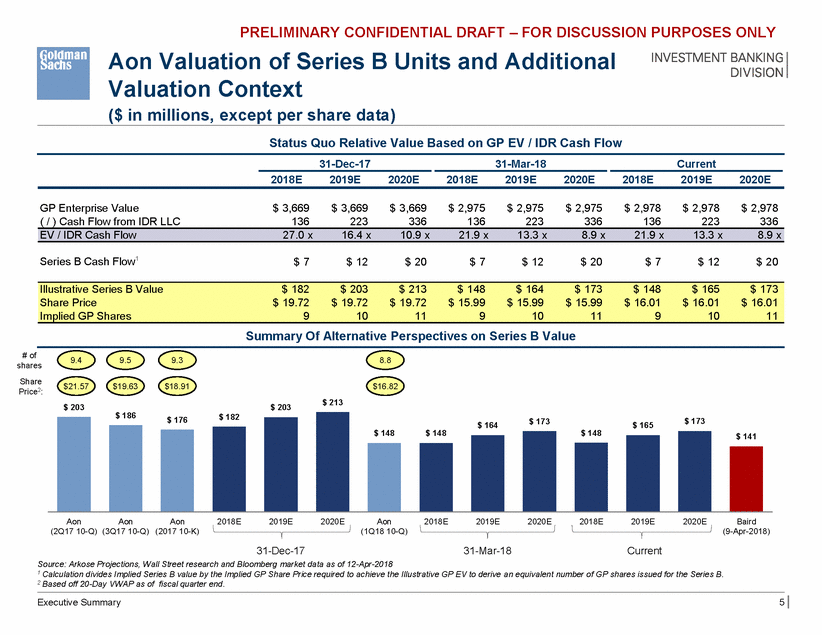
PRELIMINARY CONFIDENTIAL DRAFT – FOR DISCUSSION PURPOSES ONLY Aon Valuation of Series B Units and Additional Valuation Context ($ in millions, except per share data) Status Quo Relative Value Based on GP EV / IDR Cash Flow 31-Dec-17 31-Mar-18 Current 2018E 2019E 2020E 2018E 2019E 2020E 2018E 2019E 2020E GP Enterprise Value ( / ) Cash Flow from IDR LLC $ 3,669 136 $ 3,669 223 $ 3,669 336 $ 2,975 136 $ 2,975 223 $ 2,975 336 $ 2,978 136 $ 2,978 223 $ 2,978 336 Series B Cash Flow1 $ 7 $ 12 $ 20 $ 7 $ 12 $ 20 $ 7 $ 12 $ 20 Summary Of Alternative Perspectives on Series B Value # of shares Share Price2: 9.4 9.5 9.3 8.8 $21.57 $19.63 $18.91 $16.82 $ 213 $ 203 $ 203 $ 186 $ 182 $ 176 $ 148 $ 148 $ 148 Aon Aon Aon (2017 10-K) 2018E 2019E 2020E Aon (1Q18 10-Q) 2018E 2019E 2020E 2018E 2019E 2020E Baird (9-Apr-2018) (2Q17 10-Q) (3Q17 10-Q) 31-Dec-17 Source: Arkose Projections, Wall Street research and Bloomberg market data as of 12-Apr-2018 31-Mar-18 Current 1 Calculation divides Implied Series B value by the Implied GP Share Price required to achieve the Illustrative GP EV to derive an equivalent number of GP shares issued for the Series B. 2 Based off 20-Day VWAP as of fiscal quarter end. Executive Summary 5 $ 164$ 173$ 165$ 173 $ 141 Illustrative Series B Value$ 182$ 203$ 213$ 148$ 164$ 173$ 148$ 165$ 173 Share Price$ 19.72$ 19.72$ 19.72$ 15.99$ 15.99$ 15.99$ 16.01$ 16.01$ 16.01 Implied GP Shares910119101191011 EV / IDR Cash Flow27.0 x16.4 x10.9 x21.9 x13.3 x8.9 x21.9 x13.3 x8.9 x

GRAPHIC


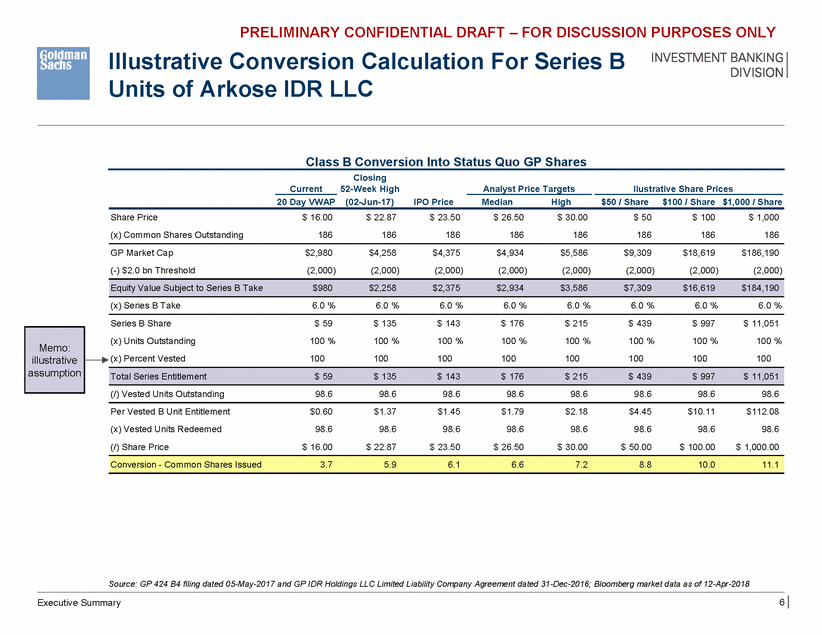
PRELIMINARY CONFIDENTIAL DRAFT – FOR DISCUSSION PURPOSES ONLY Illustrative Conversion Calculation For Series B Units of Arkose IDR LLC Class B Conversion Into Status Quo GP Shares Closing Current 52-Week High Analyst Price Targets llustrative Share Prices 20 Day VWAP (02-Jun-17) IPO Price Median High $50 / Share $100 / Share $1,000 / Share Share Price (x) Common Shares Outstanding $ 16.00 186 $ 22.87 186 $ 23.50 186 $ 26.50 186 $ 30.00 186 $ 50 186 $ 100 186 $ 1,000 186 GP Market Cap (-) $2.0 bn Threshold $2,980 (2,000) $4,258 (2,000) $4,375 (2,000) $4,934 (2,000) $5,586 (2,000) $9,309 (2,000) $18,619 (2,000) $186,190 (2,000) (x) Series B Take 6.0 % 6.0 % 6.0 % 6.0 % 6.0 % 6.0 % 6.0 % 6.0 % Series B Share (x) Units Outstanding (x) Percent Vested $ 59 100 % 100 $ 135 100 % 100 $ 143 100 % 100 $ 176 100 % 100 $ 215 100 % 100 $ 439 100 % 100 $ 997 100 % 100 $ 11,051 100 % 100 (/) Vested Units Outstanding 98.6 98.6 98.6 98.6 98.6 98.6 98.6 98.6 Per Vested B Unit Entitlement (x) Vested Units Redeemed (/) Share Price $0.60 98.6 $ 16.00 $1.37 98.6 $ 22.87 $1.45 98.6 $ 23.50 $1.79 98.6 $ 26.50 $2.18 98.6 $ 30.00 $4.45 98.6 $ 50.00 $10.11 98.6 $ 100.00 $112.08 98.6 $ 1,000.00 Source: GP 424 B4 filing dated 05-May-2017 and GP IDR Holdings LLC Limited Liability Company Agreement dated 31-Dec-2016; Bloomberg market data as of 12-Apr-2018 6 Executive Summary Conversion - Common Shares Issued 3.7 5.9 6.1 6.6 7.2 8.8 10.0 11.1 Total Series Entitlement $ 59 $ 135 $ 143 $ 176 $ 215 $ 439 $ 997 $ 11,051 Memo: illustrative assumption Equity Value Subject to Series B Take $980 $2,258 $2,375 $2,934 $3,586 $7,309 $16,619 $184,190

GRAPHIC


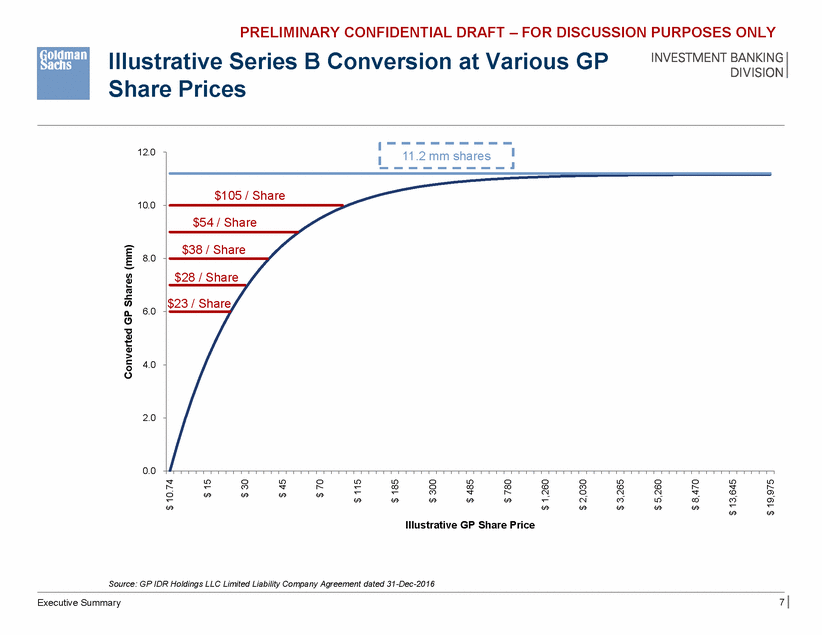
PRELIMINARY CONFIDENTIAL DRAFT – FOR DISCUSSION PURPOSES ONLY Illustrative Series B Conversion at Various GP Share Prices 12.0 10.0 8.0 re re 6.0 4.0 2.0 0.0 Illustrative GP Share Price Source: GP IDR Holdings LLC Limited Liability Company Agreement dated 31-Dec-2016 7 Executive Summary Converted GP Shares (mm) $ 10.74 $ 15 $ 30 $ 45 $ 70 $ 115 $ 185 $ 300 $ 485 $ 780 $ 1,260 $ 2,030 $ 3,265 $ 5,260 $ 8,470 $ 13,645 $ 19,975 $105 / Share $54 / Share $38 / Share $28 / Sha $23 / Sha 11.2 mm shares

GRAPHIC


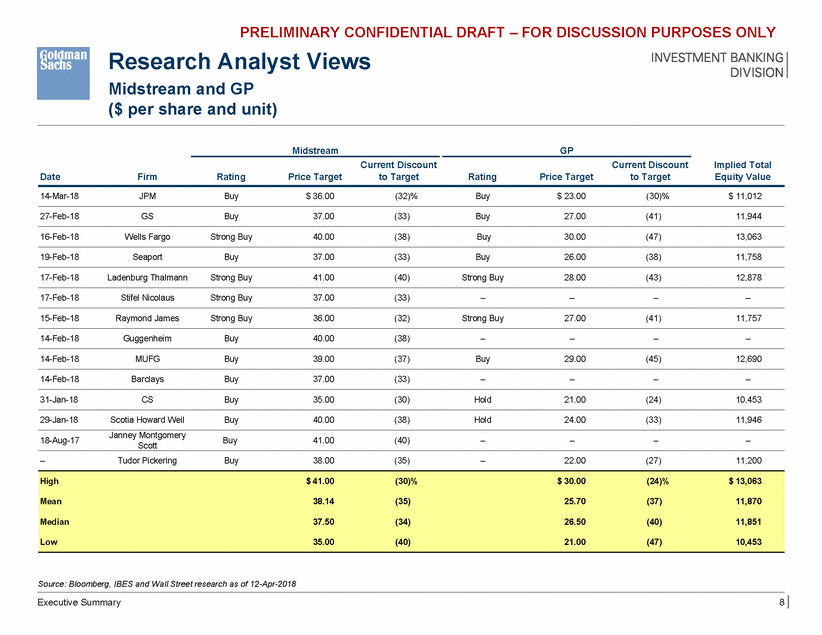
PRELIMINARY CONFIDENTIAL DRAFT – FOR DISCUSSION PURPOSES ONLY Research Analyst Views Midstream and GP ($ per share and unit) Midstream GP Current Discount to Target Current Discount to Target Implied Total Equity Value Date Firm Rating Price Target Rating Price Target 14-Mar-18 JPM Buy $ 36.00 (32)% Buy $ 23.00 (30)% $ 11,012 27-Feb-18 GS Buy 37.00 (33) Buy 27.00 (41) 11,944 16-Feb-18 Wells Fargo Strong Buy 40.00 (38) Buy 30.00 (47) 13,063 19-Feb-18 Seaport Buy 37.00 (33) Buy 26.00 (38) 11,758 17-Feb-18 Ladenburg Thalmann Strong Buy 41.00 (40) Strong Buy 28.00 (43) 12,878 17-Feb-18 Stifel Nicolaus Strong Buy 37.00 (33) – – – – 15-Feb-18 Raymond James Strong Buy 36.00 (32) Strong Buy 27.00 (41) 11,757 14-Feb-18 Guggenheim Buy 40.00 (38) – – – – 14-Feb-18 MUFG Buy 39.00 (37) Buy 29.00 (45) 12,690 14-Feb-18 Barclays Buy 37.00 (33) – – – – 31-Jan-18 CS Buy 35.00 (30) Hold 21.00 (24) 10,453 29-Jan-18 Scotia Howard Weil Buy 40.00 (38) Hold 24.00 (33) 11,946 Janney Montgomery Scott 18-Aug-17 Buy 41.00 (40) – – – – – Tudor Pickering Buy 38.00 (35) – 22.00 (27) 11,200 Source: Bloomberg, IBES and Wall Street research as of 12-Apr-2018 Executive Summary 8 High $ 41.00 (30)% $ 30.00 (24)% $ 13,063 Mean 38.14 (35) 25.70 (37) 11,870 Median 37.50 (34) 26.50 (40) 11,851 Low 35.00 (40) 21.00 (47) 10,453

GRAPHIC


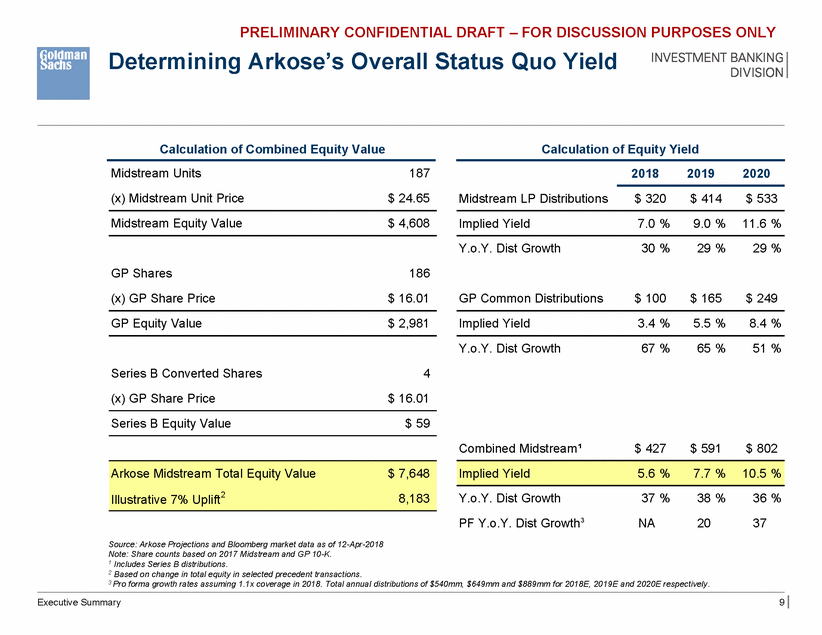
PRELIMINARY CONFIDENTIAL DRAFT – FOR DISCUSSION PURPOSES ONLY Determining Arkose’s Overall Status Quo Yield Calculation of Combined Equity Value Calculation of Equity Yield Midstream Units 187 2018 2019 2020 (x) Midstream Unit Price $ 24.65 Midstream LP Distributions $ 320 $ 414 $ 533 Midstream Equity Value $ 4,608 Implied Yield 7.0 % 9.0 % 11.6 % Y.o.Y. Dist Growth 30 % 29 % 29 % GP Shares (x) GP Share Price 186 $ 16.01 GP Common Distributions $ 100 $ 165 $ 249 GP Equity Value $ 2,981 Implied Yield 3.4 % 5.5 % 8.4 % Y.o.Y. Dist Growth 67 % 65 % 51 % Series B Converted Shares (x) GP Share Price 4 $ 16.01 Series B Equity Value $ 59 Combined Midstream¹ $ 427 $ 591 $ 802 Y.o.Y. Dist Growth PF Y.o.Y. Dist Growth3 37 % NA 38 % 20 36 % 37 Source: Arkose Projections and Bloomberg market data as of 12-Apr-2018 Note: Share counts based on 2017 Midstream and GP 10-K. 1 Includes Series B distributions. 2 Based on change in total equity in selected precedent transactions. 3 Pro forma growth rates assuming 1.1x coverage in 2018. Total annual distributions of $540mm, $649mm and $889mm for 2018E, 2019E and 2020E respectively. Executive Summary 9 Implied Yield5.6 %7.7 %10.5 % Arkose Midstream Total Equity Value$ 7,648 Illustrative 7% Uplift28,183

GRAPHIC


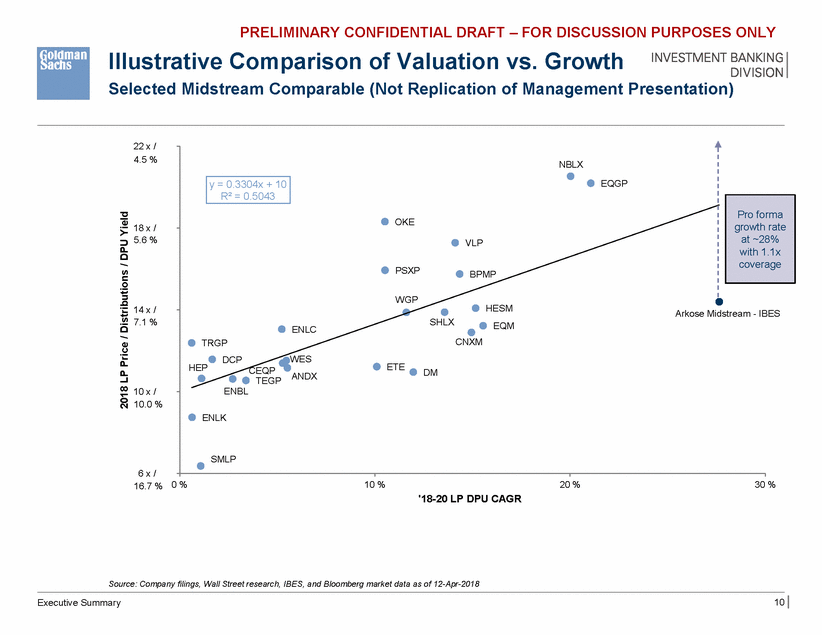
PRELIMINARY CONFIDENTIAL DRAFT – FOR DISCUSSION PURPOSES ONLY Illustrative Comparison of Valuation vs. Growth Selected Midstream Comparable (Not Replication of Management Presentation) 22 x / 4.5 % 18 x / 5.6 % PSXP BPMP 14 x / 7.1 % IBES ETE HEP TEGP 10 x / 10.0 % 6 x / 16.7 % 0 % 10 % 20 % 30 % '18-20 LP DPU CAGR Source: Company filings, Wall Street research, IBES, and Bloomberg market data as of 12-Apr-2018 10 Executive Summary 2018 LP Price / Distributions / DPU Yield orma rate 28% .1x erage NBLX EQGP Pro f OKEgrowth VLPat ~ with 1 cov WGP HESMArkose Midstream - ENLCSHLXEQM TRGPCNXM DCPWES CEQPANDXDM ENBL ENLK SMLP y = 0.3304x + 10 R² = 0.5043

GRAPHIC


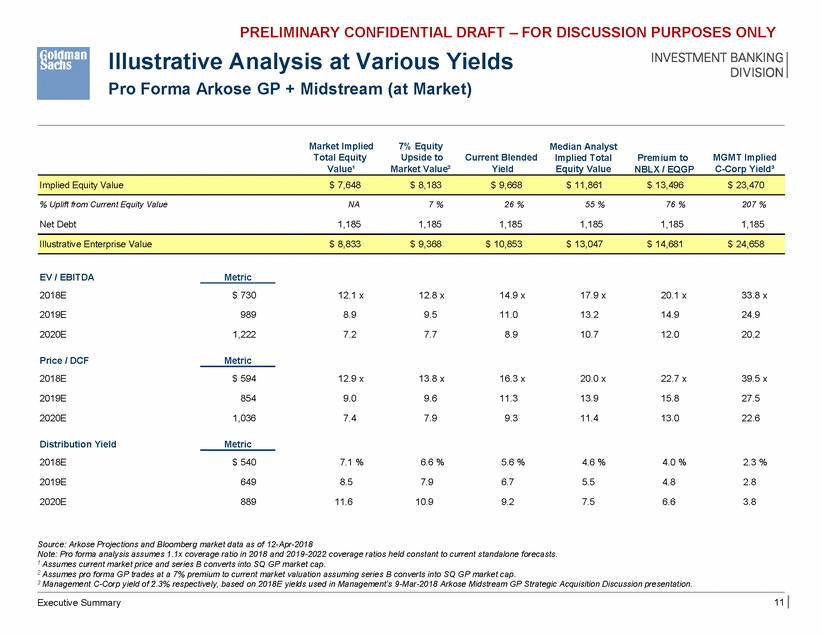
PRELIMINARY CONFIDENTIAL DRAFT – FOR DISCUSSION PURPOSES ONLY Illustrative Analysis at Various Yields Pro Forma Arkose GP + Midstream (at Market) Market Implied Total Equity Value¹ 7% Equity Upside to Market Value² Median Analyst Implied Total Equity Value Current Blended Yield Premium to NBLX / EQGP MGMT Implied C-Corp Yield³ % Uplift from Current Equity Value NA 7 % 26 % 55 % 76 % 207 % Net Debt 1,185 1,185 1,185 1,185 1,185 1,185 EV / EBITDA 2018E Metric $ 730 12.1 x 12.8 x 14.9 x 17.9 x 20.1 x 33.8 x 2019E 989 8.9 9.5 11.0 13.2 14.9 24.9 2020E 1,222 7.2 7.7 8.9 10.7 12.0 20.2 Price / DCF 2018E Metric $ 594 12.9 x 13.8 x 16.3 x 20.0 x 22.7 x 39.5 x 2019E 854 9.0 9.6 11.3 13.9 15.8 27.5 2020E 1,036 7.4 7.9 9.3 11.4 13.0 22.6 Distribution Yield 2018E Metric $ 540 7.1 % 6.6 % 5.6 % 4.6 % 4.0 % 2.3 % 2019E 649 8.5 7.9 6.7 5.5 4.8 2.8 2020E 889 11.6 10.9 9.2 7.5 6.6 3.8 Source: Arkose Projections and Bloomberg market data as of 12-Apr-2018 Note: Pro forma analysis assumes 1.1x coverage ratio in 2018 and 2019-2022 coverage ratios held constant to current standalone forecasts. 1 Assumes current market price and series B converts into SQ GP market cap. 2 Assumes pro forma GP trades at a 7% premium to current market valuation assuming series B converts into SQ GP market cap. 3 Management C-Corp yield of 2.3% respectively, based on 2018E yields used in Management’s 9-Mar-2018 Arkose Midstream GP Strategic Acquisition Discussion presentation. 11 Executive Summary Illustrative Enterprise Value$ 8,833$ 9,368$ 10,853$ 13,047$ 14,681$ 24,658 Implied Equity Value$ 7,648$ 8,183$ 9,668$ 11,861$ 13,496$ 23,470

GRAPHIC


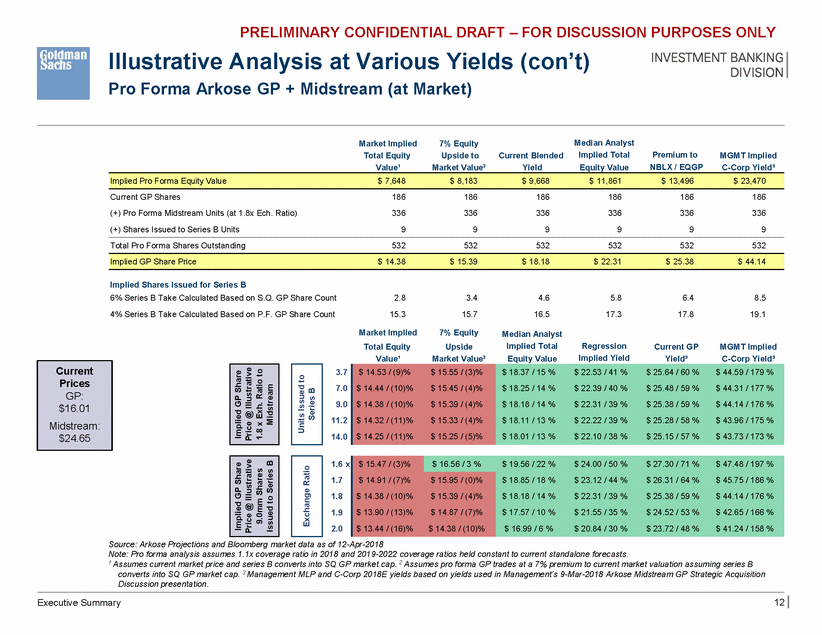
PRELIMINARY CONFIDENTIAL DRAFT – FOR DISCUSSION PURPOSES ONLY Illustrative Analysis at Various Yields (con’t) Pro Forma Arkose GP + Midstream (at Market) Median Analyst Implied Total Equity Value Market Implied Total Equity Value¹ 7% Equity Upside to Market Value² Current Blended Yield Premium to NBLX / EQGP MGMT Implied C-Corp Yield³ Current GP Shares (+) Pro Forma Midstream Units (at 1.8x Ech. Ratio) (+) Shares Issued to Series B Units 186 336 9 186 336 9 186 336 9 186 336 9 186 336 9 186 336 9 Total Pro Forma Shares Outstanding 532 532 532 532 532 532 Implied Shares Issued for Series B 6% Series B Take Calculated Based on S.Q. GP Share Count 4% Series B Take Calculated Based on P.F. GP Share Count 2.8 15.3 3.4 15.7 4.6 16.5 5.8 17.3 6.4 17.8 8.5 19.1 Market Implied Total Equity Value¹ 7% Equity Upside Market Value² Median Analyst Implied Total Equity Value Regression Implied Yield Current GP Yield³ MGMT Implied C-Corp Yield³ 3.7 7.0 9.0 11.2 14.0 1.6 x 1.7 1.8 1.9 2.0 Source: Arkose Projections and Bloomberg market data as of 12-Apr-2018 Note: Pro forma analysis assumes 1.1x coverage ratio in 2018 and 2019-2022 coverage ratios held constant to current standalone forecasts. 1 Assumes current market price and series B converts into SQ GP market cap. 2 Assumes pro forma GP trades at a 7% premium to current market valuation assuming series B converts into SQ GP market cap. 3 Management MLP and C-Corp 2018E yields based on yields used in Management’s 9-Mar-2018 Arkose Midstream GP Strategic Acquisition Discussion presentation. 12 Executive Summary $ 15.47 / (3)% $ 16.56 / 3 %$ 19.56 / 22 %$ 24.00 / 50 %$ 27.30 / 71 %$ 47.48 / 197 % $ 14.91 / (7)%$ 15.95 / (0)% $ 14.38 / (10)%$ 15.39 / (4)% $ 13.90 / (13)%$ 14.87 / (7)% $ 13.44 / (16)%$ 14.38 / (10)% $ 18.85 / 18 %$ 23.12 / 44 %$ 26.31 / 64 %$ 45.75 / 186 % $ 18.18 / 14 %$ 22.31 / 39 %$ 25.38 / 59 %$ 44.14 / 176 % $ 17.57 / 10 %$ 21.55 / 35 %$ 24.52 / 53 %$ 42.65 / 166 % $ 16.99 / 6 %$ 20.84 / 30 %$ 23.72 / 48 %$ 41.24 / 158 % Exchange Ratio Implied GP Share Price @ Illustrative 9.0mm Shares Issued to Series B $ 14.53 / (9)%$ 15.55 / (3)% $ 14.44 / (10)%$ 15.45 / (4)% $ 14.38 / (10)%$ 15.39 / (4)% $ 14.32 / (11)%$ 15.33 / (4)% $ 14.25 / (11)%$ 15.25 / (5)% $ 18.37 / 15 %$ 22.53 / 41 %$ 25.64 / 60 %$ 44.59 / 179 % $ 18.25 / 14 %$ 22.39 / 40 %$ 25.48 / 59 %$ 44.31 / 177 % $ 18.18 / 14 %$ 22.31 / 39 %$ 25.38 / 59 %$ 44.14 / 176 % $ 18.11 / 13 %$ 22.22 / 39 %$ 25.28 / 58 %$ 43.96 / 175 % $ 18.01 / 13 %$ 22.10 / 38 %$ 25.15 / 57 %$ 43.73 / 173 % Units Issued to Series B Implied GP Share Price @ Illustrative 1.8 x Exh. Ratio to Midstream Current Prices GP: $16.01 Midstream: $24.65 Implied GP Share Price$ 14.38$ 15.39$ 18.18$ 22.31$ 25.38$ 44.14 Implied Pro Forma Equity Value$ 7,648$ 8,183$ 9,668$ 11,861$ 13,496$ 23,470

GRAPHIC


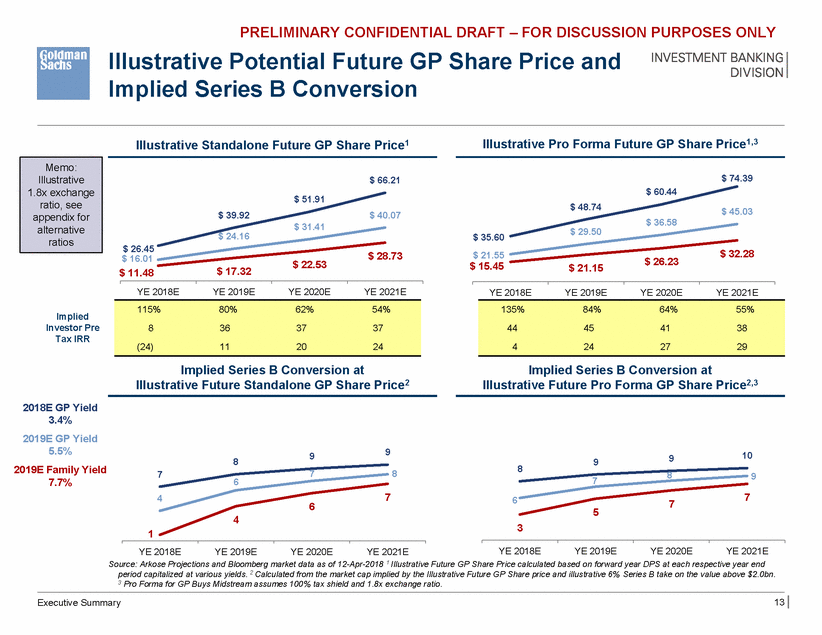
PRELIMINARY CONFIDENTIAL DRAFT – FOR DISCUSSION PURPOSES ONLY Illustrative Potential Future GP Implied Series B Conversion Share Price and Illustrative Pro Forma Future GP Share Price1,3 Illustrative Standalone Future GP Share Price1 $ 74.39 $ 66.21 $ 60.44 $ 51.91 $ 48.74 $ 45.03 $ 39.92 $ 40.07 $ 36.58 $ 31.41 $ 29.50 $ 24.16 $ 35.60 $ 21.55 $ 15.45 $ 26.45 $ 16.01 $ 11.48 $ 32.28 $ 28.73 $ 26.23 $ 22.53 $ 21.15 $ 17.32 YE 2018E YE 2019E YE 2020E YE 2021E YE 2018E YE 2019E YE 2020E YE 2021E Implied Investor Pre Tax IRR Implied Series B Conversion at Illustrative Future Standalone GP Share Price2 Implied Series B Conversion at Illustrative Future Pro Forma GP Share Price2,3 2018E GP Yield 3.4% 2019E GP Yield 5.5% 2019E Family Yield 7.7% 9 10 9 7 9 8 8 9 7 8 8 7 9 6 7 7 4 6 7 6 5 4 3 1 YE 2018E YE 2019E YE 2020E YE 2021E YE 2018E YE 2019E YE 2020E YE 2021E Source: Arkose Projections and Bloomberg market data as of 12-Apr-2018 1 Illustrative Future GP Share Price calculated based on forward year DPS at each respective year end period capitalized at various yields. 2 Calculated from the market cap implied by the Illustrative Future GP Share price and illustrative 6% Series B take on the value above $2.0bn. 3 Pro Forma for GP Buys Midstream assumes 100% tax shield and 1.8x exchange ratio. 13 Executive Summary 135%84%64%55% 44454138 4242729 115%80%62%54% 8363737 (24)112024 Memo: Illustrative 1.8x exchange ratio, see appendix for alternative ratios

GRAPHIC


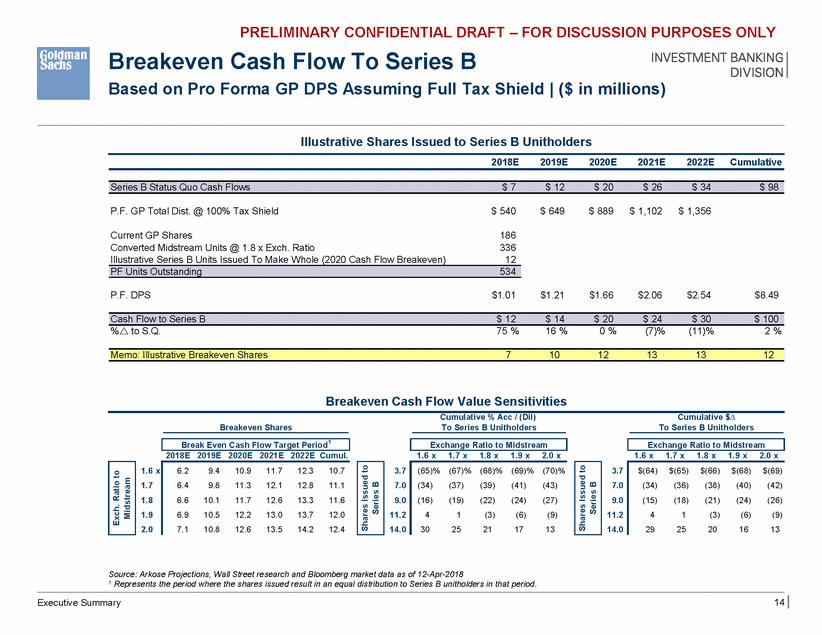
PRELIMINARY CONFIDENTIAL DRAFT – FOR DISCUSSION PURPOSES ONLY Breakeven Cash Flow To Series B Based on Pro Forma GP DPS Assuming Full Tax Shield | ($ in millions) Illustrative Shares Issued to Series B Unitholders 2018E 2019E 2020E 2021E 2022E Cumulative P.F. GP Total Dist. @ 100% Tax Shield $ 540 $ 649 $ 889 $ 1,102 $ 1,356 Current GP Shares Converted Midstream Units @ 1.8 x Exch. Ratio Illustrative Series B Units Issued To Make Whole (2020 Cash Flow Breakeven) 186 336 12 P.F. DPS $1.01 $1.21 $1.66 $2.06 $2.54 $8.49 %r to S.Q. 75 % 16 % 0 % (7)% (11)% 2 % Breakeven Cash Flow Value Sensitivities Cumulative % Acc / (Dil) To Series B Unitholders Cumulative $To Series B Unitholders Breakeven Shares 2018E 2019E 2020E 2021E 2022E Cumul. 1.6 x 1.7 x 1.8 x 1.9 x 2.0 x 1.6 x 1.7 x 1.8 x 1.9 x 2.0 x 1.6 x 1.7 1.8 1.9 2.0 3.7 7.0 9.0 11.2 14.0 3.7 7.0 9.0 11.2 14.0 Source: Arkose Projections, Wall Street research and Bloomberg market data as of 12-Apr-2018 1 Represents the period where the shares issued result in an equal distribution to Series B unitholders in that period. 14 Executive Summary $(64) $(65) $(66) $(68) $(69) (34) (36) (38) (40) (42) (15) (18) (21) (24) (26) 4 1 (3) (6) (9) 29 25 20 16 13 Shares Issued to Series B (65)% (67)% (68)% (69)% (70)% (34) (37) (39) (41) (43) (16) (19) (22) (24) (27) 4 1 (3) (6) (9) 30 25 21 17 13 Shares Issued to Series B 6.2 9.4 10.9 11.7 12.3 10.7 6.4 9.8 11.3 12.1 12.8 11.1 6.6 10.1 11.7 12.6 13.3 11.6 6.9 10.5 12.2 13.0 13.7 12.0 7.1 10.8 12.6 13.5 14.2 12.4 Exch. Ratio to Midstream Exchange Ratio to Midstream Exchange Ratio to Midstream Break Even Cash Flow Target Period1 Memo: Illustrative Breakeven Shares 7 10 12 13 13 12 Cash Flow to Series B $ 12 $ 14 $ 20 $ 24 $ 30 $ 100 PF Units Outstanding 534 Series B Status Quo Cash Flows $ 7 $ 12 $ 20 $ 26 $ 34 $ 98

GRAPHIC


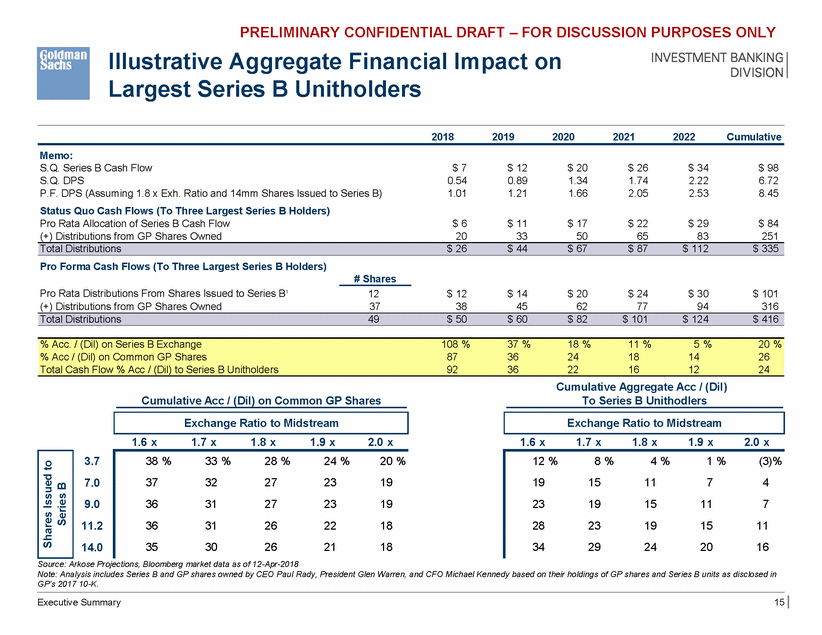
PRELIMINARY CONFIDENTIAL DRAFT – FOR DISCUSSION PURPOSES ONLY Illustrative Aggregate Financial Impact on Largest Series B Unitholders 2018 2019 2020 2021 2022 Cumulative Memo: S.Q. Series B Cash Flow S.Q. DPS P.F. DPS (Assuming 1.8 x Exh. Ratio and 14mm Shares Issued to Series B) Status Quo Cash Flows (To Three Largest Series B Holders) Pro Rata Allocation of Series B Cash Flow (+) Distributions from GP Shares Owned $ 7 0.54 1.01 $ 12 0.89 1.21 $ 20 1.34 1.66 $ 26 1.74 2.05 $ 34 2.22 2.53 $ 98 6.72 8.45 $ 6 20 $ 11 33 $ 17 50 $ 22 65 $ 29 83 $ 84 251 Pro Forma Cash Flows (To Three Largest Series B Holders) # Shares Pro Rata Distributions From Shares Issued to Series B1 (+) Distributions from GP Shares Owned 12 37 $ 12 38 $ 14 45 $ 20 62 $ 24 77 $ 30 94 $ 101 316 Cumulative Aggregate Acc / (Dil) To Series B Unithodlers Cumulative Acc / (Dil) on Common GP Shares 1.6 x 1.7 x 1.8 x 1.9 x 2.0 x 1.6 x 1.7 x 1.8 x 1.9 x 2.0 x 3.7 7.0 9.0 11.2 14.0 Source: Arkose Projections, Bloomberg market data as of 12-Apr-2018 Note: Analysis includes Series B and GP shares owned by CEO Paul Rady, President Glen Warren, and CFO Michael Kennedy based on their holdings of GP shares and Series B units as disclosed in GP’s 2017 10-K. Executive Summary 15 12 % 8 % 4 % 1 % (3)% 19 15 11 7 4 23 19 15 11 7 28 23 19 15 11 34 29 24 20 16 38 % 33 % 28 % 24 % 20 % 37 32 27 23 19 36 31 27 23 19 36 31 26 22 18 35 30 26 21 18 Shares Issued to Series B Exchange Ratio to Midstream Exchange Ratio to Midstream % Acc. / (Dil) on Series B Exchange 108 % 37 % 18 % 11 % 5 % 20 % % Acc / (Dil) on Common GP Shares 87 36 24 18 14 26 Total Cash Flow % Acc / (Dil) to Series B Unitholders 92 36 22 16 12 24 Total Distributions 49 $ 50 $ 60 $ 82 $ 101 $ 124 $ 416 Total Distributions $ 26 $ 44 $ 67 $ 87 $ 112 $ 335

GRAPHIC


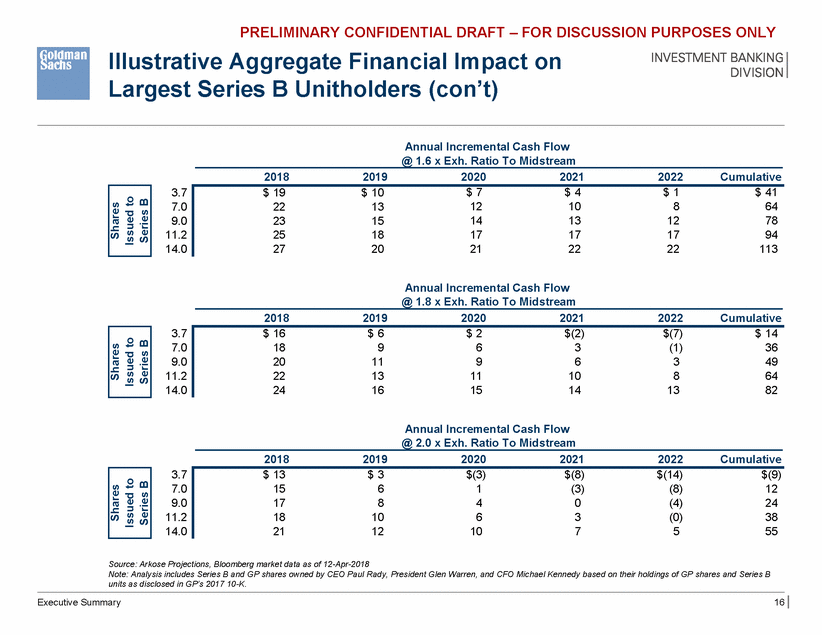
PRELIMINARY CONFIDENTIAL DRAFT – FOR DISCUSSION PURPOSES ONLY Illustrative Aggregate Financial Impact on Largest Series B Unitholders (con’t) Annual Incremental Cash Flow @ 1.6 x Exh. Ratio To Midstream 2018 2019 2020 2021 2022 Cumulative 3.7 7.0 9.0 11.2 14.0 Annual Incremental Cash Flow @ 1.8 x Exh. Ratio To Midstream 2018 2019 2020 2021 2022 Cumulative 3.7 7.0 9.0 11.2 14.0 Annual Incremental Cash Flow @ 2.0 x Exh. Ratio To Midstream 2018 2019 2020 2021 2022 Cumulative 3.7 7.0 9.0 11.2 14.0 Source: Arkose Projections, Bloomberg market data as of 12-Apr-2018 Note: Analysis includes Series B and GP shares owned by CEO Paul Rady, President Glen Warren, and CFO Michael Kennedy based on their holdings of GP shares and Series B units as disclosed in GP’s 2017 10-K. Executive Summary 16 $ 13 $ 3 $(3) $(8) $(14) $(9) 15 6 1 (3) (8) 12 17 8 4 0 (4) 24 18 10 6 3 (0) 38 21 12 10 7 5 55 Shares Issued to Series B $ 16 $ 6 $ 2 $(2) $(7) $ 14 18 9 6 3 (1) 36 20 11 9 6 3 49 22 13 11 10 8 64 24 16 15 14 13 82 Shares Issued to Series B $ 19 $ 10 $ 7 $ 4 $ 1 $ 41 22 13 12 10 8 64 23 15 14 13 12 78 25 18 17 17 17 94 27 20 21 22 22 113 Shares Issued to Series B

GRAPHIC


PRELIMINARY CONFIDENTIAL DRAFT – FOR DISCUSSION PURPOSES ONLY Appendix A: Additional Materials

GRAPHIC


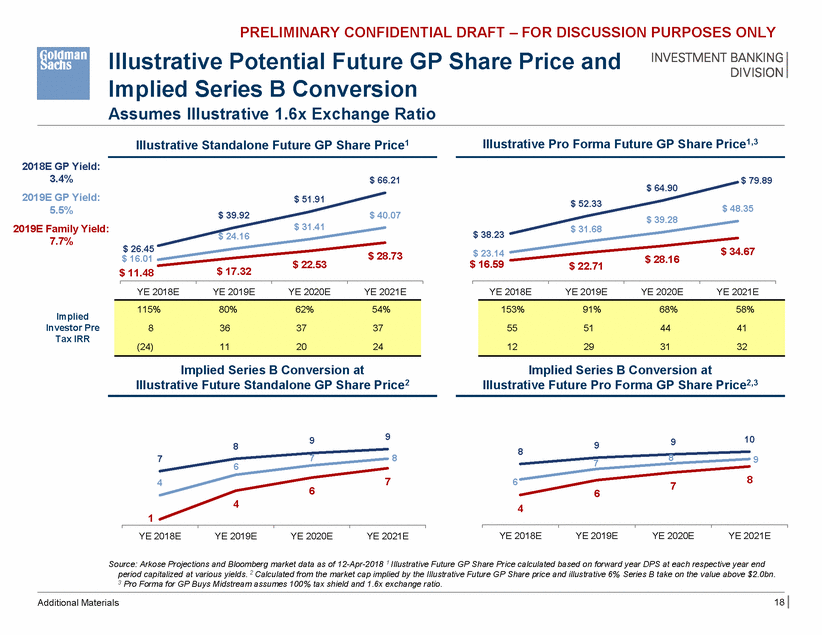
PRELIMINARY CONFIDENTIAL DRAFT – FOR DISCUSSION PURPOSES ONLY Illustrative Potential Future GP Implied Series B Conversion Assumes Illustrative 1.6x Exchange Ratio Share Price and Illustrative Pro Forma Future GP Share Price1,3 Illustrative Standalone Future GP Share Price1 2018E GP Yield: 3.4% 2019E GP Yield: 5.5% 2019E Family Yield: 7.7% $ 66.21 $ 79.89 $ 64.90 $ 51.91 $ 52.33 $ 48.35 $ 39.92 $ 40.07 $ 39.28 $ 31.41 $ 31.68 $ 38.23 $ 23.14 $ 16.59 $ 24.16 $ 26.45 $ 16.01 $ 11.48 $ 34.67 $ 28.73 $ 28.16 $ 22.53 $ 22.71 $ 17.32 YE 2018E YE 2019E YE 2020E YE 2021E YE 2018E YE 2019E YE 2020E YE 2021E Implied Investor Pre Tax IRR Implied Series B Conversion at Illustrative Future Standalone GP Share Price2 Implied Series B Conversion at Illustrative Future Pro Forma GP Share Price2,3 9 10 9 7 9 8 9 7 8 8 8 7 9 6 8 7 6 4 7 6 6 4 4 1 YE 2018E YE 2019E YE 2020E YE 2021E YE 2018E YE 2019E YE 2020E YE 2021E Source: Arkose Projections and Bloomberg market data as of 12-Apr-2018 1 Illustrative Future GP Share Price calculated based on forward year DPS at each respective year end period capitalized at various yields. 2 Calculated from the market cap implied by the Illustrative Future GP Share price and illustrative 6% Series B take on the value above $2.0bn. 3 Pro Forma for GP Buys Midstream assumes 100% tax shield and 1.6x exchange ratio. 18 Additional Materials 153%91%68%58% 55514441 12293132 115%80%62%54% 8363737 (24)112024

GRAPHIC


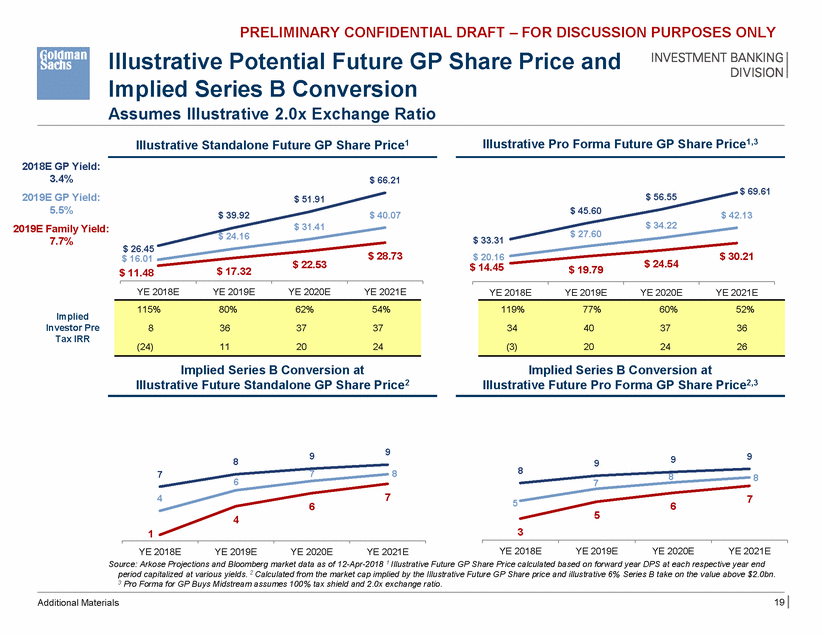
PRELIMINARY CONFIDENTIAL DRAFT – FOR DISCUSSION PURPOSES ONLY Illustrative Potential Future GP Implied Series B Conversion Assumes Illustrative 2.0x Exchange Ratio Share Price and Illustrative Pro Forma Future GP Share Price1,3 Illustrative Standalone Future GP Share Price1 2018E GP Yield: 3.4% 2019E GP Yield: 5.5% 2019E Family Yield: 7.7% $ 66.21 $ 69.61 $ 56.55 $ 51.91 $ 45.60 $ 39.92 $ 40.07 $ 42.13 $ 34.22 $ 31.41 $ 27.60 $ 24.16 $ 33.31 $ 20.16 $ 14.45 $ 26.45 $ 16.01 $ 11.48 $ 28.73 $ 30.21 $ 22.53 $ 24.54 $ 19.79 $ 17.32 YE 2018E YE 2019E YE 2020E YE 2021E YE 2018E YE 2019E YE 2020E YE 2021E Implied Investor Pre Tax IRR Implied Series B Conversion at Illustrative Future Standalone GP Share Price2 Implied Series B Conversion at Illustrative Future Pro Forma GP Share Price2,3 9 9 7 9 9 8 8 9 8 8 7 8 6 7 7 4 7 5 6 6 5 4 3 1 YE 2018E YE 2019E YE 2020E YE 2021E YE 2018E YE 2019E YE 2020E YE 2021E Source: Arkose Projections and Bloomberg market data as of 12-Apr-2018 1 Illustrative Future GP Share Price calculated based on forward year DPS at each respective year end period capitalized at various yields. 2 Calculated from the market cap implied by the Illustrative Future GP Share price and illustrative 6% Series B take on the value above $2.0bn. 3 Pro Forma for GP Buys Midstream assumes 100% tax shield and 2.0x exchange ratio. 19 Additional Materials 119%77%60%52% 34403736 (3)202426 115%80%62%54% 8363737 (24)112024

GRAPHIC


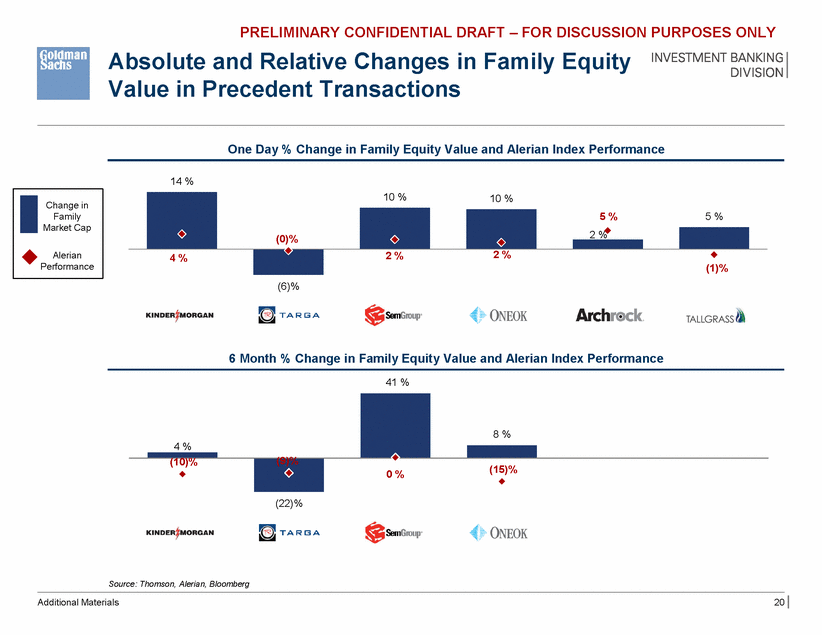
PRELIMINARY CONFIDENTIAL DRAFT – FOR DISCUSSION PURPOSES ONLY Absolute and Relative Changes in Family Equity Value in Precedent Transactions One Day % Change in Family Equity Value and Alerian Index Performance 14 % (1)% (6)% 6 Month % Change in Family Equity Value and Alerian Index Performance 41 % (22)% Source: Thomson, Alerian, Bloomberg Additional Materials 20 4 % 8 % (10)% (9)% 0 %(15)% 10 %10 % (0)% 5 %5 % 2 % 4 % 2 %2 % Change in Family Market Cap Alerian Performance

GRAPHIC


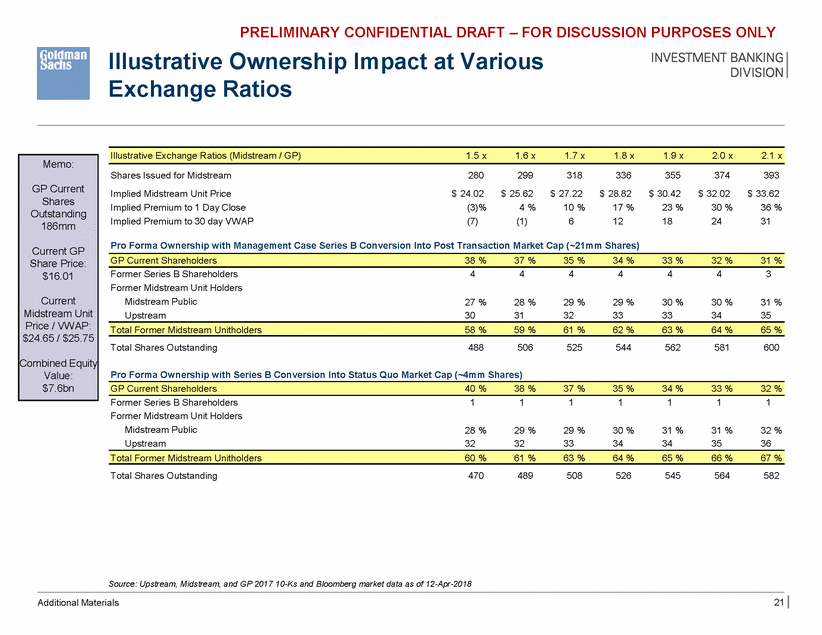
PRELIMINARY CONFIDENTIAL DRAFT – FOR DISCUSSION PURPOSES ONLY Illustrative Ownership Exchange Ratios Impact at Various Shares Issued for Midstream Implied Midstream Unit Price Implied Premium to 1 Day Close Implied Premium to 30 day VWAP 280 $ 24.02 (3)% (7) 299 $ 25.62 4 % (1) 318 $ 27.22 10 % 6 336 $ 28.82 17 % 12 355 $ 30.42 23 % 18 374 $ 32.02 30 % 24 393 $ 33.62 36 % 31 Pro Forma Ownership with Management Case Series B Conversion Into Post Transaction Market Cap (~21mm Shares) Former Series B Shareholders Former Midstream Unit Holders Midstream Public Upstream 4 4 4 4 4 4 3 27 % 30 28 % 31 29 % 32 29 % 33 30 % 33 30 % 34 31 % 35 Total Shares Outstanding 488 506 525 544 562 581 600 Pro Forma Ownership with Series B Conversion Into Status Quo Market Cap (~4mm Shares) Former Series B Shareholders Former Midstream Unit Holders Midstream Public Upstream 1 1 1 1 1 1 1 28 % 32 29 % 32 29 % 33 30 % 34 31 % 34 31 % 35 32 % 36 Total Shares Outstanding 470 489 508 526 545 564 582 Source: Upstream, Midstream, and GP 2017 10-Ks and Bloomberg market data as of 12-Apr-2018 21 Additional Materials Total Former Midstream Unitholders60 %61 %63 %64 %65 %66 %67 % GP Current Shareholders40 %38 %37 %35 %34 %33 %32 % Total Former Midstream Unitholders58 %59 %61 %62 %63 %64 %65 % GP Current Shareholders38 %37 %35 %34 %33 %32 %31 % Memo: GP Current Shares Outstanding 186mm Current GP Share Price: $16.01 Current Midstream Unit Price / VWAP: $24.65 / $25.75 Combined Equity Value: $7.6bn Illustrative Exchange Ratios (Midstream / GP)1.5 x1.6 x1.7 x1.8 x1.9 x2.0 x2.1 x

GRAPHIC


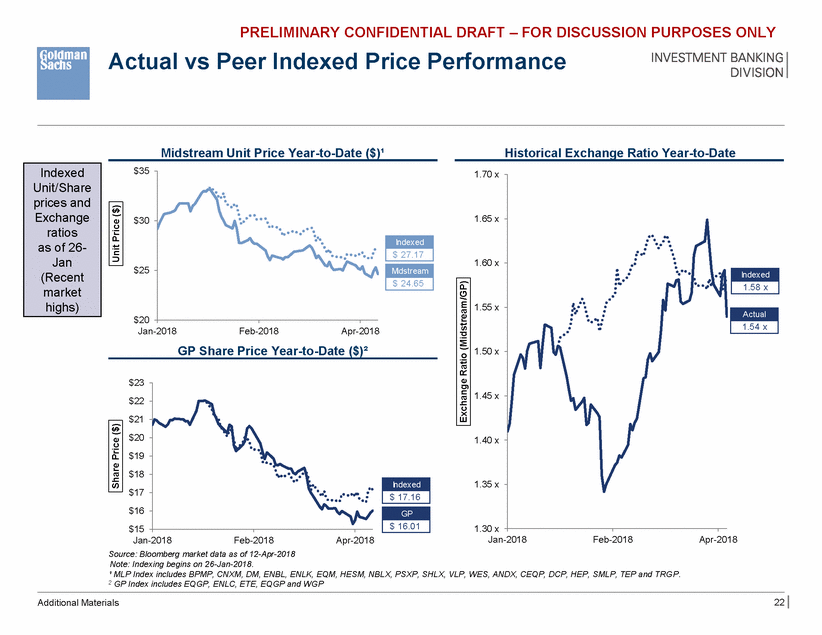
PRELIMINARY CONFIDENTIAL DRAFT – FOR DISCUSSION PURPOSES ONLY Actual vs Peer Indexed Price Performance Midstream Unit Price Year-to-Date ($)¹ Historical Exchange Ratio Year-to-Date $35 1.70 x 1.65 x $30 1.60 x $25 1.55 x $20 Jan-2018 Feb-2018 Apr-2018 GP Share Price Year-to-Date ($)² 1.50 x $23 $22 $21 $20 $19 $18 $17 $16 $15 1.45 x 1.40 x 1.35 x 1.30 x Jan-2018 Feb-2018 Apr-2018 Jan-2018 Feb-2018 Apr-2018 Source: Bloomberg market data as of 12-Apr-2018 Note: Indexing begins on 26-Jan-2018. ¹ MLP Index includes BPMP, CNXM, DM, ENBL, ENLK, EQM, HESM, NBLX, PSXP, SHLX, VLP, WES, ANDX, CEQP, DCP, HEP, SMLP, TEP and TRGP. 2 GP Index includes EQGP, ENLC, ETE, EQGP and WGP 22 Additional Materials Indexed $ 17.16 GP $ 16.01 Share Price ($) Actual 1.54 x Exchange Ratio (Midstream/GP) Indexed 1.58 x Indexed $ 27.17 Midstream $ 24.65 Unit Price ($) Indexed Unit/Share prices and Exchange ratios as of 26-Jan (Recent market highs)

GRAPHIC


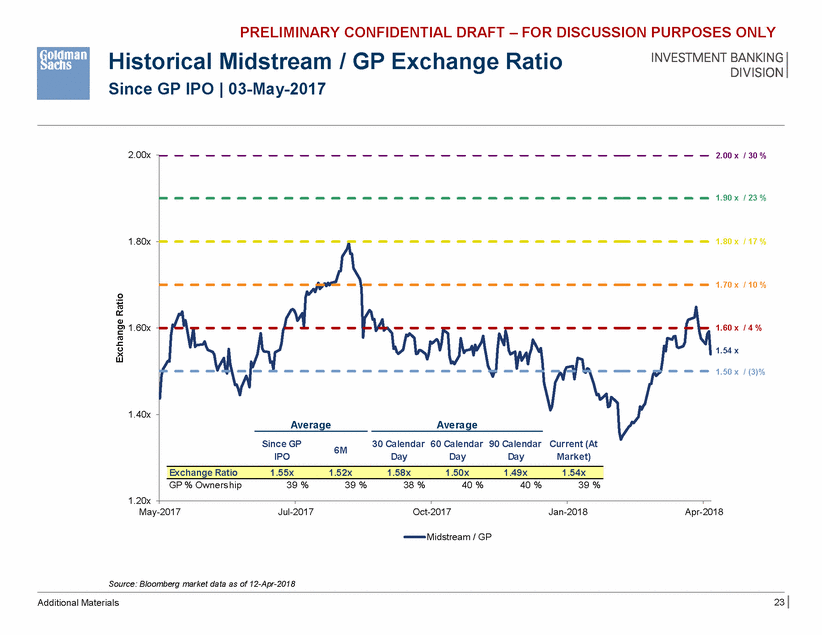
PRELIMINARY CONFIDENTIAL DRAFT – FOR DISCUSSION PURPOSES ONLY Historical Midstream / GP Exchange Ratio Since GP IPO | 03-May-2017 2.00x 2.00 x / 30 % 1.80x 30 60 901.90 x /C2u3r%rent Since GP ndar(At IPO ay Market) 1.80x 1.80 x / 17 % 1.70x 1.70 x / 10 % 1.60x 1.60x 1.60 x / 4 % 1.54 x 1.50 x / (3)% 1.49 x 1.50x 1.40x 1.40x 6M IPO Day Day Day Market) 1 1.30x .20x May-2017 Jul-2017 Oct-2017 Jan-2018 Apr-2018 May-2017 Jul-2017 Oct-2017 Dec-2017 Mar-2018 Midstream / GP Source: Bloomberg market data as of 12-Apr-2018 23 Additional Materials Exchange Ratio Exchange Ratio 47 x1.49 x Average 6MCalendar Calendar Cale DayDay D Exchange Ratio1.55 x1.52 x1.41 x1.45 x1. Average Average Since GP30 Calendar 60 Calendar 90 Calendar Current (At GP % Owners hip39 %39 %38 %40 %40 %39 % Exchange Ratio1.55x1.52x1.58x1.50x1.49x1.54x

GRAPHIC


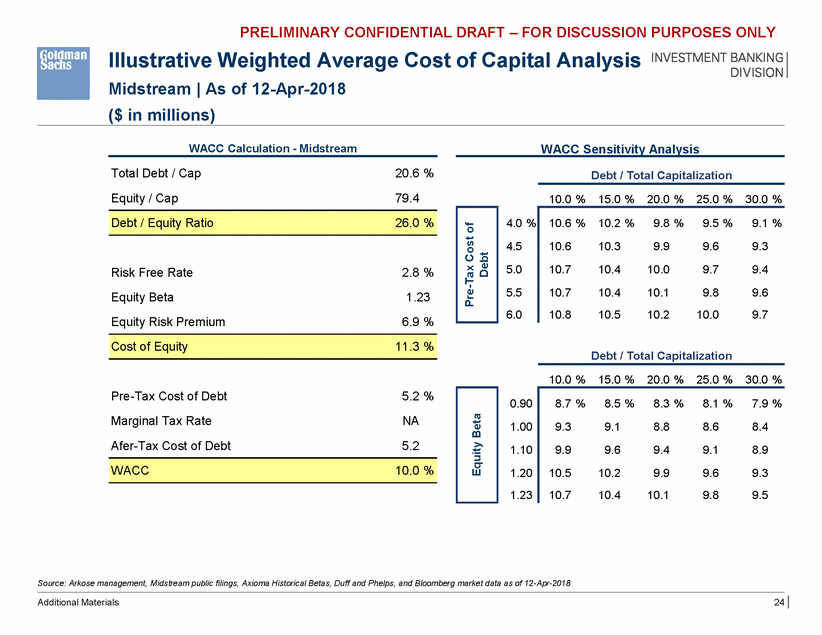
PRELIMINARY CONFIDENTIAL DRAFT – FOR DISCUSSION PURPOSES ONLY Illustrative Weighted Average Cost of Capital Analysis Midstream | As of 12-Apr-2018 ($ in millions) WACC Calculation - Midstream WACC Sensitivity Analysis Total Debt / Cap Equity / Cap 20.6 % 79.4 Debt / Total Capitalization 10.0 % 15.0 % 20.0 % 25.0 % 30.0 % 4.0 % 4.5 5.0 5.5 6.0 Risk Free Rate Equity Beta Equity Risk Premium 2.8 % 1.23 6.9 % Debt / Total Capitalization 10.0 % 15.0 % 20.0 % 25.0 % 30.0 % Pre-Tax Cost of Debt Marginal Tax Rate Afer-Tax Cost of Debt 5.2 % NA 5.2 0.90 1.00 1.10 1.20 1.23 Source: Arkose management, Midstream public filings, Axioma Historical Betas, Duff and Phelps, and Bloomberg market data as of 12-Apr-2018 Additional Materials 24 WACC 10.0 % 8.7 %8.5 %8.3 %8.1 %7.9 % 9.39.18.88.68.4 9.99.69.49.18.9 10.510.29.99.69.3 10.710.410.19.89.5 Equity Beta Cost of Equity 11.3 % Debt / Equity Ratio 26.0 % 10.6 %10.2 %9.8 %9.5 %9.1 % 10.610.39.99.69.3 10.710.410.09.79.4 10.710.410.19.89.6 10.810.510.210.09.7 Pre-Tax Cost of Debt

GRAPHIC


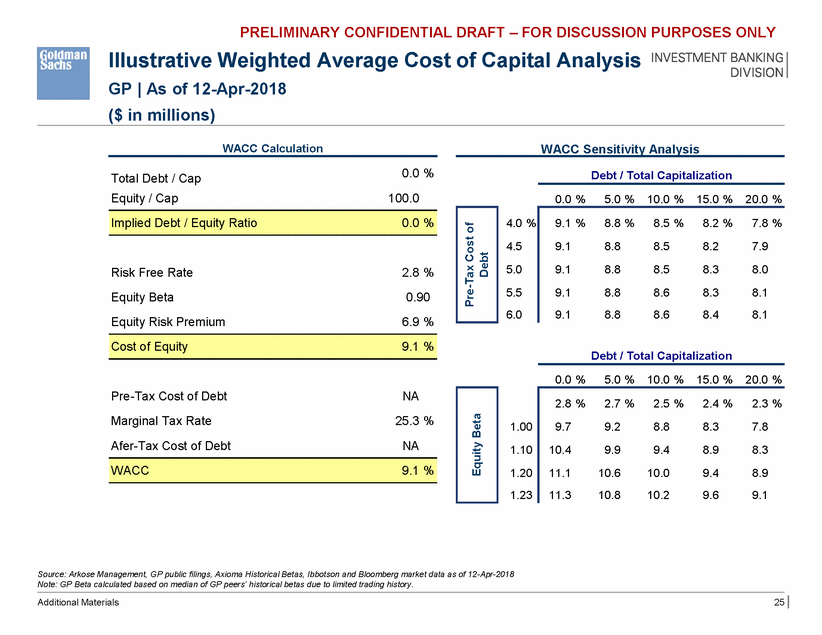
PRELIMINARY CONFIDENTIAL DRAFT – FOR DISCUSSION PURPOSES ONLY Illustrative Weighted Average Cost of Capital Analysis GP | As of 12-Apr-2018 ($ in millions) WACC Calculation WACC Sensitivity Analysis 0.0 % 100.0 Debt / Total Capitalization Total Debt / Cap Equity / Cap 0.0 % 5.0 % 10.0 % 15.0 % 20.0 % 4.0 % 4.5 5.0 5.5 6.0 Risk Free Rate Equity Beta Equity Risk Premium 2.8 % 0.90 6.9 % Debt / Total Capitalization 0.0 % 5.0 % 10.0 % 15.0 % 20.0 % Pre-Tax Cost of Debt Marginal Tax Rate Afer-Tax Cost of Debt NA 25.3 % NA 1.00 1.10 1.20 1.23 Source: Arkose Management, GP public filings, Axioma Historical Betas, Ibbotson and Bloomberg market data as of 12-Apr-2018 Note: GP Beta calculated based on median of GP peers’ historical betas due to limited trading history. Additional Materials 25 WACC 9.1 % 2.8 %2.7 %2.5 %2.4 %2.3 % 9.79.28.88.37.8 10.49.99.48.98.3 11.110.610.09.48.9 11.310.810.29.69.1 Equity Beta Cost of Equity 9.1 % Implied Debt / Equity Ratio 0.0 % 9.1 %8.8 %8.5 %8.2 %7.8 % 9.18.88.58.27.9 9.18.88.58.38.0 9.18.88.68.38.1 9.18.88.68.48.1 Pre-Tax Cost of Debt

GRAPHIC


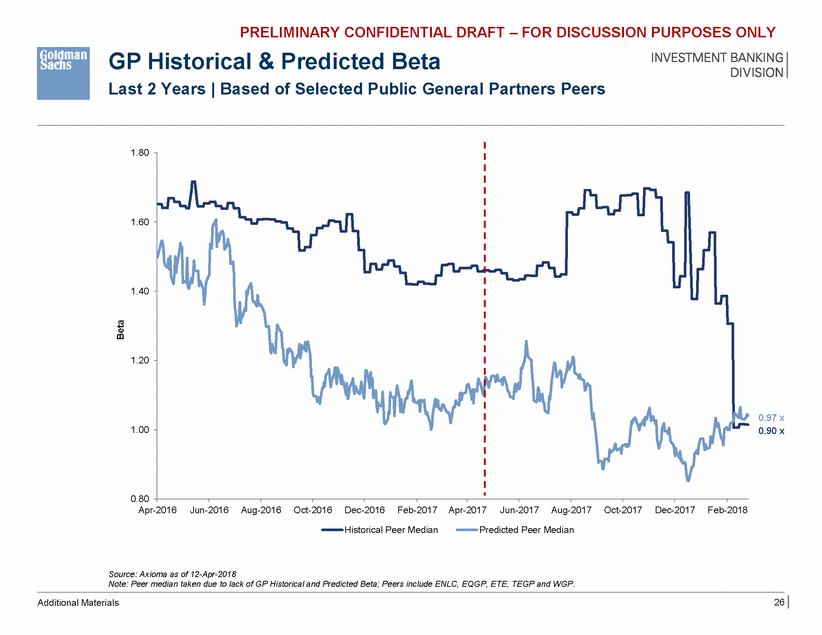
PRELIMINARY CONFIDENTIAL DRAFT – FOR DISCUSSION PURPOSES ONLY GP Historical & Predicted Beta Last 2 Years | Based of Selected Public General Partners Peers 1.80 1.60 1.40 1.20 0.97 x 0.90 x 1.00 0.80 Apr-2016 Jun-2016Aug-2016Oct-2016Dec-2016 Feb-2017Apr-2017 Jun-2017Aug-2017Oct-2017 Dec-2017 Feb-2018 Historical Peer Median Predicted Peer Median Source: Axioma as of 12-Apr-2018 Note: Peer median taken due to lack of GP Historical and Predicted Beta; Peers include ENLC, EQGP, ETE, TEGP and WGP. 26 Additional Materials Beta

GRAPHIC


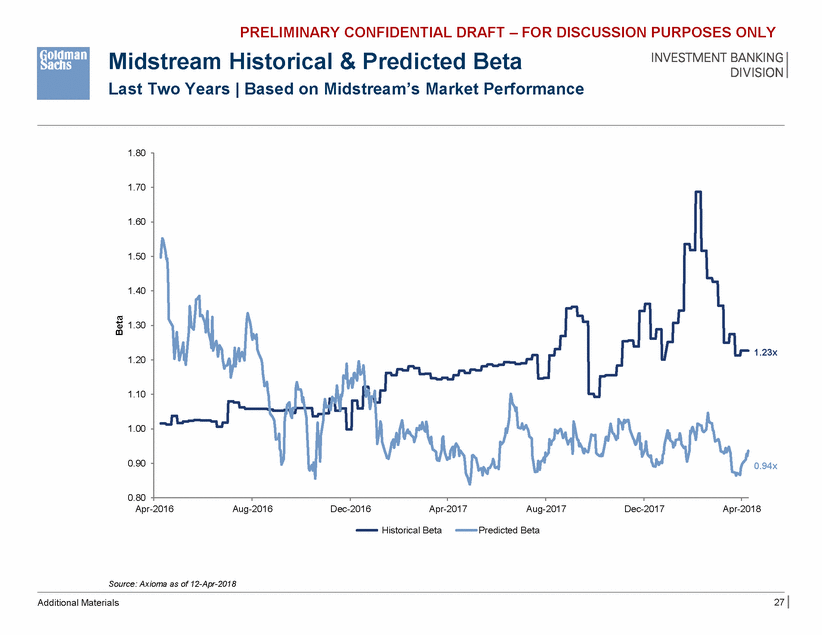
PRELIMINARY CONFIDENTIAL DRAFT – FOR DISCUSSION PURPOSES ONLY Midstream Historical & Predicted Beta Last Two Years | Based on Midstream’s Market Performance 1.80 1.70 1.60 1.50 1.40 1.30 1.23x 1.20 1.10 1.00 0.90 0.94x 0.80 Apr-2016 Aug-2016 Dec-2016 Apr-2017 Aug-2017 Dec-2017 Apr-2018 Historical Beta Predicted Beta Source: Axioma as of 12-Apr-2018 27 Additional Materials Beta

GRAPHIC


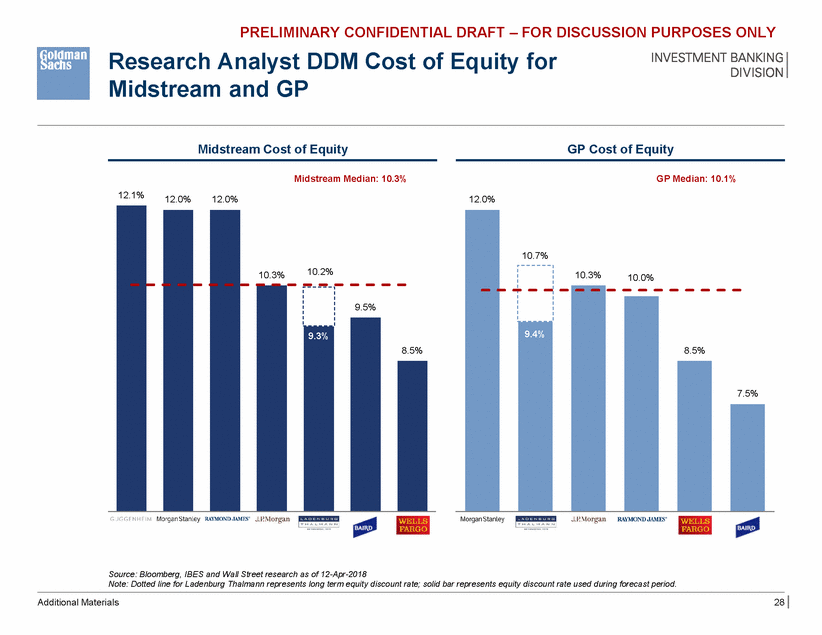
PRELIMINARY CONFIDENTIAL DRAFT – FOR DISCUSSION PURPOSES ONLY Research Analyst DDM Cost Midstream and GP of Equity for Midstream Cost of Equity GP Cost of Equity Midstream Median: 10.3% GP Median: 10.1% 12.1% 12.0% 12.0% 12.0% .5% .5% Source: Bloomberg, IBES and Wall Street research as of 12-Apr-2018 Note: Dotted line for Ladenburg Thalmann represents long term equity discount rate; solid bar represents equity discount rate used during forecast period. Additional Materials 28 10.7% 10.3%10.0% 8.5% 9.4% 7 10.3%10.2% 9.5% 8 9.3%

GRAPHIC


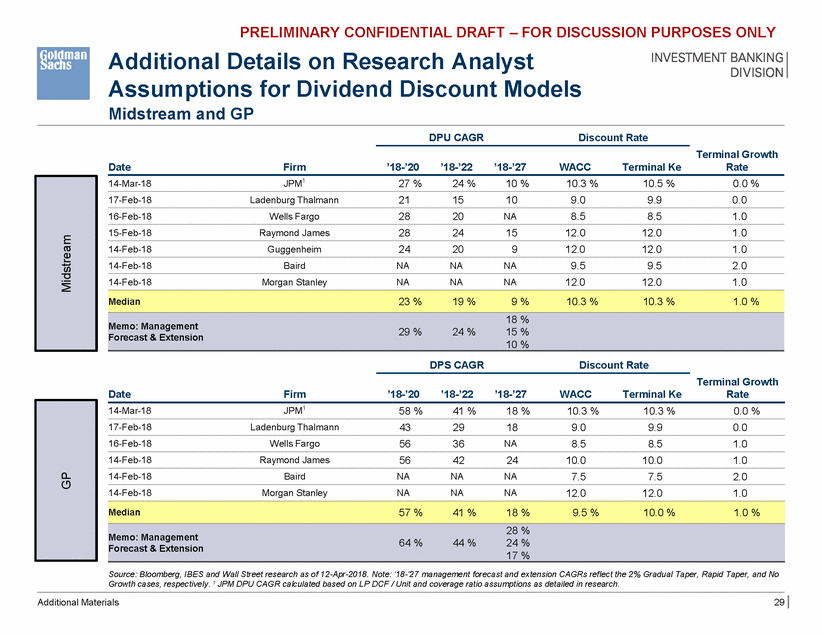
PRELIMINARY CONFIDENTIAL DRAFT – FOR DISCUSSION PURPOSES ONLY Additional Details on Research Analyst Assumptions for Dividend Discount Models Midstream and GP DPU CAGR Discount Rate Terminal Growth Rate Date Firm ’18-’20 ’18-’22 ’18-’27 WACC Terminal Ke JPM1 27 % 24 % 10 % 10.3 % 10.5 % 0.0 % 14-Mar-18 17-Feb-18 Ladenburg Thalmann 21 15 10 9.0 9.9 0.0 16-Feb-18 Wells Fargo 28 20 NA 8.5 8.5 1.0 15-Feb-18 Raymond James 28 24 15 12.0 12.0 1.0 14-Feb-18 Guggenheim 24 20 9 12.0 12.0 1.0 14-Feb-18 Baird NA NA NA 9.5 9.5 2.0 12.0 12.0 1.0 14-Feb-18 Morgan Stanley NA NA NA Memo: Management 10 % DPS CAGR Discount Rate Terminal Growth Rate Date Firm ’18-’20 ’18-’22 ’18-’27 WACC Terminal Ke JPM1 14-Mar-18 58 % 41 % 18 % 10.3 % 10.3 % 0.0 % 43 29 18 9.0 9.9 0.0 17-Feb-18 Ladenburg Thalmann 16-Feb-18 Wells Fargo 56 36 NA 8.5 8.5 1.0 14-Feb-18 Raymond James 56 42 24 10.0 10.0 1.0 14-Feb-18 Baird NA NA NA 7.5 7.5 2.0 14-Feb-18 Morgan Stanley NA NA NA 12.0 12.0 1.0 Memo: Management 17 % Source: Bloomberg, IBES and Wall Street research as of 12-Apr-2018. Note: ‘18-’27 management forecast and extension CAGRs reflect the 2% Gradual Taper, Rapid Taper, and No Growth cases, respectively. 1 JPM DPU CAGR calculated based on LP DCF / Unit and coverage ratio assumptions as detailed in research. Additional Materials 29 Median57 %41 %18 %9.5 %10.0 %1.0 % 28 % Forecast & Extension64 %44 %24 % GP Median23 %19 %9 %10.3 %10.3 %1.0 % 18 % Forecast & Extension29 %24 %15 % Midstream

GRAPHIC


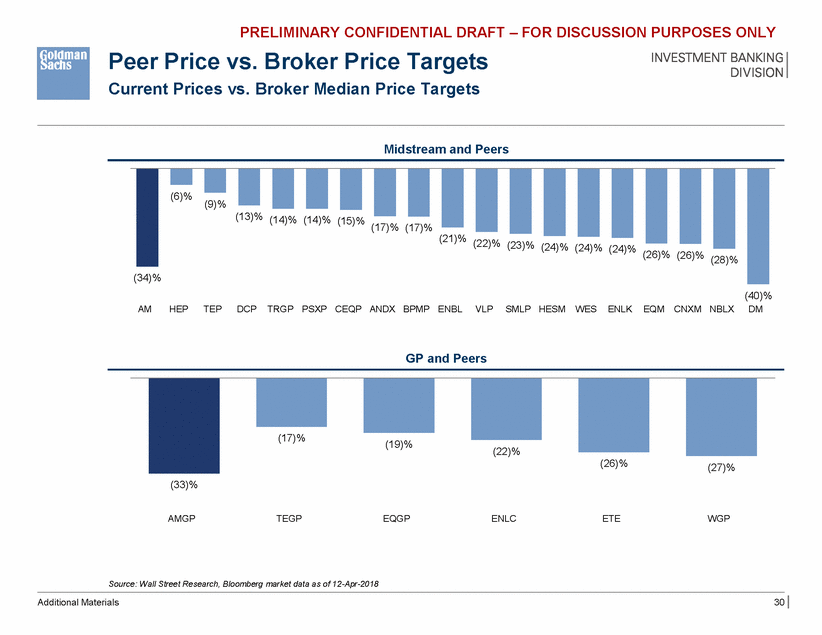
PRELIMINARY CONFIDENTIAL DRAFT – FOR DISCUSSION PURPOSES ONLY Peer Price vs. Broker Price Targets Current Prices vs. Broker Median Price Targets Midstream and Peers (9)% (17)% (17)% (21)% (22)% (23)% (24)% (24)% (24)% (40)% DM AM HEP TEP DCP TRGP PSXP CEQP ANDX BPMP ENBL VLPSMLP HESM WES ENLK EQM CNXM NBLX GP and Peers (17)% (19)% (22)% (33)% AMGP TEGP EQGP ENLC ETE WGP Source: Wall Street Research, Bloomberg market data as of 12-Apr-2018 Additional Materials 30 (26)%(27)% (6)% (13)% (14)% (14)% (15)% (26)% (26)% (28)% (34)%

GRAPHIC


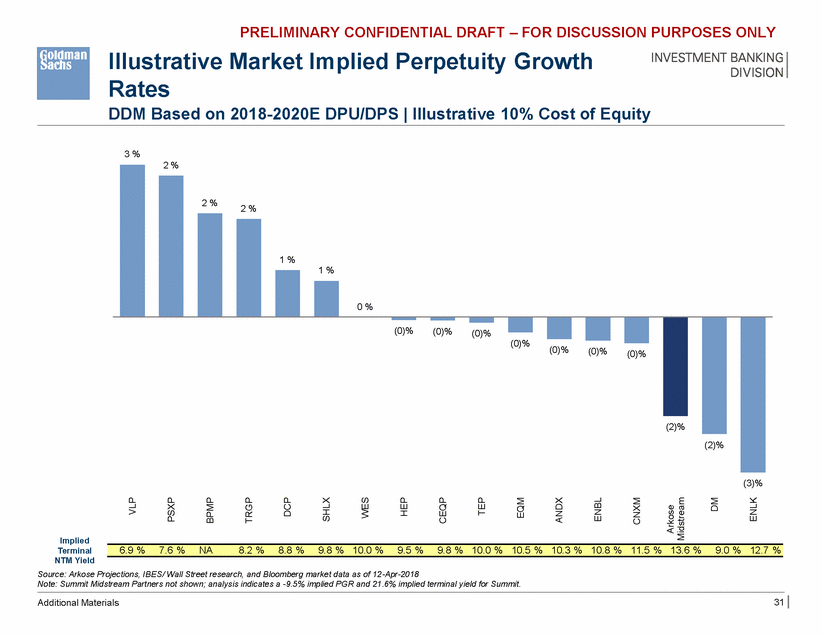
PRELIMINARY CONFIDENTIAL DRAFT – FOR DISCUSSION PURPOSES ONLY Illustrative Market Implied Perpetuity Growth Rates DDM Based on 2018-2020E DPU/DPS | Illustrative 10% Cost of Equity 3 % 2 % 1 % (0)% (0)% (0)% (0)% (0)% (0)% (0)% (3)% Implied Terminal NTM Yield Source: Arkose Projections, IBES/ Wall Street research, and Bloomberg market data as of 12-Apr-2018 Note: Summit Midstream Partners not shown; analysis indicates a -9.5% implied PGR and 21.6% implied terminal yield for Summit. 31 Additional Materials VLP PSXP BPMP TRGP DCP SHLX WES HEP CEQP TEP EQM ANDX ENBL CNXM Arkose Midstream DM ENLK 6.9 %7.6 %NA8.2 %8.8 %9.8 % 10.0 %9.5 %9.8 % 10.0 % 10.5 % 10.3 % 10.8 % 11.5 % 13.6 %9.0 % 12.7 % 2 %2 % 1 % 0 % (2)% (2)%

GRAPHIC


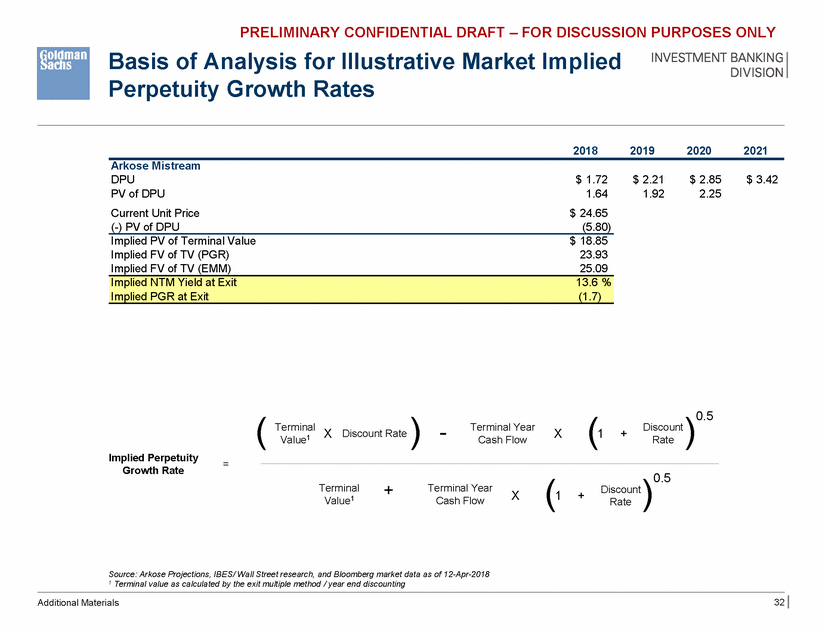
PRELIMINARY CONFIDENTIAL DRAFT – FOR DISCUSSION PURPOSES ONLY Basis of Analysis for Illustrative Market Implied Perpetuity Growth Rates 2018 2019 2020 2021 Arkose Mistream DPU PV of DPU Current Unit Price (-) PV of DPU $ 1.72 1.64 $ 24.65 (5.80) $ 2.21 1.92 $ 2.85 2.25 $ 3.42 Implied PV of Terminal Value Implied FV of TV (PGR) Implied FV of TV (EMM) $ 18.85 23.93 25.09 0.5 ( ) Terminal Year Cash Flow Discount Rate Implied Perpetuity Growth Rate = 0.5 (1 Rate ) + Terminal Value1 Terminal Year Cash Flow Discount X + Source: Arkose Projections, IBES/ Wall Street research, and Bloomberg market data as of 12-Apr-2018 1 Terminal value as calculated by the exit multiple method / year end discounting 32 Additional Materials Implied NTM Yield at Exit 13.6 % Implied PGR at Exit (1.7)

GRAPHIC