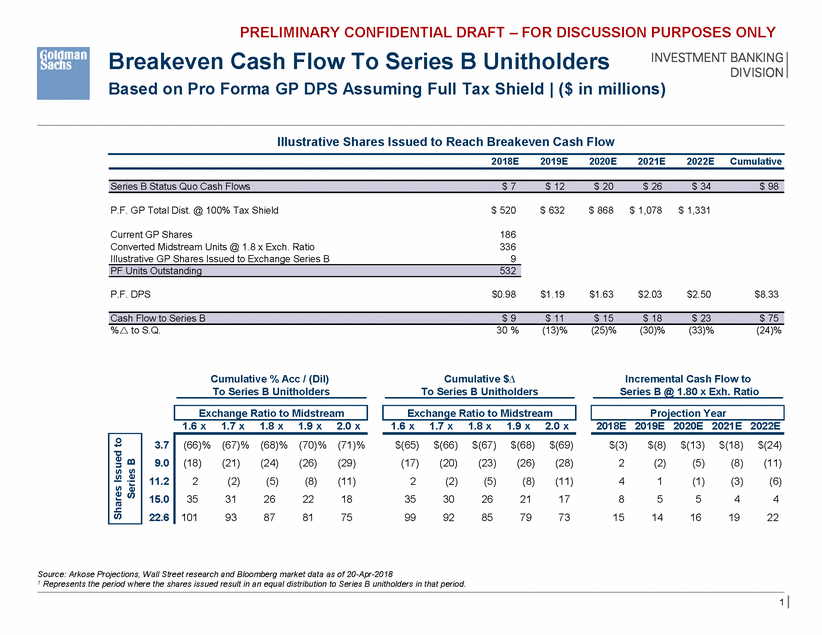
PRELIMINARY CONFIDENTIAL DRAFT – FOR DISCUSSION PURPOSES ONLY Breakeven Cash Flow To Series B Unitholders Based on Pro Forma GP DPS Assuming Full Tax Shield | ($ in millions) Illustrative Shares Issued to Reach Breakeven Cash Flow 2018E 2019E 2020E 2021E 2022E Cumulative P.F. GP Total Dist. @ 100% Tax Shield $ 520 $ 632 $ 868 $ 1,078 $ 1,331 Current GP Shares Converted Midstream Units @ 1.8 x Exch. Ratio Illustrative GP Shares Issued to Exchange Series B 186 336 9 P.F. DPS $0.98 $1.19 $1.63 $2.03 $2.50 $8.33 %r to S.Q. 30 % (13)% (25)% (30)% (33)% (24)% Cumulative % Acc / (Dil) To Series B Unitholders Cumulative $To Series B Unitholders Incremental Cash Flow to Series B @ 1.80 x Exh. Ratio 1.6 x 1.7 x 1.8 x 1.9 x 2.0 x 1.6 x 1.7 x 1.8 x 1.9 x 2.0 x 2018E 2019E 2020E 2021E 2022E 3.7 9.0 11.2 15.0 22.6 $(65) (17) 2 35 99 $(66) (20) (2) 30 92 $(67) (23) (5) 26 85 $(68) (26) (8) 21 79 $(69) (28) (11) 17 73 $(3) 2 4 8 15 $(8) (2) 1 5 14 $(13) (5) (1) 5 16 $(18) (8) (3) 4 19 $(24) (11) (6) 4 22 Source: Arkose Projections, Wall Street research and Bloomberg market data as of 20-Apr-2018 1 Represents the period where the shares issued result in an equal distribution to Series B unitholders in that period. 1 (66)%(67)%(68)%(70)%(71)% (18)(21)(24)(26)(29) 2(2)(5)(8)(11) 3531262218 10193878175 Shares Issued to Series B Projection Year Exchange Ratio to Midstream Exchange Ratio to Midstream Cash Flow to Series B $ 9 $ 11 $ 15 $ 18 $ 23 $ 75 PF Units Outstanding 532 Series B Status Quo Cash Flows $ 7 $ 12 $ 20 $ 26 $ 34 $ 98
