Exhibit (c)(8)

PRELIMINARY CONFIDENTIAL DRAFT – FOR DISCUSSION PURPOSES ONLY Project Francis Conflicts Committee GP LLC Discussion Materials of the Board of Directors of Arkose April 10, 2018 PRIVATE AND CONFIDENTIAL. This document is being sent to you for your information only as an investment banking client of Gol dman Sachs and should not be forwarded outside of your organization. This document has been prepared by the Investment Banking Division and is not a produ ct of Goldman Sachs Global Investment Research. This document should not be used as a basis for trading in the securities or loans of the companies name d herein or for any other investment decision. This document does not constitute an offer to sell the securities or loans of the companies named herein or a solic itation of proxies or votes and should not be construed as consisting of investment advice. Goldman Sachs does not provide accounting, tax, or legal advice.

GRAPHIC


PRELIMINARY CONFIDENTIAL DRAFT – FOR DISCUSSION PURPOSES ONLY Disclaimer These materials have been prepared and are provided by Goldman Sachs on a confidential basis solely for the information and assistance of the Conflicts Committee of Board of Directors of Arkose GP LLC (the “Committee"), the general partner of Arkose GP LP (the "Company"), in connection with its consideration of the matters referred to herein. These materials and Goldman Sachs’ presentation relating to these materials (the “Confidential Information”) may not be disclosed to any third party or circulated or referred to publicly or used for or relied upon for any other purpose without the prior written consent of Goldman Sachs. The Confidential Information was not prepared with a view to public disclosure or to conform to any disclosure standards under any state, federal or international securities laws or other laws, rules or regulations, and Goldman Sachs does not take any responsibility for the use of the Confidential Information by persons other than those set forth above. Notwithstanding anything in this Confidential Information to the contrary, the Company may disclose to any person the US federal income and state income tax treatment and tax structure of any transaction described herein and all materials of any kind (including tax opinions and other tax analyses) that are provided to the Company relating to such tax treatment and tax structure, without Goldman Sachs imposing any limitation of any kind. The Confidential Information has been prepared by the Investment Banking Division of Goldman Sachs and is not a product of its research department. Goldman Sachs and its affiliates are engaged in advisory, underwriting and financing, principal investing, sales and trading, research, investment management and other financial and non-financial activities and services for various persons and entities. Goldman Sachs and its affiliates and employees, and funds or other entities they manage or in which they invest or have other economic interests or with which they co-invest, may at any time purchase, sell, hold or vote long or short positions and investments in securities, derivatives, loans, commodities, currencies, credit default swaps and other financial instruments of the Company, any other party to any transaction and any of their respective affiliates or any currency or commodity that may be involved in any transaction. Goldman Sachs’ investment banking division maintains regular, ordinary course client service dialogues with clients and potential clients to review events, opportunities, and conditions in particular sectors and industries and, in that connection, Goldman Sachs may make reference to the Company, but Goldman Sachs will not disclose any confidential information received from the Company. The Confidential Information has been prepared based on historical financial information, forecasts and other information obtained by Goldman Sachs from publicly available sources, the management of the Company or other sources (approved for our use by the Company in the case of information from management and non-public information). In preparing the Confidential Information, Goldman Sachs has relied upon and assumed, without assuming any responsibility for independent verification, the accuracy and completeness of all of the financial, legal, regulatory, tax, accounting and other information provided to, discussed with or reviewed by us, and Goldman Sachs does not assume any liability for any such information. Goldman Sachs does not provide accounting, tax, legal or regulatory advice. Goldman Sachs has not made an independent evaluation or appraisal of the assets and liabilities (including any contingent, derivative or other off-balance sheet assets and liabilities) of the Company or any other party to any transaction or any of their respective affiliates and has no obligation to evaluate the solvency of the Company or any other party to any transaction under any state or federal laws relating to bankruptcy, insolvency or similar matters. The analyses contained in the Confidential Information do not purport to be appraisals nor do they necessarily reflect the prices at which businesses or securities actually may be sold or purchased. Goldman Sachs’ role in any due diligence review is limited solely to performing such a review as it shall deem necessary to support its own advice and analysis and shall not be on behalf of the Company. Analyses based upon forecasts of future results are not necessarily indicative of actual future results, which may be significantly more or less favorable than suggested by these analyses, and Goldman Sachs does not assume responsibility if future results are materially different from those forecast. The Confidential Information does not address the underlying business decision of the Company to engage in any transaction, or the relative merits of any transaction or strategic alternative referred to herein as compared to any other transaction or alternative that may be available to the Company. The Confidential Information is necessarily based on economic, monetary, market and other conditions as in effect on, and the information made available to Goldman Sachs as of, the date of such Confidential Information and Goldman Sachs assumes no responsibility for updating or revising the Confidential Information based on circumstances, developments or events occurring after such date. The Confidential Information does not constitute any opinion, nor does the Confidential Information constitute a recommendation to the Committee, any security holder of the Company or any other person as to how to vote or act with respect to any transaction or any other matter. The Confidential Information, including this disclaimer, is subject to, and governed by, any written agreement between the Company and the Committee, on the one hand, and Goldman Sachs, on the other hand. 1
GRAPHIC


PRELIMINARY CONFIDENTIAL DRAFT – FOR DISCUSSION PURPOSES ONLY Table of Contents I. Executive Summary Appendix A: Supplemental Materials 2

GRAPHIC


PRELIMINARY CONFIDENTIAL DRAFT – FOR DISCUSSION PURPOSES ONLY I. Executive Summary

GRAPHIC


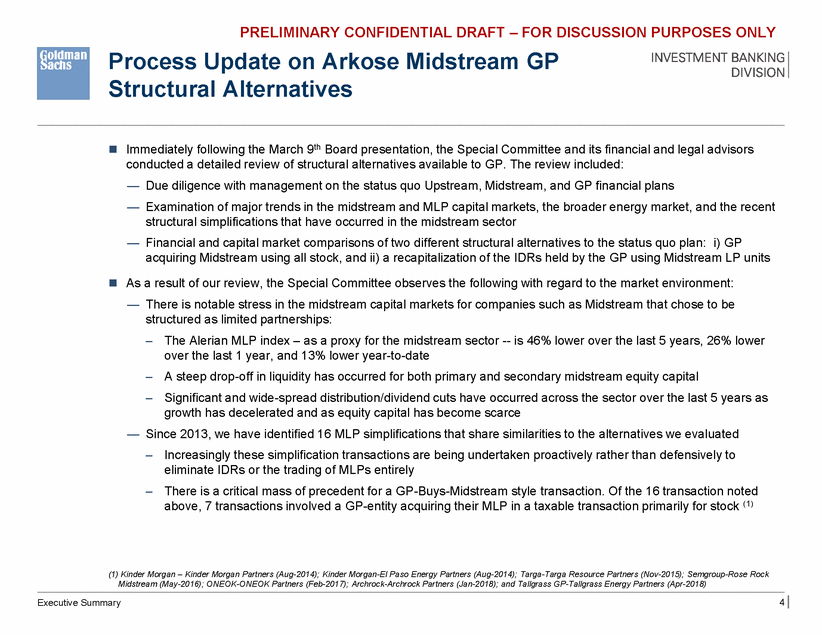
PRELIMINARY CONFIDENTIAL DRAFT – FOR DISCUSSION PURPOSES ONLY Process Update on Arkose Midstream GP Structural Alternatives  Immediately following the March 9th Board presentation, the Special Committee and its financial and legal advisors conducted a detailed review of structural alternatives available to GP. The review included: — — Due diligence with management on the status quo Upstream, Midstream, and GP financial plans Examination of major trends in the midstream and MLP capital markets, the broader energy market, and the recent structural simplifications that have occurred in the midstream sector Financial and capital market comparisons of two different structural alternatives to the status quo plan: i) GP acquiring Midstream using all stock, and ii) a recapitalization of the IDRs held by the GP using Midstream LP units —  As a result of our review, the Special Committee observes the following with regard to the market environment: — There is notable stress in the midstream capital markets for companies such as Midstream that chose to be structured as limited partnerships: – The Alerian MLP index – as a proxy for the midstream sector --is 46% lower over the last 5 years, 26% lower over the last 1 year, and 13% lower year-to-date A steep drop-off in liquidity has occurred for both primary and secondary midstream equity capital Significant and wide-spread distribution/dividend cuts have occurred across the sector over the last 5 years as growth has decelerated and as equity capital has become scarce – – — Since 2013, we have identified 16 MLP simplifications that share similarities to the alternatives we evaluated –Increasingly these simplification transactions are being undertaken proactively rather than defensively to eliminate IDRs or the trading of MLPs entirely –There is a critical mass of precedent for a GP-Buys-Midstream style transaction. Of the 16 transaction noted above, 7 transactions involved a GP-entity acquiring their MLP in a taxable transaction primarily for stock (1) (1) Kinder Morgan – Kinder Morgan Partners (Aug-2014); Kinder Morgan-El Paso Energy Partners (Aug-2014); Targa-Targa Resource Partners (Nov-2015); Semgroup-Rose Rock Midstream (May-2016); ONEOK-ONEOK Partners (Feb-2017); Archrock-Archrock Partners (Jan-2018); and Tallgrass GP-Tallgrass Energy Partners (Apr-2018) 4 Executive Summary

GRAPHIC


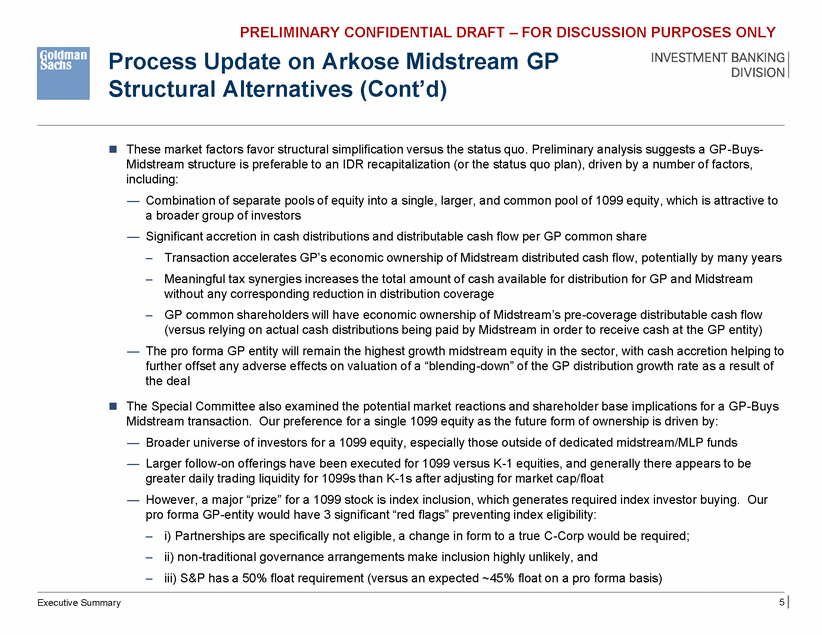
PRELIMINARY CONFIDENTIAL DRAFT – FOR DISCUSSION PURPOSES ONLY Process Update on Arkose Midstream GP Structural Alternatives (Cont’d)  These market factors favor structural simplification versus the status quo. Preliminary analysis suggests a GP-Buys-Midstream structure is preferable to an IDR recapitalization (or the status quo plan), driven by a number of factors, including: — Combination of separate pools of equity into a single, larger, and common pool of 1099 equity, which is attractive to a broader group of investors Significant accretion in cash distributions and distributable cash flow per GP common share — – – Transaction accelerates GP’s economic ownership of Midstream distributed cash flow, potentially by many years Meaningful tax synergies increases the total amount of cash available for distribution for GP and Midstream without any corresponding reduction in distribution coverage GP common shareholders will have economic ownership of Midstream’s pre-coverage distributable cash flow (versus relying on actual cash distributions being paid by Midstream in order to receive cash at the GP entity) – — The pro forma GP entity will remain the highest growth midstream equity in the sector, with cash accretion helping to further offset any adverse effects on valuation of a “blending-down” of the GP distribution growth rate as a result of the deal  The Special Committee also examined the potential market reactions and shareholder base implications for a GP-Buys Midstream transaction. Our preference for a single 1099 equity as the future form of ownership is driven by: — — Broader universe of investors for a 1099 equity, especially those outside of dedicated midstream/MLP funds Larger follow-on offerings have been executed for 1099 versus K-1 equities, and generally there appears to be greater daily trading liquidity for 1099s than K-1s after adjusting for market cap/float However, a major “prize” for a 1099 stock is index inclusion, which generates required index investor buying. Our pro forma GP-entity would have 3 significant “red flags” preventing index eligibility: — – – – i) Partnerships are specifically not eligible, a change in form to a true C-Corp would be required; ii) non-traditional governance arrangements make inclusion highly unlikely, and iii) S&P has a 50% float requirement (versus an expected ~45% float on a pro forma basis) 5 Executive Summary

GRAPHIC


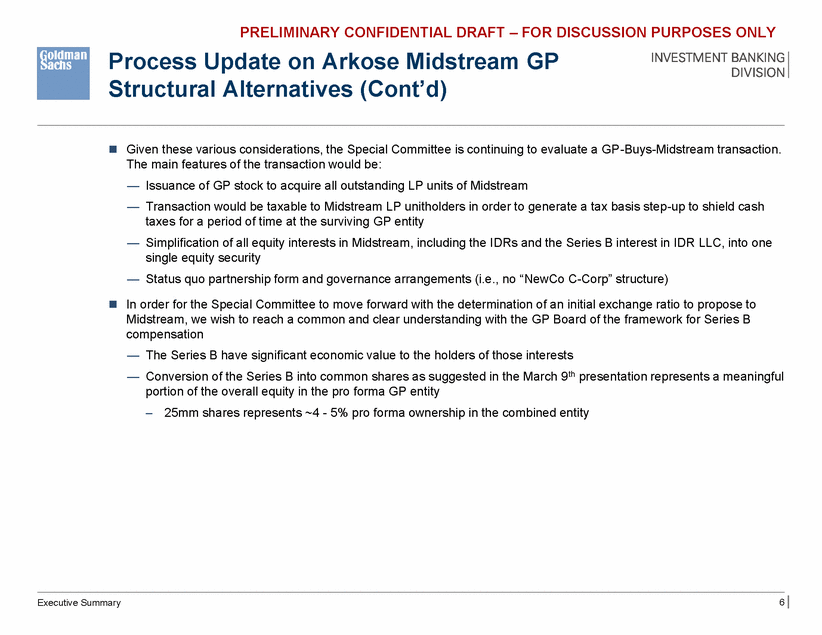
PRELIMINARY CONFIDENTIAL DRAFT – FOR DISCUSSION PURPOSES ONLY Process Update on Arkose Midstream GP Structural Alternatives (Cont’d)  Given these various considerations, the Special Committee is continuing to evaluate a GP-Buys-Midstream transaction. The main features of the transaction would be: — — Issuance of GP stock to acquire all outstanding LP units of Midstream Transaction would be taxable to Midstream LP unitholders in order to generate a tax basis step-up to shield cash taxes for a period of time at the surviving GP entity Simplification of all equity interests in Midstream, including the IDRs and the Series B interest in IDR LLC, into one single equity security Status quo partnership form and governance arrangements (i.e., no “NewCo C-Corp” structure) — —  In order for the Special Committee to move forward with the determination of an initial exchange ratio to propose to Midstream, we wish to reach a common and clear understanding with the GP Board of the framework for Series B compensation — — The Series B have significant economic value to the holders of those interests Conversion of the Series B into common shares as suggested in the March 9th presentation represents a meaningful portion of the overall equity in the pro forma GP entity –25mm shares represents ~4 - 5% pro forma ownership in the combined entity 6 Executive Summary

GRAPHIC


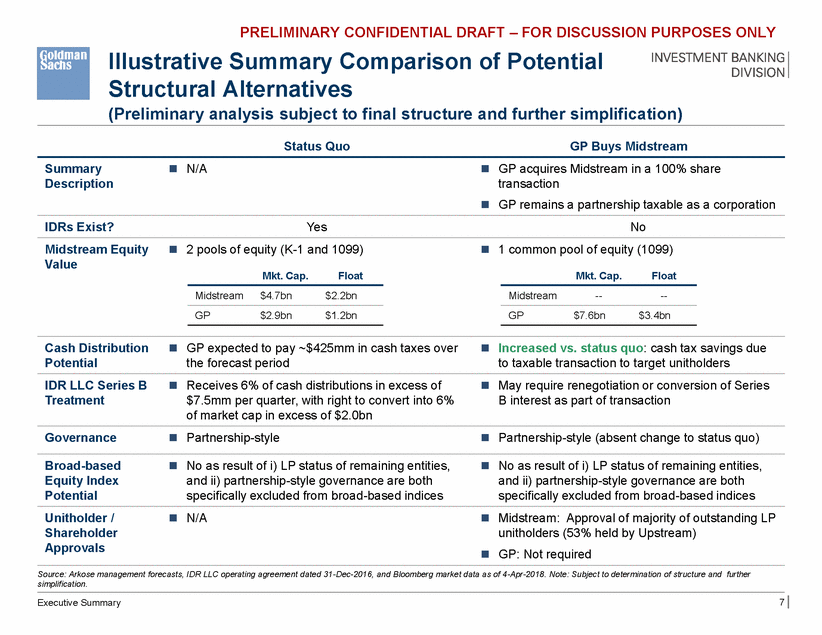
PRELIMINARY CONFIDENTIAL DRAFT – FOR DISCUSSION PURPOSES ONLY Illustrative Summary Comparison of Potential Structural Alternatives (Preliminary analysis subject to final structure and further simplification) Status Quo GP Buys Midstream Summary Description  N/A  GP acquires Midstream in a 100% share transaction GP remains a partnership taxable as a corporation  IDRs Exist? Yes No Midstream Equity Value  2 pools of equity (K-1 and 1099)  1 common pool of equity (1099) Mkt. Cap. Float Mkt. Cap. Float Midstream $4.7bn $2.2bn Midstream ---- GP $2.9bn $1.2bn GP $7.6bn $3.4bn Cash Distribution Potential  GP expected to pay ~$425mm in cash taxes over the forecast period  Increased vs. status quo: cash tax savings due to taxable transaction to target unitholders IDR LLC Series B Treatment  Receives 6% of cash distributions in excess of $7.5mm per quarter, with right to convert into 6% of market cap in excess of $2.0bn  May require renegotiation or conversion of Series B interest as part of transaction Governance  Partnership-style  Partnership-style (absent change to status quo) Broad-based Equity Index Potential  No as result of i) LP status of remaining entities, and ii) partnership-style governance are both specifically excluded from broad-based indices  No as result of i) LP status of remaining entities, and ii) partnership-style governance are both specifically excluded from broad-based indices Unitholder / Shareholder Approvals  N/A  Midstream: Approval of majority of outstanding LP unitholders (53% held by Upstream) GP: Not required  Source: Arkose management forecasts, IDR LLC operating agreement dated 31-Dec-2016, and Bloomberg market data as of 4-Apr-2018. Note: Subject to determination of structure and further simplification. 7 Executive Summary

GRAPHIC


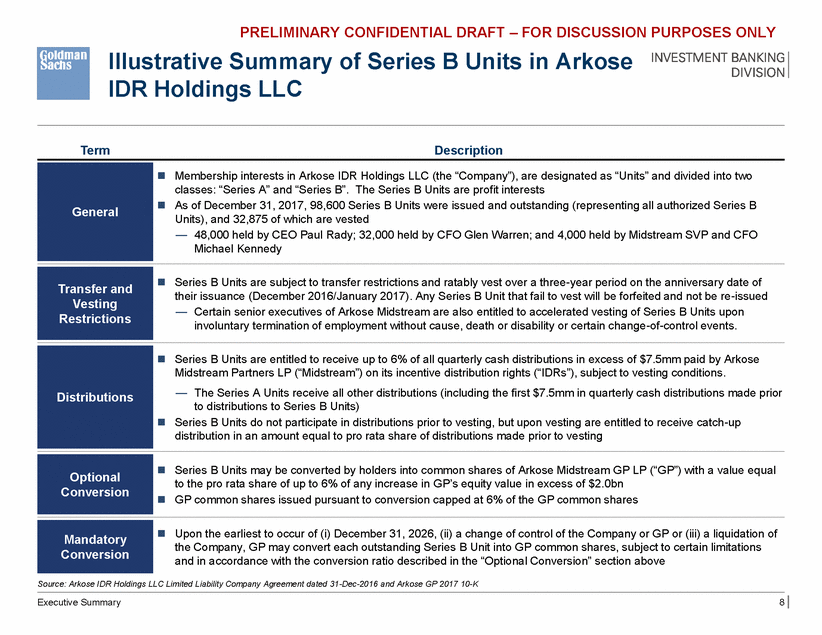
PRELIMINARY CONFIDENTIAL DRAFT – FOR DISCUSSION PURPOSES ONLY Illustrative Summary of Series B Units in Arkose IDR Holdings LLC Term Description  Membership interests in Arkose IDR Holdings LLC (the “Company”), are designated as “Units” and divided into two classes: “Series A” and “Series B”. The Series B Units are profit interests As of December 31, 2017, 98,600 Series B Units were issued and outstanding (representing all authorized Series B Units), and 32,875 of which are vested — 48,000 held by CEO Paul Rady; 32,000 held by CFO Glen Warren; and 4,000 held by Midstream SVP and CFO Michael Kennedy   Series B Units are subject to transfer restrictions and ratably vest over a three-year period on the anniversary date of their issuance (December 2016/January 2017). Any Series B Unit that fail to vest will be forfeited and not be re-issued — Certain senior executives of Arkose Midstream are also entitled to accelerated vesting of Series B Units upon involuntary termination of employment without cause, death or disability or certain change-of-control events.  Series B Units are entitled to receive up to 6% of all quarterly cash distributions in excess of $7.5mm paid by Arkose Midstream Partners LP (“Midstream”) on its incentive distribution rights (“IDRs”), subject to vesting conditions. — The Series A Units receive all other distributions (including the first $7.5mm in quarterly cash distributions made prior to distributions to Series B Units) Series B Units do not participate in distributions prior to vesting, but upon vesting are entitled to receive catch-up distribution in an amount equal to pro rata share of distributions made prior to vesting   Series B Units may be converted by holders into common shares of Arkose Midstream GP LP (“GP”) with a value equal to the pro rata share of up to 6% of any increase in GP’s equity value in excess of $2.0bn GP common shares issued pursuant to conversion capped at 6% of the GP common shares   Upon the earliest to occur of (i) December 31, 2026, (ii) a change of control of the Company or GP or (iii) a liquidation of the Company, GP may convert each outstanding Series B Unit into GP common shares, subject to certain limitations and in accordance with the conversion ratio described in the “Optional Conversion” section above Source: Arkose IDR Holdings LLC Limited Liability Company Agreement dated 31-Dec-2016 and Arkose GP 2017 10-K Executive Summary 8 Mandatory Conversion Optional Conversion Distributions Transfer and Vesting Restrictions General

GRAPHIC


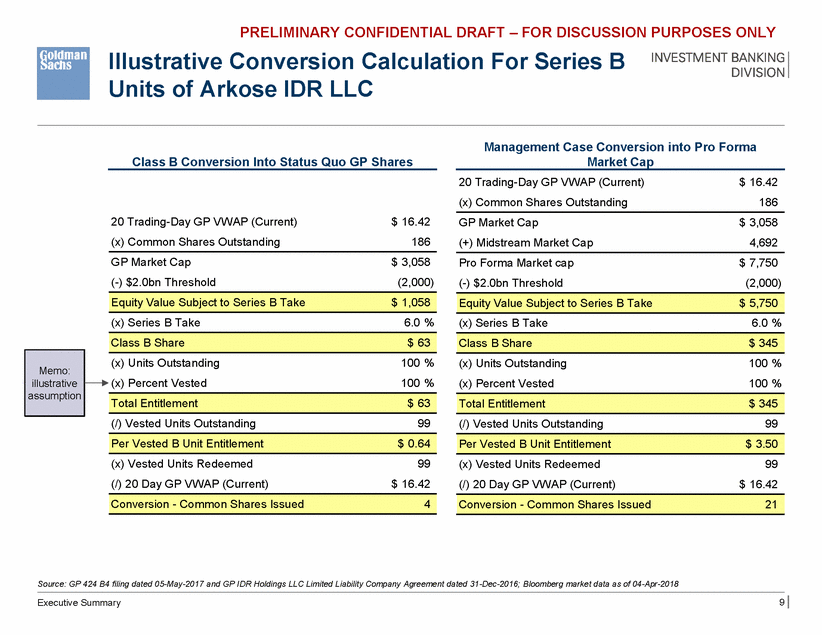
PRELIMINARY CONFIDENTIAL DRAFT – FOR DISCUSSION PURPOSES ONLY Illustrative Conversion Calculation For Series B Units of Arkose IDR LLC Management Case Conversion into Pro Forma Market Cap Class B Conversion Into Status Quo GP Shares 20 Trading-Day GP VWAP (Current) (x) Common Shares Outstanding $ 16.42 186 20 Trading-Day GP VWAP (Current) (x) Common Shares Outstanding $ 16.42 186 GP Market Cap (+) Midstream Market Cap $ 3,058 4,692 GP Market Cap (-) $2.0bn Threshold $ 3,058 (2,000) Pro Forma Market cap (-) $2.0bn Threshold $ 7,750 (2,000) (x) Series B Take 6.0 % (x) Series B Take 6.0 % (x) Units Outstanding (x) Percent Vested 100 % 100 % (x) Units Outstanding (x) Percent Vested 100 % 100 % (/) Vested Units Outstanding 99 (/) Vested Units Outstanding 99 (x) Vested Units Redeemed (/) 20 Day GP VWAP (Current) 99 $ 16.42 (x) Vested Units Redeemed (/) 20 Day GP VWAP (Current) 99 $ 16.42 Source: GP 424 B4 filing dated 05-May-2017 and GP IDR Holdings LLC Limited Liability Company Agreement dated 31-Dec-2016; Bloomberg market data as of 04-Apr-2018 9 Executive Summary Conversion - Common Shares Issued21 Conversion - Common Shares Issued 4 Per Vested B Unit Entitlement$ 3.50 Per Vested B Unit Entitlement $ 0.64 Total Entitlement$ 345 Total Entitlement $ 63 Memo: illustrative assumption Class B Share$ 345 Class B Share $ 63 Equity Value Subject to Series B Take$ 5,750 Equity Value Subject to Series B Take $ 1,058

GRAPHIC


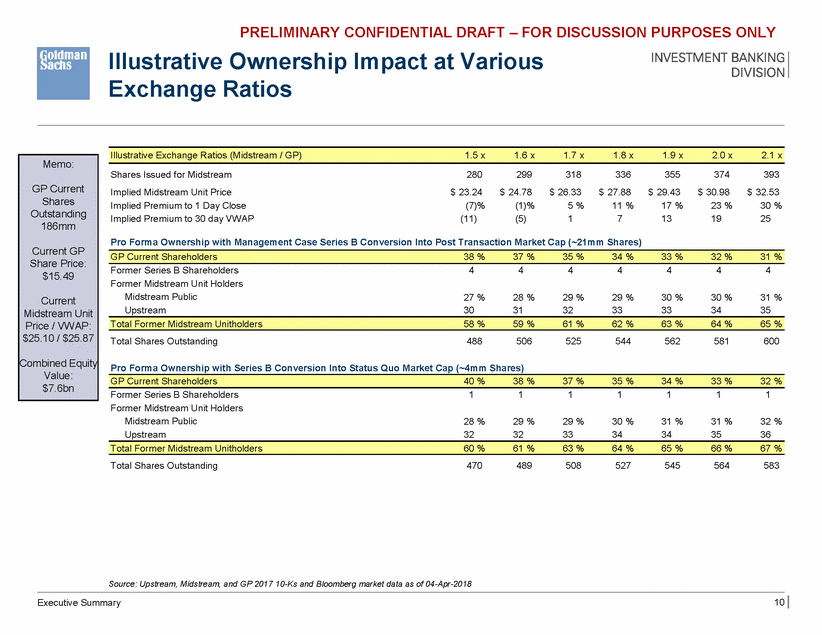
PRELIMINARY CONFIDENTIAL DRAFT – FOR DISCUSSION PURPOSES ONLY Illustrative Ownership Exchange Ratios Impact at Various Shares Issued for Midstream Implied Midstream Unit Price Implied Premium to 1 Day Close Implied Premium to 30 day VWAP 280 $ 23.24 (7)% (11) 299 $ 24.78 (1)% (5) 318 $ 26.33 5 % 1 336 $ 27.88 11 % 7 355 $ 29.43 17 % 13 374 $ 30.98 23 % 19 393 $ 32.53 30 % 25 Pro Forma Ownership with Management Case Series B Conversion Into Post Transaction Market Cap (~21mm Shares) Former Series B Shareholders Former Midstream Unit Holders Midstream Public Upstream 4 4 4 4 4 4 4 27 % 30 28 % 31 29 % 32 29 % 33 30 % 33 30 % 34 31 % 35 Total Shares Outstanding 488 506 525 544 562 581 600 Pro Forma Ownership with Series B Conversion Into Status Quo Market Cap (~4mm Shares) Former Series B Shareholders Former Midstream Unit Holders Midstream Public Upstream 1 1 1 1 1 1 1 28 % 32 29 % 32 29 % 33 30 % 34 31 % 34 31 % 35 32 % 36 Total Shares Outstanding 470 489 508 527 545 564 583 Source: Upstream, Midstream, and GP 2017 10-Ks and Bloomberg market data as of 04-Apr-2018 10 Executive Summary Total Former Midstream Unitholders 60 % 61 % 63 % 64 % 65 % 66 % 67 % GP Current Shareholders 40 % 38 % 37 % 35 % 34 % 33 % 32 % Total Former Midstream Unitholders 58 % 59 % 61 % 62 % 63 % 64 % 65 % GP Current Shareholders 38 % 37 % 35 % 34 % 33 % 32 % 31 % Memo: GP Current Shares Outstanding 186mm Current GP Share Price: $15.49 Current Midstream Unit Price / VWAP: $25.10 / $25.87 Combined Equity Value: $7.6bn Illustrative Exchange Ratios (Midstream / GP) 1.5 x 1.6 x 1.7 x 1.8 x 1.9 x 2.0 x 2.1 x

GRAPHIC


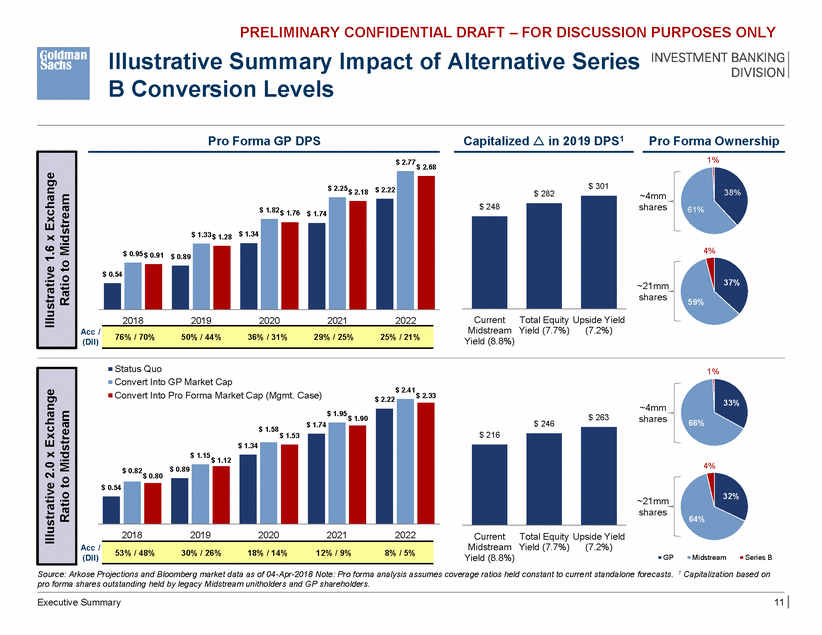
PRELIMINARY CONFIDENTIAL DRAFT – FOR DISCUSSION PURPOSES ONLY Illustrative Summary Impact of Alternative Series B Conversion Levels Pro Forma GP DPS Capitalized  in 2019 DPS1 Pro Forma Ownership 1% $ 2.77 $ 2.68 $ 301 $ 2.18 $ 282 ~4mm shares 61% $ 1.76 $ 1.74 4% $ 0.91 $ 0.89 37% ~21mm shares 59% CurrentTotal Equity Upside Yield 2018 2019 2020 2021 2022 Midstream Yield (7.7%) Yield (8.8%) (7.2%) Acc / (Dil) Status Quo Convert Into GP Market Cap Convert Into Pro Forma Market Cap (Mgmt. Case) 1% $ 2.41 $ 2.33 33% ~4mm shares $ 263 $ 1.90 66% $ 246 $ 1.58 $ 1.12 4% $ 0.80 32% ~21mm shares 64% 2018 2019 2020 2021 2022 CurrentTotal Equity Upside Yield Midstream Yield (7.7%) Yield (8.8%) (7.2%) Acc / (Dil) GP Midstream Series B Source: Arkose Projections and Bloomberg market data as of 04-Apr-2018 Note: Pro forma analysis assumes coverage ratios held constant to current standalone forecasts. 1 Capitalization based on pro forma shares outstanding held by legacy Midstream unitholders and GP shareholders. Executive Summary 11 53% / 48%30% / 26%18% / 14%12% / 9%8% / 5% $ 216 $ 2.22 $ 1.95 $ 1.74 $ 1.53 $ 1.34 $ 1.15 $ 0.82$ 0.89 $ 0.54 Illustrative 2.0 x Exchange Ratio to Midstream 76% / 70%50% / 44%36% / 31%29% / 25%25% / 21% $ 248 $ 2.25$ 2.22 $ 1.82 $ 1.33 $ 1.28 $ 1.34 $ 0.95 $ 0.54 Illustrative 1.6 x Exchange Ratio to Midstream

GRAPHIC


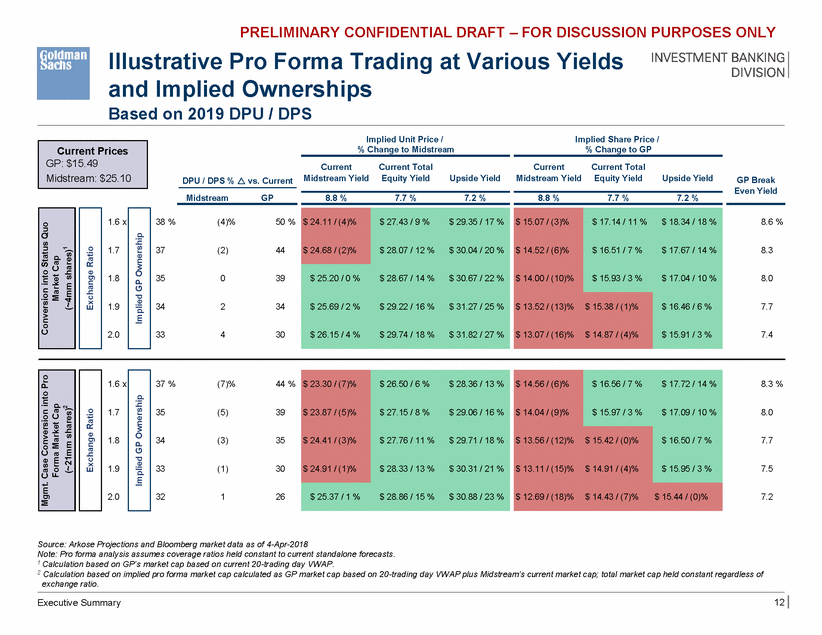
PRELIMINARY CONFIDENTIAL DRAFT – FOR DISCUSSION PURPOSES ONLY Illustrative Pro Forma Trading at and Implied Ownerships Based on 2019 DPU / DPS Various Yields Implied Unit Price / % Change to Midstream Implied Share Price / % Change to GP Current Midstream Yield Current Total Equity Yield Current Midstream Yield Current Total Equity Yield Upside Yield Upside Yield GP Break Even Yield DPU / DPS %  vs. Current Midstream GP 8.8 % 7.7 % 7.2 % 8.8 % 7.7 % 7.2 % 1.6 x 38 % (4)% 50 % 8.6 % 1.7 37 (2) 44 8.3 1.8 35 0 39 8.0 1.9 34 2 34 7.7 2.0 33 4 30 7.4 1.6 x 37 % (7)% 44 % 8.3 % 1.7 35 (5) 39 8.0 1.8 34 (3) 35 7.7 1.9 33 (1) 30 7.5 2.0 32 1 26 7.2 Source: Arkose Projections and Bloomberg market data as of 4-Apr-2018 Note: Pro forma analysis assumes coverage ratios held constant to current standalone forecasts. 1 Calculation based on GP’s market cap based on current 20-trading day VWAP. 2 Calculation based on implied pro forma market cap calculated as GP market cap based on 20-trading day VWAP plus Midstream’s current market cap; total market cap held constant regardless of exchange ratio. 12 Executive Summary $ 14.56 / (6)% $ 14.04 / (9)% $ 16.56 / 7 % $ 17.72 / 14 % $ 15.97 / 3 % $ 17.09 / 10 % $ 13.56 / (12)% $ 15.42 / (0)% $ 13.11 / (15)% $ 14.91 / (4)% $ 16.50 / 7 % $ 15.95 / 3 % $ 12.69 / (18)% $ 14.43 / (7)% $ 15.44 / (0)% $ 23.30 / (7)% $ 23.87 / (5)% $ 24.41 / (3)% $ 24.91 / (1)% $ 26.50 / 6 % $ 28.36 / 13 % $ 27.15 / 8 % $ 29.06 / 16 % $ 27.76 / 11 % $ 29.71 / 18 % $ 28.33 / 13 % $ 30.31 / 21 % $ 25.37 / 1 % $ 28.86 / 15 % $ 30.88 / 23 % Implied GP Ownership Exchange Ratio Mgmt. Case Conversion into Pro Forma Market Cap (~21mm shares)2 $ 15.07 / (3)% $ 14.52 / (6)% $ 14.00 / (10)% $ 17.14 / 11 % $ 18.34 / 18 % $ 16.51 / 7 % $ 17.67 / 14 % $ 15.93 / 3 % $ 17.04 / 10 % $ 13.52 / (13)% $ 15.38 / (1)% $ 13.07 / (16)% $ 14.87 / (4)% $ 16.46 / 6 % $ 15.91 / 3 % $ 24.11 / (4)% $ 24.68 / (2)% $ 27.43 / 9 % $ 29.35 / 17 % $ 28.07 / 12 % $ 30.04 / 20 % $ 25.20 / 0 % $ 28.67 / 14 % $ 30.67 / 22 % $ 25.69 / 2 % $ 29.22 / 16 % $ 31.27 / 25 % $ 26.15 / 4 % $ 29.74 / 18 % $ 31.82 / 27 % Implied GP Ownership Exchange Ratio Conversion into Status Quo Market Cap (~4mm shares)1 Current Prices GP: $15.49 Midstream: $25.10

GRAPHIC


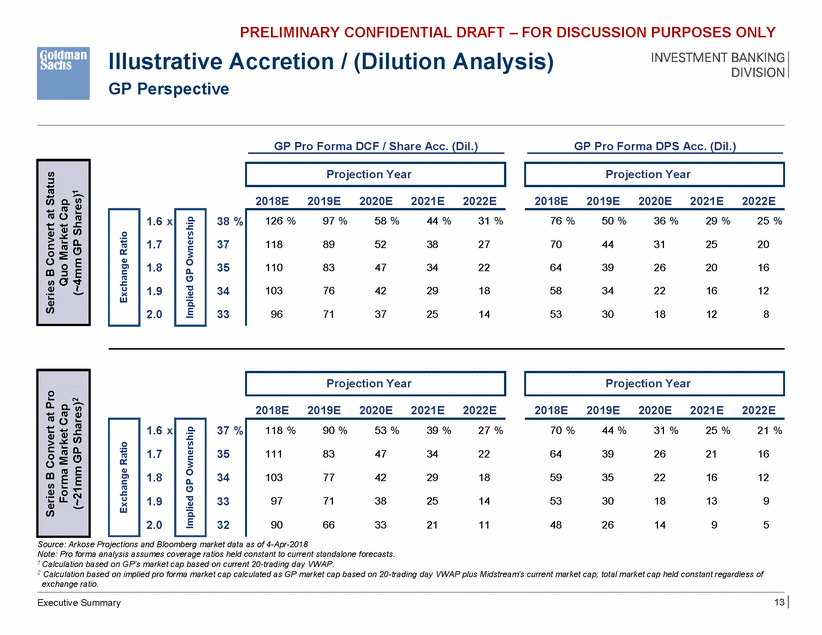
PRELIMINARY CONFIDENTIAL DRAFT – FOR DISCUSSION PURPOSES ONLY Illustrative Accretion / (Dilution Analysis) GP Perspective GP Pro Forma DCF / Share Acc. (Dil.) GP Pro Forma DPS Acc. (Dil.) 2018E 2019E 2020E 2021E 2022E 2018E 2019E 2020E 2021E 2022E 1.6 x 1.7 1.8 1.9 2.0 38 % 37 35 34 33 76 % 50 % 36 % 29 % 25 % 70 44 31 25 20 64 39 26 20 16 58 34 22 16 12 53 30 18 12 8 2018E 2019E 2020E 2021E 2022E 2018E 2019E 2020E 2021E 2022E 1.6 x 1.7 1.8 37 % 35 34 70 % 44 % 31 % 25 % 21 % 64 39 26 21 16 59 35 22 16 12 1.9 33 53 30 18 13 9 2.0 32 48 26 14 9 5 Source: Arkose Projections and Bloomberg market data as of 4-Apr-2018 Note: Pro forma analysis assumes coverage ratios held constant to current standalone forecasts. 1 Calculation based on GP’s market cap based on current 20-trading day VWAP. 2 Calculation based on implied pro forma market cap calculated as GP market cap based on 20-trading day VWAP plus Midstream’s current market cap; total market cap held constant regardless of exchange ratio. 13 Executive Summary 118 % 90 % 53 % 39 % 27 % 111 83 47 34 22 103 77 42 29 18 97 71 38 25 14 90 66 33 21 11 Implied GP Ownership Exchange Ratio Series B Convert at Pro Forma Market Cap (~21mm GP Shares)2 Projection Year Projection Year 126 % 97 % 58 % 44 % 31 % 118 89 52 38 27 110 83 47 34 22 103 76 42 29 18 96 71 37 25 14 Implied GP Ownership Exchange Ratio Projection Year Projection Year Series B Convert at Status Quo Market Cap (~4mm GP Shares)1

GRAPHIC


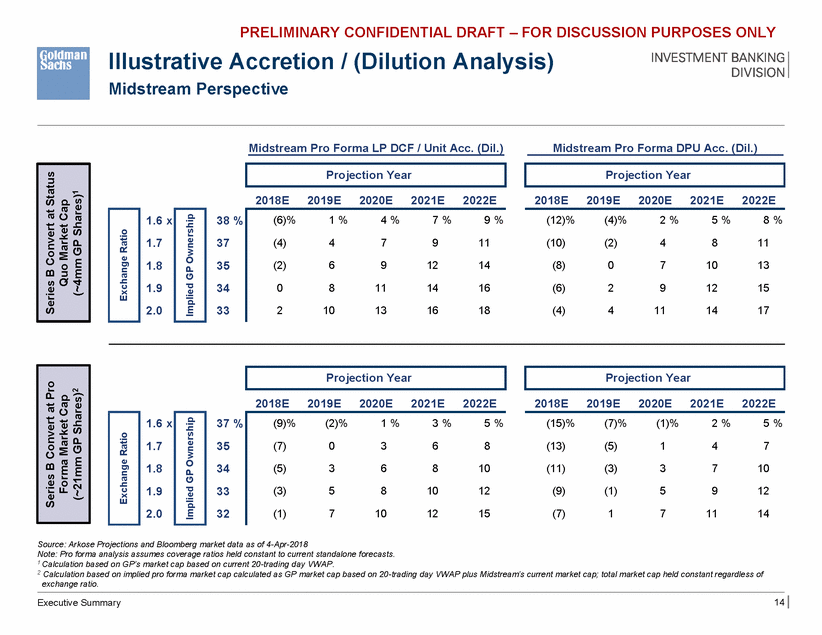
PRELIMINARY CONFIDENTIAL DRAFT – FOR DISCUSSION PURPOSES ONLY Illustrative Accretion / (Dilution Analysis) Midstream Perspective Midstream Pro Forma LP DCF / Unit Acc. (Dil.) Midstream Pro Forma DPU Acc. (Dil.) 2018E 2019E 2020E 2021E 2022E 2018E 2019E 2020E 2021E 2022E 1.6 x 1.7 1.8 1.9 2.0 38 % 37 35 34 33 (12)% (4)% 2 % 5 % 8 % (10) (2) 4 8 11 (8) 0 7 10 13 (6) 2 9 12 15 (4) 4 11 14 17 2018E 2019E 2020E 2021E 2022E 2018E 2019E 2020E 2021E 2022E 1.6 x 1.7 1.8 1.9 2.0 37 % 35 34 33 32 (15)% (7)% (1)% 2 % 5 % (13) (5) 1 4 7 (11) (3) 3 7 10 (9) (1) 5 9 12 (7) 1 7 11 14 Source: Arkose Projections and Bloomberg market data as of 4-Apr-2018 Note: Pro forma analysis assumes coverage ratios held constant to current standalone forecasts. 1 Calculation based on GP’s market cap based on current 20-trading day VWAP. 2 Calculation based on implied pro forma market cap calculated as GP market cap based on 20-trading day VWAP plus Midstream’s current market cap; total market cap held constant regardless of exchange ratio. 14 Executive Summary (9)% (2)% 1 % 3 % 5 % (7) 0 3 6 8 (5) 3 6 8 10 (3) 5 8 10 12 (1) 7 10 12 15 Implied GP Ownership Exchange Ratio Series B Convert at Pro Forma Market Cap (~21mm GP Shares)2 Projection Year Projection Year (6)% 1 % 4 % 7 % 9 % (4) 4 7 9 11 (2) 6 9 12 14 0 8 11 14 16 2 10 13 16 18 Implied GP Ownership Exchange Ratio Series B Convert at Status Quo Market Cap (~4mm GP Shares)1 Projection Year Projection Year

GRAPHIC


PRELIMINARY CONFIDENTIAL DRAFT – FOR DISCUSSION PURPOSES ONLY Appendix A: Supplemental Materials

GRAPHIC


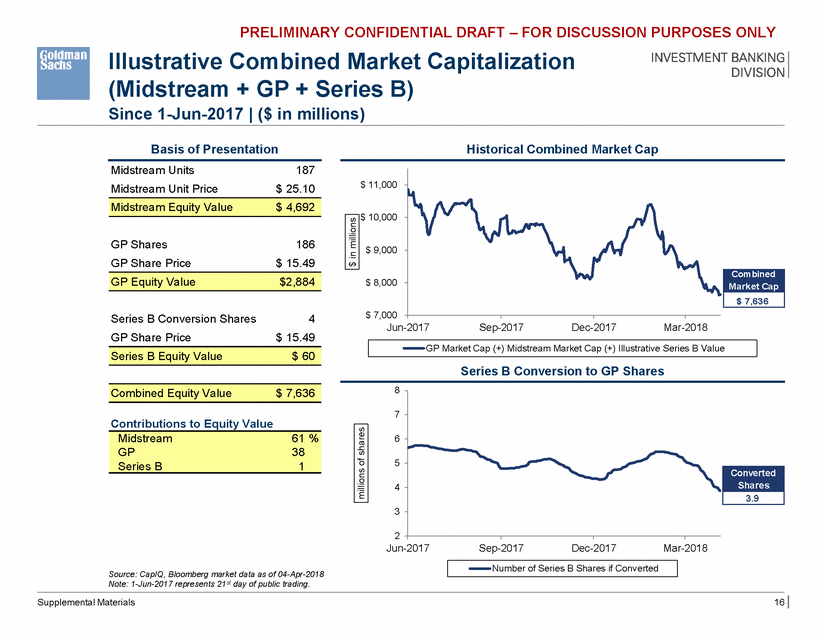
PRELIMINARY CONFIDENTIAL DRAFT – FOR DISCUSSION PURPOSES ONLY Illustrative Combined Market (Midstream + GP + Series B) Since 1-Jun-2017 | ($ in millions) Capitalization Basis of Presentation Historical Combined Market Cap Midstream Units Midstream Unit Price 187 $ 25.10 $ 11,000 $ 10,000 GP Shares GP Share Price 186 $ 15.49 $ 9,000 $ 8,000 $ 7,000 Series B Conversion Shares GP Share Price 4 $ 15.49 Jun-2017 Sep-2017 Dec-2017 Mar-2018 Series B Conversion to GP Shares 8 7 Contributions to Equity Value 6 5 4 3 2 Jun-2017 Sep-2017 Dec-2017 Mar-2018 Source: CapIQ, Bloomberg market data as of 04-Apr-2018 Note: 1-Jun-2017 represents 21st day of public trading. Supplemental Materials 16 Number of Series B Shares if Converted Converted Shares 3.9 Midstream 61 % GP 38 Series B 1 millions of shares Combined Equity Value $ 7,636 Series B Equity Value $ 60 GP Market Cap (+) Midstream Market Cap (+) Illustrative Series B Value Combined Market Cap $ 7,636 GP Equity Value $2,884 $ in millions Midstream Equity Value $ 4,692

GRAPHIC


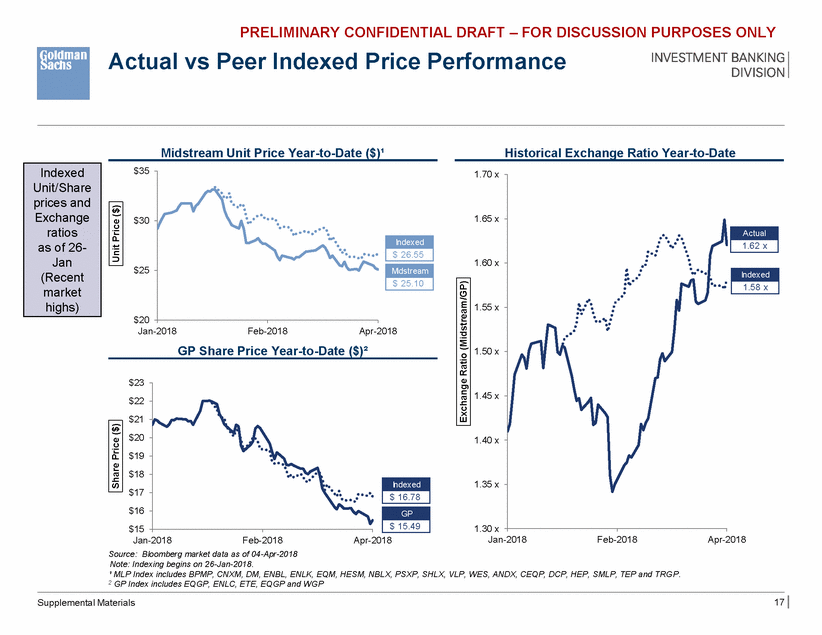
PRELIMINARY CONFIDENTIAL DRAFT – FOR DISCUSSION PURPOSES ONLY Actual vs Peer Indexed Price Performance Midstream Unit Price Year-to-Date ($)¹ Historical Exchange Ratio Year-to-Date $35 1.70 x 1.65 x $30 1.60 x $25 1.55 x $20 Jan-2018 Feb-2018 Apr-2018 GP Share Price Year-to-Date ($)² 1.50 x $23 $22 $21 $20 $19 $18 $17 $16 $15 1.45 x 1.40 x 1.35 x 1.30 x Jan-2018 Feb-2018 Apr-2018 Jan-2018 Feb-2018 Apr-2018 Source: Bloomberg market data as of 04-Apr-2018 Note: Indexing begins on 26-Jan-2018. ¹ MLP Index includes BPMP, CNXM, DM, ENBL, ENLK, EQM, HESM, NBLX, PSXP, SHLX, VLP, WES, ANDX, CEQP, DCP, HEP, SMLP, TEP and TRGP. 2 GP Index includes EQGP, ENLC, ETE, EQGP and WGP 17 Supplemental Materials Indexed $ 16.78 GP $ 15.49 Share Price ($) Exchange Ratio (Midstream/GP) Indexed 1.58 x Indexed $ 26.55 Midstream $ 25.10 Actual 1.62 x Unit Price ($) Indexed Unit/Share prices and Exchange ratios as of 26-Jan (Recent market highs)

GRAPHIC


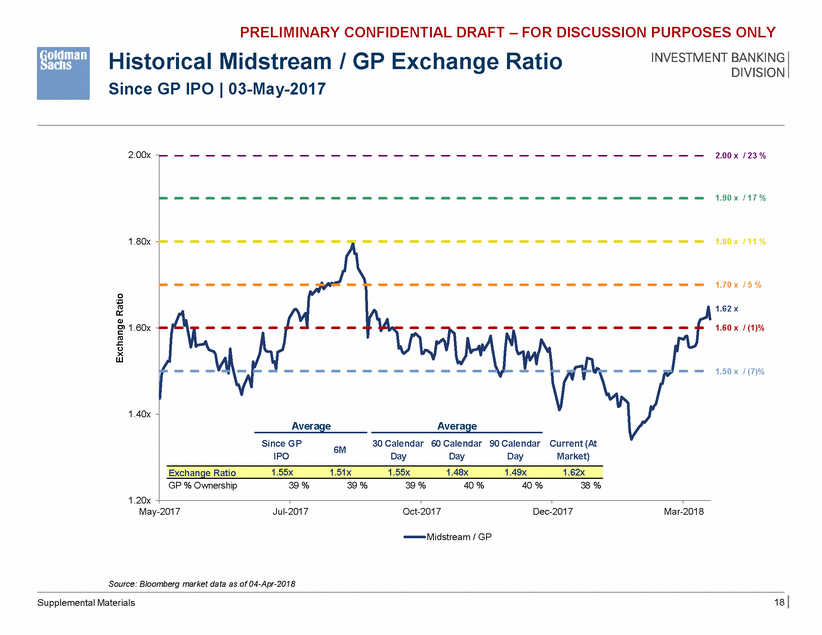
PRELIMINARY CONFIDENTIAL DRAFT – FOR DISCUSSION PURPOSES ONLY Historical Midstream / GP Exchange Ratio Since GP IPO | 03-May-2017 2.00x 2.00 x / 23 % 1.80x 30 60 901.90 x /C1u7r%rent ndar(At Since GP IPO ay Market) 1.80x 1.80 x / 11 % 1.70x 1.70 x / 5 % 1.62 x 1.60x 1.60x 1.60 x / (1)% 1.50 x / (7)% 1.49 x 1.50x 1.40x 1.40x 6M 1 1.30x .20x May-2017 Jul-2017 Oct-2017 Dec-2017 Mar-2018 May-2017 Jul-2017 Oct-2017 Dec-2017 Mar-2018 Midstream / GP Source: Bloomberg market data as of 04-Apr-2018 18 Supplemental Materials Exchange Ratio Exchange Ratio 47 x1.49 x Average 6MCalendar Calendar Cale DayDay D Exchange Ratio1.55 x1.52 x1.41 x1.45 x1. AverageAverage Since GP30 Calendar 60 Calendar 90 Calendar Current (At IPODayDayDayMarket) GP % Ownership39 %39 %39 %40 %40 %38 % Exchange Ratio1.55x1.51x1.55x1.48x1.49x1.62x

GRAPHIC


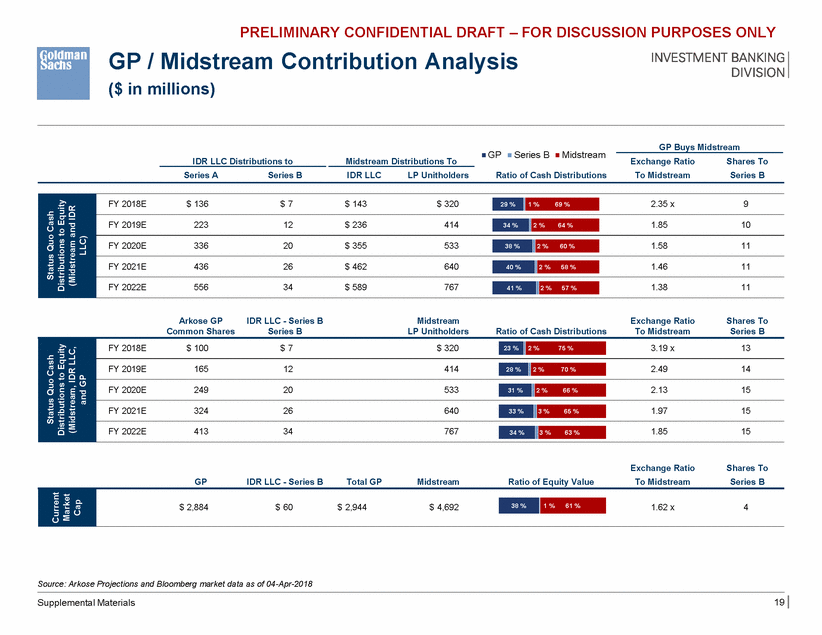
PRELIMINARY CONFIDENTIAL DRAFT – FOR DISCUSSION PURPOSES ONLY GP / Midstream Contribution Analysis ($ in millions) GP Buys Midstream GP Series BMidstream IDR LLC Distributions to Midstream Distributions To Exchange Ratio To Midstream Shares To Series B Series A Series B IDR LLC LP Unitholders Ratio of Cash Distributions Arkose GP Common Shares IDR LLC - Series B Series B Midstream LP Unitholders Exchange Ratio To Midstream Shares To Series B Ratio of Cash Distributions Exchange Ratio To Midstream Shares To Series B GP IDR LLC - Series B Total GP Midstream Ratio of Equity Value Source: Arkose Projections and Bloomberg market data as of 04-Apr-2018 19 Supplemental Materials Market Current Cap $ 2,884 $ 60 $ 2,944 $ 4,692 1.62 x 4 38 % 1 % 61 % Status Quo Cash Distributions to Equity (Midstream, IDR LLC, and GP FY 2018E $ 100 $ 7 $ 320 3.19 x 13 FY 2019E 165 12 414 2.49 14 FY 2020E 249 20 533 2.13 15 FY 2021E 324 26 640 1.97 15 FY 2022E 413 34 767 1.85 15 34 % 3 % 63 % 33 % 3 % 65 % 31 % 2 % 66 % 28 % 2 % 70 % 23 % 2 % 75 % Status Quo Cash Distributions to Equity (Midstream and IDR LLC) FY 2018E $ 136 $ 7 $ 143 $ 320 2.35 x 9 FY 2019E 223 12 $ 236 414 1.85 10 FY 2020E 336 20 $ 355 533 1.58 11 FY 2021E 436 26 $ 462 640 1.46 11 FY 2022E 556 34 $ 589 767 1.38 11 41 % 2 % 57 % 40 % 2 % 58 % 38 % 2 % 60 % 34 % 2 % 64 % 29 % 1 % 69 %

GRAPHIC


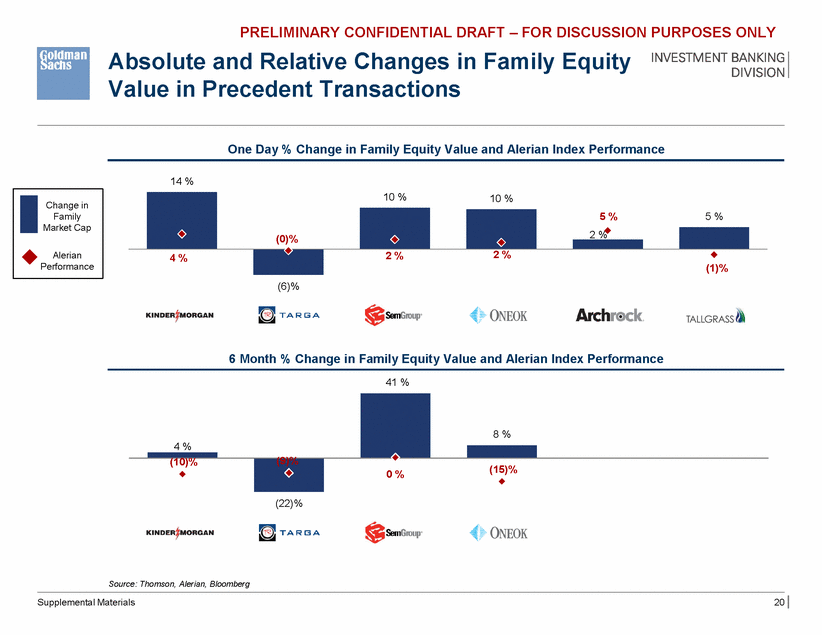
PRELIMINARY CONFIDENTIAL DRAFT – FOR DISCUSSION PURPOSES ONLY Absolute and Relative Changes in Family Equity Value in Precedent Transactions One Day % Change in Family Equity Value and Alerian Index Performance 14 % (1)% (6)% 6 Month % Change in Family Equity Value and Alerian Index Performance 41 % (22)% Source: Thomson, Alerian, Bloomberg Supplemental Materials 20 4 % 8 % (10)% (9)% 0 %(15)% 10 %10 % (0)% 5 %5 % 2 % 4 % 2 %2 % Change in Family Market Cap Alerian Performance

GRAPHIC


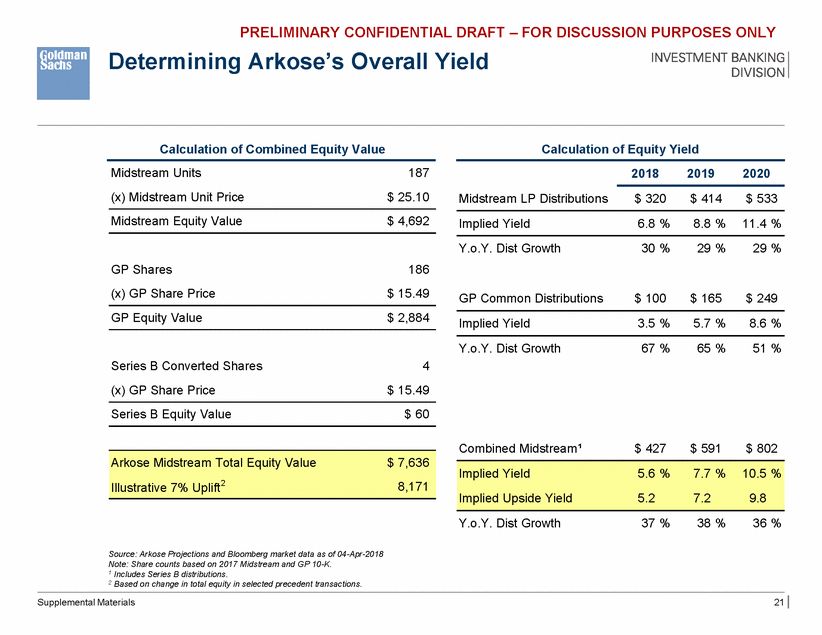
PRELIMINARY CONFIDENTIAL DRAFT – FOR DISCUSSION PURPOSES ONLY Determining Arkose’s Overall Yield Calculation of Combined Equity Value Calculation of Equity Yield Midstream Units (x) Midstream Unit Price 187 $ 25.10 2018 2019 2020 Midstream LP Distributions $ 320 $ 414 $ 533 Midstream Equity Value $ 4,692 Implied Yield 6.8 % 8.8 % 11.4 % Y.o.Y. Dist Growth 30 % 29 % 29 % GP Shares (x) GP Share Price 186 $ 15.49 GP Common Distributions $ 100 $ 165 $ 249 GP Equity Value $ 2,884 Implied Yield 3.5 % 5.7 % 8.6 % Y.o.Y. Dist Growth 67 % 65 % 51 % Series B Converted Shares (x) GP Share Price 4 $ 15.49 Series B Equity Value $ 60 Combined Midstream¹ $ 427 $ 591 $ 802 Y.o.Y. Dist Growth 37 % 38 % 36 % Source: Arkose Projections and Bloomberg market data as of 04-Apr-2018 Note: Share counts based on 2017 Midstream and GP 10-K. 1 Includes Series B distributions. 2 Based on change in total equity in selected precedent transactions. Supplemental Materials 21 Implied Yield5.6 %7.7 %10.5 % Implied Upside Yield5.27.29.8 Arkose Midstream Total Equity Value$ 7,636 Illustrative 7% Uplift28,171

GRAPHIC