Exhibit (c)(24)

HIGHLY CONFIDENTIAL PRELIMINARY DRAFT FOR DISCUSSION PURPOSES Project Francis Conflicts Committee GP LLC Discussion Materials of the Board of Directors of Arkose June 20, 2018 PRIVATE AND CONFIDENTIAL. This document is being sent to you for your information only as an investment banking client of Gol dman Sachs and should not be forwarded outside of your organization. This document has been prepared by the Investment Banking Division and is not a produ ct of Goldman Sachs Global Investment Research. This document should not be used as a basis for trading in the securities or loans of the companies name d herein or for any other investment decision. This document does not constitute an offer to sell the securities or loans of the companies named herein or a solic itation of proxies or votes and should not be construed as consisting of investment advice. Goldman Sachs does not provide accounting, tax, or legal advice.

GRAPHIC


HIGHLY CONFIDENTIAL PRELIMINARY DRAFT FOR DISCUSSION PURPOSES Disclaimer These materials have been prepared and are provided by Goldman Sachs on a confidential basis solely for the information and assistance of the Conflicts Committee of Board of Directors of Arkose GP LLC (the “Committee"), the general partner of Arkose GP LP (the "Company"), in connection with its consideration of the matters referred to herein. These materials and Goldman Sachs’ presentation relating to these materials (the “Confidential Information”) may not be disclosed to any third party or circulated or referred to publicly or used for or relied upon for any other purpose without the prior written consent of Goldman Sachs. The Confidential Information was not prepared with a view to public disclosure or to conform to any disclosure standards under any state, federal or international securities laws or other laws, rules or regulations, and Goldman Sachs does not take any responsibility for the use of the Confidential Information by persons other than those set forth above. Notwithstanding anything in this Confidential Information to the contrary, the Company may disclose to any person the US federal income and state income tax treatment and tax structure of any transaction described herein and all materials of any kind (including tax opinions and other tax analyses) that are provided to the Company relating to such tax treatment and tax structure, without Goldman Sachs imposing any limitation of any kind. The Confidential Information has been prepared by the Investment Banking Division of Goldman Sachs and is not a product of its research department. Goldman Sachs and its affiliates are engaged in advisory, underwriting and financing, principal investing, sales and trading, research, investment management and other financial and non-financial activities and services for various persons and entities. Goldman Sachs and its affiliates and employees, and funds or other entities they manage or in which they invest or have other economic interests or with which they co-invest, may at any time purchase, sell, hold or vote long or short positions and investments in securities, derivatives, loans, commodities, currencies, credit default swaps and other financial instruments of the Company, any other party to any transaction and any of their respective affiliates or any currency or commodity that may be involved in any transaction. Goldman Sachs’ investment banking division maintains regular, ordinary course client service dialogues with clients and potential clients to review events, opportunities, and conditions in particular sectors and industries and, in that connection, Goldman Sachs may make reference to the Company, but Goldman Sachs will not disclose any confidential information received from the Company. The Confidential Information has been prepared based on historical financial information, forecasts and other information obtained by Goldman Sachs from publicly available sources, the management of the Company or other sources (approved for our use by the Company in the case of information from management and non-public information). In preparing the Confidential Information, Goldman Sachs has relied upon and assumed, without assuming any responsibility for independent verification, the accuracy and completeness of all of the financial, legal, regulatory, tax, accounting and other information provided to, discussed with or reviewed by us, and Goldman Sachs does not assume any liability for any such information. Goldman Sachs does not provide accounting, tax, legal or regulatory advice. Goldman Sachs has not made an independent evaluation or appraisal of the assets and liabilities (including any contingent, derivative or other off-balance sheet assets and liabilities) of the Company or any other party to any transaction or any of their respective affiliates and has no obligation to evaluate the solvency of the Company or any other party to any transaction under any state or federal laws relating to bankruptcy, insolvency or similar matters. The analyses contained in the Confidential Information do not purport to be appraisals nor do they necessarily reflect the prices at which businesses or securities actually may be sold or purchased. Goldman Sachs’ role in any due diligence review is limited solely to performing such a review as it shall deem necessary to support its own advice and analysis and shall not be on behalf of the Company. Analyses based upon forecasts of future results are not necessarily indicative of actual future results, which may be significantly more or less favorable than suggested by these analyses, and Goldman Sachs does not assume responsibility if future results are materially different from those forecast. The Confidential Information does not address the underlying business decision of the Company to engage in any transaction, or the relative merits of any transaction or strategic alternative referred to herein as compared to any other transaction or alternative that may be available to the Company. The Confidential Information is necessarily based on economic, monetary, market and other conditions as in effect on, and the information made available to Goldman Sachs as of, the date of such Confidential Information and Goldman Sachs assumes no responsibility for updating or revising the Confidential Information based on circumstances, developments or events occurring after such date. The Confidential Information does not constitute any opinion, nor does the Confidential Information constitute a recommendation to the Committee, any security holder of the Company or any other person as to how to vote or act with respect to any transaction or any other matter. The Confidential Information, including this disclaimer, is subject to, and governed by, any written agreement between the Company and the Committee, on the one hand, and Goldman Sachs, on the other hand. 1

GRAPHIC


HIGHLY CONFIDENTIAL PRELIMINARY DRAFT FOR DISCUSSION PURPOSES Table of Contents I. Discussion Materials Appendix A: Additional Materials 2

GRAPHIC


I. Discussion Materials

GRAPHIC


HIGHLY CONFIDENTIAL PRELIMINARY DRAFT FOR DISCUSSION PURPOSES Summary Observations (Note: Assumes 1.6x Exchange Ratio to Midstream) Arkose Midstream today provides investors with explicit and long-term financial policy targets — Substantially all of the existing long-term targets could, with only minor tweaks, remain intact as part of a simplification However, “New Midstream” has a unique opportunity to reset its financial policy guidelines as part of a simplification — In particular, the high rate of distribution growth and the specificity of this growth guidance seem to be the most likely area to revisit as part of changes to financial policy — Potential to also incorporate share repurchases as tool to return capital to shareholders in a flexible and opportunistic manner It is worth noting that Midstream is different from other companies looking to restructure and reduce cash distribution policies: — 1) Midstream currently has very low leverage (2.0x – 2.5x Total Debt / EBITDA), and any reduction in distributions will further de-lever the balance sheet 2) Capex spending crests in 2019/2020 and declines rapidly thereafter, resulting in any long-term slowing of distribution growth to have the greatest impact when free-cash flow accelerates 3) There is no primary equity overhang. To the extent that external financing is required, it is in the credit markets using a balance sheet with low leverage — — A key decision as part of a financial policy revision will be the number of years to maintain existing distribution growth guidance: — If maintained through 2022E (4-years): Would need to reduce coverage ratio guidance for 2020E to be “gradually falling towards 1.15x by 2020E, and remaining above 1.1x thereafter” If distribution targets maintained through 2020E (2-years): Could modify long-term growth guidance to “target 15% - 20% distribution growth”, with “pace determined by capex opportunities, balance sheet, and coverage ratio” If distribution targets softened after 2019E: “Target 15% - 20% distribution growth beyond 2019E” with similar pacing criteria as noted above, but also “targeting high-end of the range for the early years of the target period” — — Additionally, under all scenarios, Midstream appears to have balance sheet capacity to opportunistically repurchase shares, which can also be incorporated into the new financial policy framework Irrespective of Dividend Growth Policy Guidance, Investor Messaging Should Continue to Highlight Antero’s Unparalleled Growth in Cash Flow 4 Discussion Materials

GRAPHIC


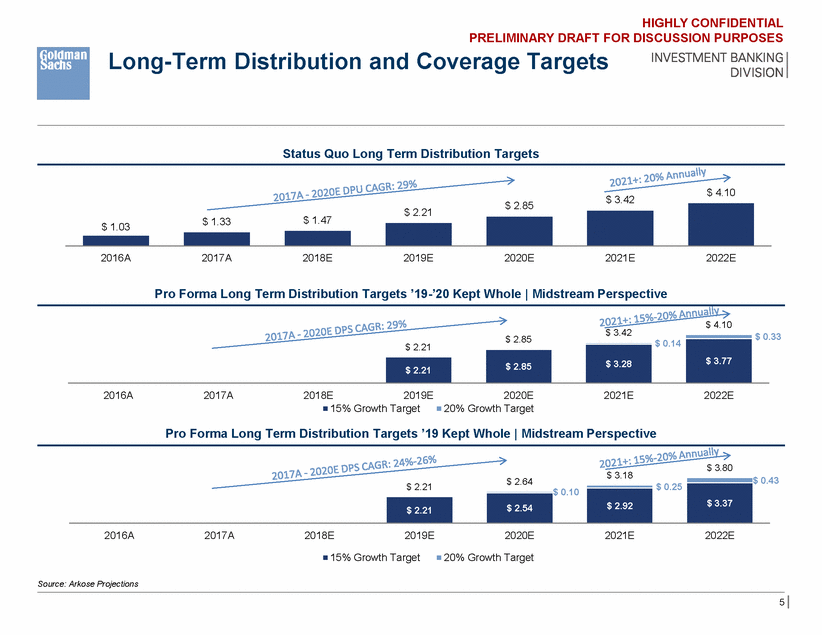
HIGHLY CONFIDENTIAL PRELIMINARY DRAFT FOR DISCUSSION PURPOSES Long-Term Distribution and Coverage Targets Status Quo Long Term Distribution Targets $ 4.10 $ 3.42 $ 2.85 $ 2.21 $ 1.47 $ 1.33 $ 1.03 2016A 2017A 2018E 2019E 2020E 2021E 2022E Pro Forma Long Term Distribution Targets ’19-’20 Kept Whole | Midstream Perspective $ 4.10 $ 3.42 $ 0.33 $ 2.85 $ 0.14 $ 2.21 2016A 2017A 2018E 2019E 2020E 20% Growth Target 2021E 2022E 15% Growth Target Pro Forma Long Term Distribution Targets ’19 Kept Whole | Midstream Perspective $ 3.80 $ 3.18 43 $ 2.64 $ 2.21 $ 0.10 2016A 2017A 2018E 2019E 2020E 2021E 2022E 15% Growth Target 20% Growth Target Source: Arkose Projections 5 $ 0. $ 3.37 $ 2.92 $ 0.25 $ 2.54 $ 2.21 $ 3.77 $ 3.28 $ 2.85 $ 2.21

GRAPHIC


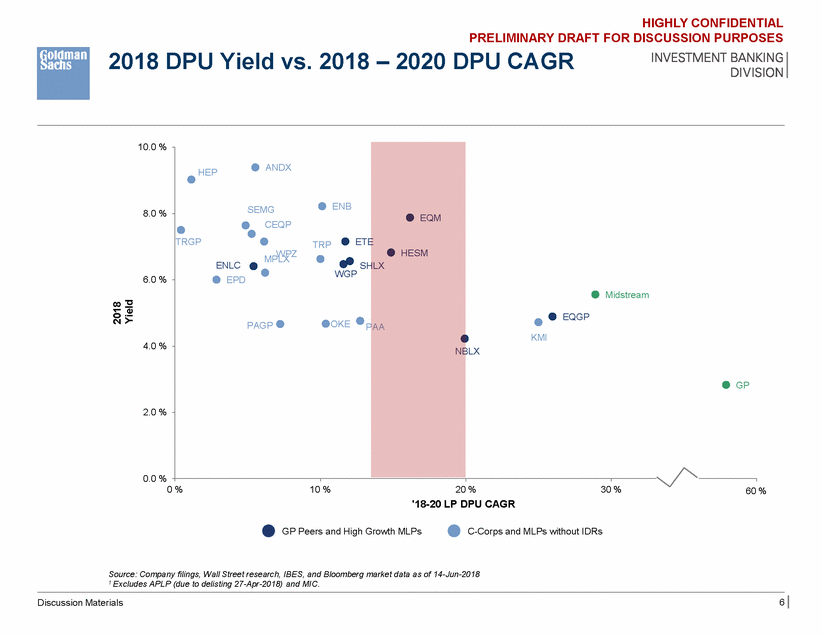
HIGHLY CONFIDENTIAL PRELIMINARY DRAFT FOR DISCUSSION PURPOSES 2018 DPU Yield vs. 2018 – 2020 DPU CAGR 10.0 % 8.0 % E M WPZ SHLX 6.0 % AA 4.0 % NBLX 2.0 % 0.0 % 0 % 10 % 20 % '18-20 LP DPU CAGR 30 % 640 % GP Peers and High Growth MLPs C-Corps and MLPs without IDRs Source: Company filings, Wall Street research, IBES, and Bloomberg market data as of 14-Jun-2018 1 Excludes APLP (due to delisting 27-Apr-2018) and MIC. 6 Discussion Materials 2018 Yield EQM HESM Midstream EQGP KMI GP HEPANDX SEMGENB CEQP TRGPTRPET PLX ENLC EPDWGP PAGPOKEP

GRAPHIC


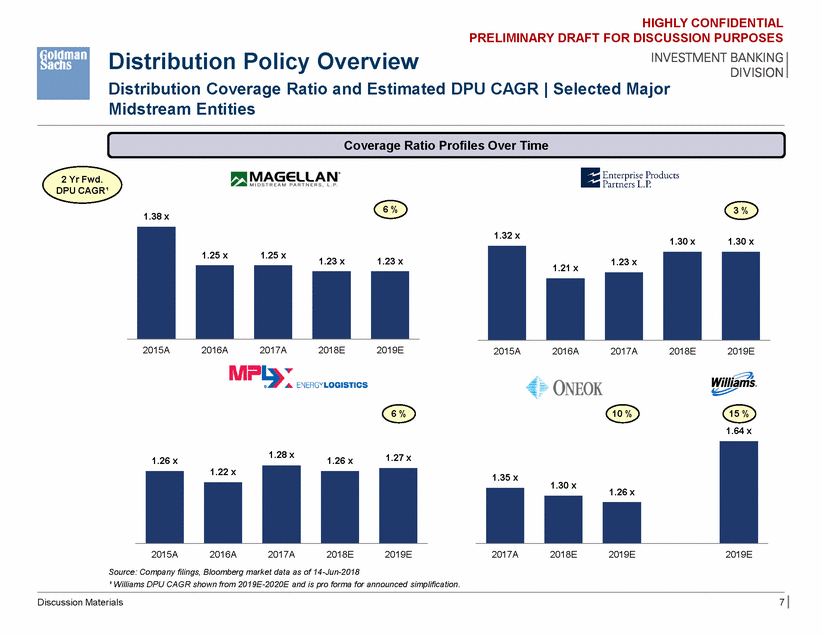
HIGHLY CONFIDENTIAL PRELIMINARY DRAFT FOR DISCUSSION PURPOSES Distribution Policy Overview Distribution Coverage Ratio and Estimated DPU CAGR | Selected Major Midstream Entities Coverage Ratio Profiles Over Time 2 Yr Fwd. DPU CAGR¹ 6 % 3 % 1.38 x 1.32 x 1.30 x 1.30 x 2015A 2016A 2017A 2018E 2019E 2015A 2016A 2017A 2018E 2019E 6 % 10 % 15 % 1.64 x 1.28 x 1.27 x 1.26 x 1.26 x 1.30 x 2015A 2016A 2017A 2018E 2019E 2017A 2018E 2019E 2019E Source: Company filings, Bloomberg market data as of 14-Jun-2018 ¹ Williams DPU CAGR shown from 2019E-2020E and is pro forma for announced simplification. Discussion Materials 7 1.22 x 1.35 x 1.26 x 1.21 x1.23 x 1.25 x1.25 x1.23 x1.23 x

GRAPHIC


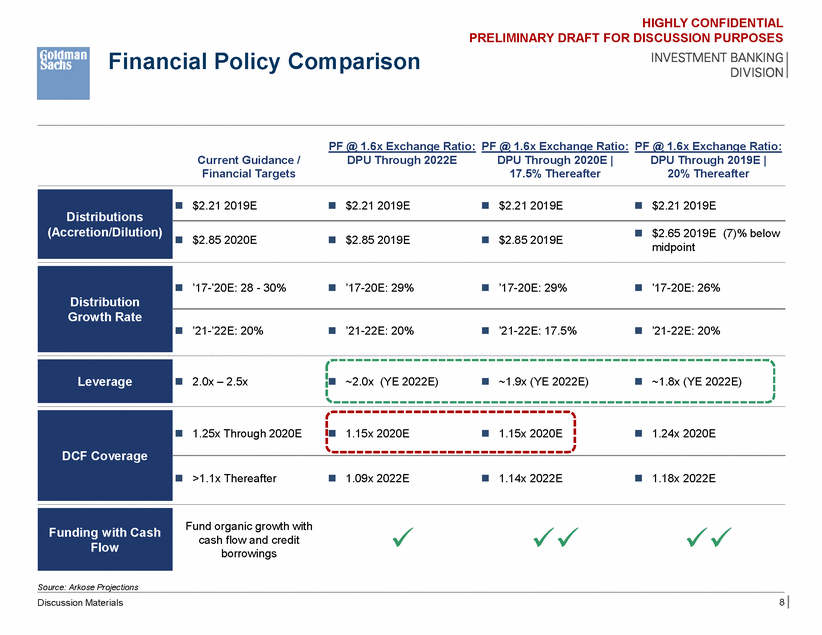
HIGHLY CONFIDENTIAL PRELIMINARY DRAFT FOR DISCUSSION PURPOSES Financial Policy Comparison PF @ 1.6x Exchange Ratio: PF @ 1.6x Exchange Ratio: PF @ 1.6x Exchange Ratio: Current Guidance / Financial Targets DPU Through 2022E DPU Through 2020E | 17.5% Thereafter DPU Through 2019E | 20% Thereafter $2.85 2020E $2.85 2019E $2.85 2019E midpoint 2.0x – 2.5x ~2.0x (YE 2022E) ~1.9x (YE 2022E) ~1.8x (YE 2022E) Fund organic growth with cash flow and credit borrowings  Source: Arkose Projections 8 Discussion Materials Funding with Cash Flow DCF Coverage 1.25x Through 2020E 1.15x 2020E 1.15x 2020E 1.24x 2020E >1.1x Thereafter 1.09x 2022E 1.14x 2022E 1.18x 2022E Leverage Distribution Growth Rate ’17-’20E: 28 - 30% ’17-20E: 29% ’17-20E: 29% ’17-20E: 26% ’21-’22E: 20% ’21-22E: 20% ’21-22E: 17.5% ’21-22E: 20% Distributions (Accretion/Dilution) $2.21 2019E $2.21 2019E $2.21 2019E $2.21 2019E $2.65 2019E (7)% below

GRAPHIC


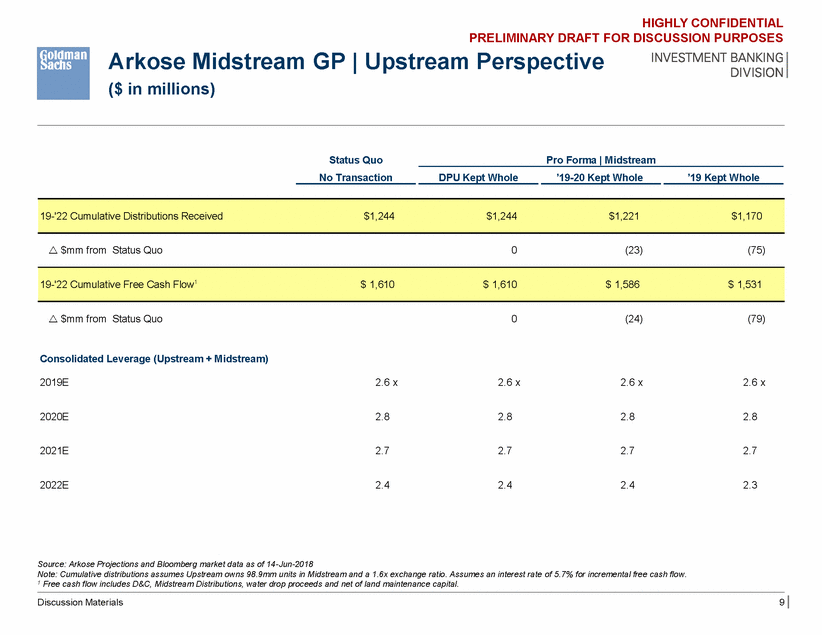
HIGHLY CONFIDENTIAL PRELIMINARY DRAFT FOR DISCUSSION PURPOSES Arkose Midstream ($ in millions) GP | Upstream Perspective Status Quo No Transaction Pro Forma | Midstream DPU Kept Whole ’19-20 Kept Whole ’19 Kept Whole r $mm from Status Quo 0 (23) (75) r $mm from Status Quo 0 (24) (79) Consolidated Leverage (Upstream + Midstream) 2019E 2.6 x 2.6 x 2.6 x 2.6 x 2020E 2.8 2.8 2.8 2.8 2021E 2.7 2.7 2.7 2.7 2022E 2.4 2.4 2.4 2.3 Source: Arkose Projections and Bloomberg market data as of 14-Jun-2018 Note: Cumulative distributions assumes Upstream owns 98.9mm units in Midstream and a 1.6x exchange ratio. Assumes an interest rate of 5.7% for incremental free cash flow. 1 Free cash flow includes D&C, Midstream Distributions, water drop proceeds and net of land maintenance capital. Discussion Materials 9 19-'22 Cumulative Free Cash Flow1 $ 1,610 $ 1,610 $ 1,586 $ 1,531 19-'22 Cumulative Distributions Received $1,244 $1,244 $1,221 $1,170

GRAPHIC


HIGHLY CONFIDENTIAL PRELIMINARY DRAFT FOR DISCUSSION PURPOSES Appendix A: Additional Materials

GRAPHIC


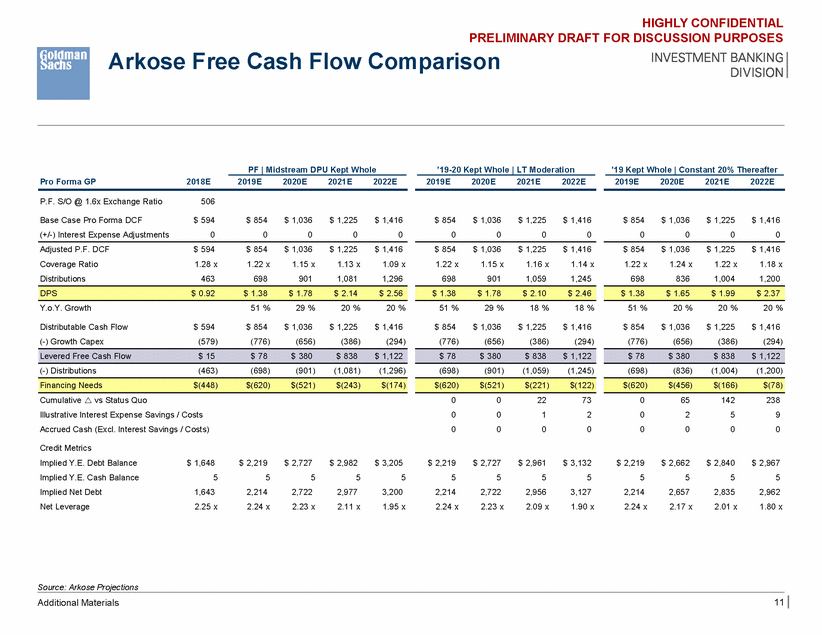
HIGHLY CONFIDENTIAL PRELIMINARY DRAFT FOR DISCUSSION PURPOSES Arkose Free Cash Flow Comparison PF | Midstream DPU Kept Whole ’19-20 Kept Whole | LT Moderation ’19 Kept Whole | Constant 20% Thereafter Pro Forma GP 2018E 2019E 2020E 2021E 2022E 2019E 2020E 2021E 2022E 2019E 2020E 2021E 2022E P.F. S/O @ 1.6x Exchange Ratio 506 Base Case Pro Forma DCF (+/-) Interest Expense Adjustments $ 594 0 $ 854 0 $ 1,036 0 $ 1,225 0 $ 1,416 0 $ 854 0 $ 1,036 0 $ 1,225 0 $ 1,416 0 $ 854 0 $ 1,036 0 $ 1,225 0 $ 1,416 0 Adjusted P.F. DCF Coverage Ratio Distributions $ 594 1.28 x 463 $ 854 1.22 x 698 $ 1,036 1.15 x 901 $ 1,225 1.13 x 1,081 $ 1,416 1.09 x 1,296 $ 854 1.22 x 698 $ 1,036 1.15 x 901 $ 1,225 1.16 x 1,059 $ 1,416 1.14 x 1,245 $ 854 1.22 x 698 $ 1,036 1.24 x 836 $ 1,225 1.22 x 1,004 $ 1,416 1.18 x 1,200 Y.o.Y. Growth 51 % 29 % 20 % 20 % 51 % 29 % 18 % 18 % 51 % 20 % 20 % 20 % Distributable Cash Flow (-) Growth Capex $ 594 (579) $ 854 (776) $ 1,036 (656) $ 1,225 (386) $ 1,416 (294) $ 854 (776) $ 1,036 (656) $ 1,225 (386) $ 1,416 (294) $ 854 (776) $ 1,036 (656) $ 1,225 (386) $ 1,416 (294) (-) Distributions (463) (698) (901) (1,081) (1,296) (698) (901) (1,059) (1,245) (698) (836) (1,004) (1,200) Cumulative r vs Status Quo Illustrative Interest Expense Savings / Costs Accrued Cash (Excl. Interest Savings / Costs) 0 0 0 0 0 0 22 1 0 73 2 0 0 0 0 65 2 0 142 5 0 238 9 0 Credit Metrics Implied Y.E. Debt Balance Implied Y.E. Cash Balance Implied Net Debt Net Leverage $ 1,648 5 1,643 2.25 x $ 2,219 5 2,214 2.24 x $ 2,727 5 2,722 2.23 x $ 2,982 5 2,977 2.11 x $ 3,205 5 3,200 1.95 x $ 2,219 5 2,214 2.24 x $ 2,727 5 2,722 2.23 x $ 2,961 5 2,956 2.09 x $ 3,132 5 3,127 1.90 x $ 2,219 5 2,214 2.24 x $ 2,662 5 2,657 2.17 x $ 2,840 5 2,835 2.01 x $ 2,967 5 2,962 1.80 x Source: Arkose Projections 11 Additional Materials $(620)$(456)$(166)$(78) $(620)$(521)$(221)$(122) Financing Needs$(448)$(620)$(521)$(243)$(174) $ 78$ 380$ 838$ 1,122 $ 78$ 380$ 838$ 1,122 Levered Free Cash Flow$ 15$ 78$ 380$ 838$ 1,122 $ 1.38$ 1.65$ 1.99$ 2.37 $ 1.38$ 1.78$ 2.10$ 2.46 DPS$ 0.92$ 1.38$ 1.78$ 2.14$ 2.56
GRAPHIC


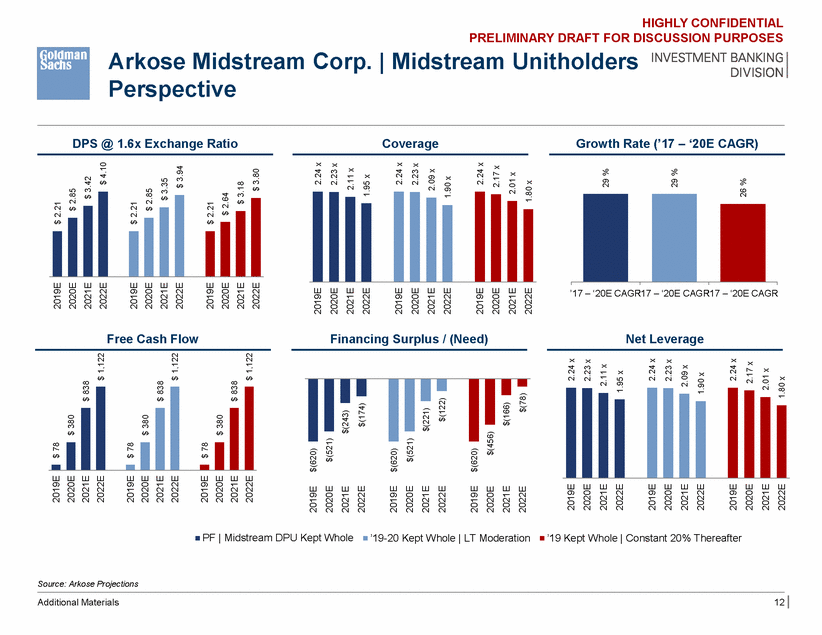
HIGHLY CONFIDENTIAL PRELIMINARY DRAFT FOR DISCUSSION PURPOSES Arkose Midstream Perspective Corp. | Midstream Unitholders DPS @ 1.6x Exchange Ratio Coverage Growth Rate (’17 – ‘20E CAGR) ’17 – ‘20E CAGR’17 – ‘20E CAGR’17 – ‘20E CAGR Free Cash Flow Financing Surplus / (Need) Net Leverage PF | Midstream DPU Kept Whole ’19-20 Kept Whole | LT Moderation ’19 Kept Whole | Constant 20% Thereafter Source: Arkose Projections Additional Materials 12 2019E 2020E 2021E 2022E $ 78 2019E 2020E 2021E 2022E $ 2.21 $ 2.85 $ 3.42 $ 4.10 $ 380 $ 838 $ 1,122 2019E 2020E 2021E 2022E $ 78 2019E 2020E 2021E 2022E $ 2.21 $ 2.85 $ 3.35 $ 3.94 $ 380 $ 838 $ 1,122 2019E 2020E 2021E 2022E $ 78 2019E 2020E 2021E 2022E $ 2.21 $ 2.64 $ 3.18 $ 3.80 $ 380 $ 838 $ 1,122 2019E 2020E 2021E 2022E $(620) $(521) 2019E 2020E 2021E 2022E 2.24 x 2.23 x 2.11 x 1.95 x $(243) $(174) 2019E 2020E 2021E 2022E $(620) $(521) 2019E 2020E 2021E 2022E 2.24 x 2.23 x 2.09 x 1.90 x $(221) $(122) 2019E 2020E 2021E 2022E $(620) $(456) 2019E 2020E 2021E 2022E 2.24 x 2.17 x 2.01 x 1.80 x $(166) $(78) 2019E 2020E 2021E 2022E 2.24 x 2.23 x 2.11 x 1.95 x 29 % 2019E 2020E 2021E 2022E 2.24 x 2.23 x 2.09 x 1.90 x 29 % 2019E 2020E 2021E 2022E 2.24 x 2.17 x 2.01 x 1.80 x 26 %

GRAPHIC