Exhibit (c)(28)

PRELIMINARY CONFIDENTIAL DRAFT – FOR DISCUSSION PURPOSES ONLY Project Francis Conflicts Committee GP LLC Discussion Materials of the Board of Directors of Arkose August 11rd, 2018 PRIVATE AND CONFIDENTIAL. This document is being sent to you for your information only as an investment banking client of Gol dman Sachs and should not be forwarded outside of your organization. This document has been prepared by the Investment Banking Division and is not a produ ct of Goldman Sachs Global Investment Research. This document should not be used as a basis for trading in the securities or loans of the companies name d herein or for any other investment decision. This document does not constitute an offer to sell the securities or loans of the companies named herein or a solic itation of proxies or votes and should not be construed as consisting of investment advice. Goldman Sachs does not provide accounting, tax, or legal advice.

GRAPHIC


PRELIMINARY CONFIDENTIAL DRAFT – FOR DISCUSSION PURPOSES ONLY Disclaimer These materials have been prepared and are provided by Goldman Sachs on a confidential basis solely for the information and assistance of the Conflicts Committee of Board of Directors of Arkose GP LLC (the “Committee"), the general partner of Arkose GP LP (the "Company"), in connection with its consideration of the matters referred to herein. These materials and Goldman Sachs’ presentation relating to these materials (the “Confidential Information”) may not be disclosed to any third party or circulated or referred to publicly or used for or relied upon for any other purpose without the prior written consent of Goldman Sachs. The Confidential Information was not prepared with a view to public disclosure or to conform to any disclosure standards under any state, federal or international securities laws or other laws, rules or regulations, and Goldman Sachs does not take any responsibility for the use of the Confidential Information by persons other than those set forth above. Notwithstanding anything in this Confidential Information to the contrary, the Company may disclose to any person the US federal income and state income tax treatment and tax structure of any transaction described herein and all materials of any kind (including tax opinions and other tax analyses) that are provided to the Company relating to such tax treatment and tax structure, without Goldman Sachs imposing any limitation of any kind. The Confidential Information has been prepared by the Investment Banking Division of Goldman Sachs and is not a product of its research department. Goldman Sachs and its affiliates are engaged in advisory, underwriting and financing, principal investing, sales and trading, research, investment management and other financial and non-financial activities and services for various persons and entities. Goldman Sachs and its affiliates and employees, and funds or other entities they manage or in which they invest or have other economic interests or with which they co-invest, may at any time purchase, sell, hold or vote long or short positions and investments in securities, derivatives, loans, commodities, currencies, credit default swaps and other financial instruments of the Company, any other party to any transaction and any of their respective affiliates or any currency or commodity that may be involved in any transaction. Goldman Sachs’ investment banking division maintains regular, ordinary course client service dialogues with clients and potential clients to review events, opportunities, and conditions in particular sectors and industries and, in that connection, Goldman Sachs may make reference to the Company, but Goldman Sachs will not disclose any confidential information received from the Company. The Confidential Information has been prepared based on historical financial information, forecasts and other information obtained by Goldman Sachs from publicly available sources, the management of the Company or other sources (approved for our use by the Company in the case of information from management and non-public information). In preparing the Confidential Information, Goldman Sachs has relied upon and assumed, without assuming any responsibility for independent verification, the accuracy and completeness of all of the financial, legal, regulatory, tax, accounting and other information provided to, discussed with or reviewed by us, and Goldman Sachs does not assume any liability for any such information. Goldman Sachs does not provide accounting, tax, legal or regulatory advice. Goldman Sachs has not made an independent evaluation or appraisal of the assets and liabilities (including any contingent, derivative or other off-balance sheet assets and liabilities) of the Company or any other party to any transaction or any of their respective affiliates and has no obligation to evaluate the solvency of the Company or any other party to any transaction under any state or federal laws relating to bankruptcy, insolvency or similar matters. The analyses contained in the Confidential Information do not purport to be appraisals nor do they necessarily reflect the prices at which businesses or securities actually may be sold or purchased. Goldman Sachs’ role in any due diligence review is limited solely to performing such a review as it shall deem necessary to support its own advice and analysis and shall not be on behalf of the Company. Analyses based upon forecasts of future results are not necessarily indicative of actual future results, which may be significantly more or less favorable than suggested by these analyses, and Goldman Sachs does not assume responsibility if future results are materially different from those forecast. The Confidential Information does not address the underlying business decision of the Company to engage in any transaction, or the relative merits of any transaction or strategic alternative referred to herein as compared to any other transaction or alternative that may be available to the Company. The Confidential Information is necessarily based on economic, monetary, market and other conditions as in effect on, and the information made available to Goldman Sachs as of, the date of such Confidential Information and Goldman Sachs assumes no responsibility for updating or revising the Confidential Information based on circumstances, developments or events occurring after such date. The Confidential Information does not constitute any opinion, nor does the Confidential Information constitute a recommendation to the Committee, any security holder of the Company or any other person as to how to vote or act with respect to any transaction or any other matter. The Confidential Information, including this disclaimer, is subject to, and governed by, any written agreement between the Company and the Committee, on the one hand, and Goldman Sachs, on the other hand. 2
GRAPHIC


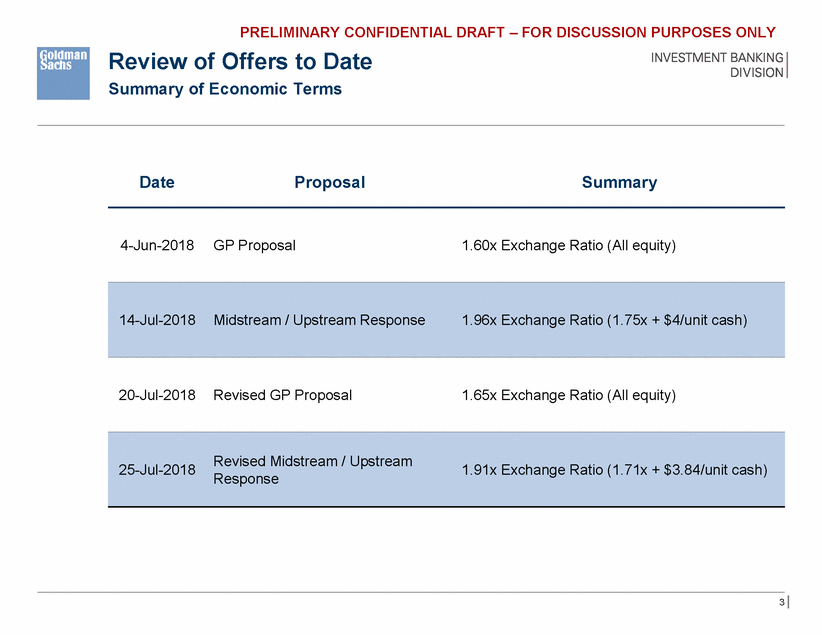
PRELIMINARY CONFIDENTIAL DRAFT – FOR DISCUSSION PURPOSES ONLY Review of Offers to Date Summary of Economic Terms Date Proposal Summary 4-Jun-2018 GP Proposal 1.60x Exchange Ratio (All equity) 20-Jul-2018 Revised GP Proposal 1.65x Exchange Ratio (All equity) 1.91x Exchange Ratio (1.71x + $3.84/unit cash) Response 3 25-Jul-2018Revised Midstream / Upstream 14-Jul-2018Midstream / Upstream Response1.96x Exchange Ratio (1.75x + $4/unit cash)

GRAPHIC


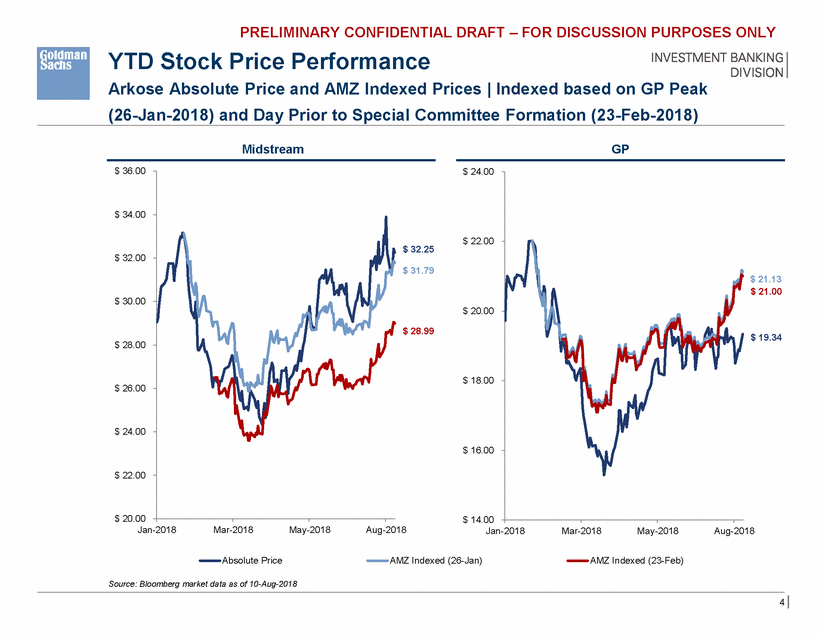
PRELIMINARY CONFIDENTIAL DRAFT – FOR DISCUSSION PURPOSES ONLY YTD Stock Price Performance Arkose Absolute Price and AMZ Indexed Prices | Indexed based on GP Peak (26-Jan-2018) and Day Prior to Special Committee Formation (23-Feb-2018) Midstream GP $ 36.00 $ 24.00 $ 34.00 $ 22.00 $ 32.25 $ 32.00 $ 31.79 $ 21.13 $ 21.00 $ 30.00 $ 20.00 $ 28.99 $ 19.34 $ 28.00 $ 18.00 $ 26.00 $ 24.00 $ 16.00 $ 22.00 $ 20.00 $ 14.00 Jan-2018 Mar-2018 May-2018 Aug-2018 Jan-2018 Mar-2018 May-2018 Aug-2018 Absolute Price AMZ Indexed (26-Jan) AMZ Indexed (23-Feb) Source: Bloomberg market data as of 10-Aug-2018 4

GRAPHIC


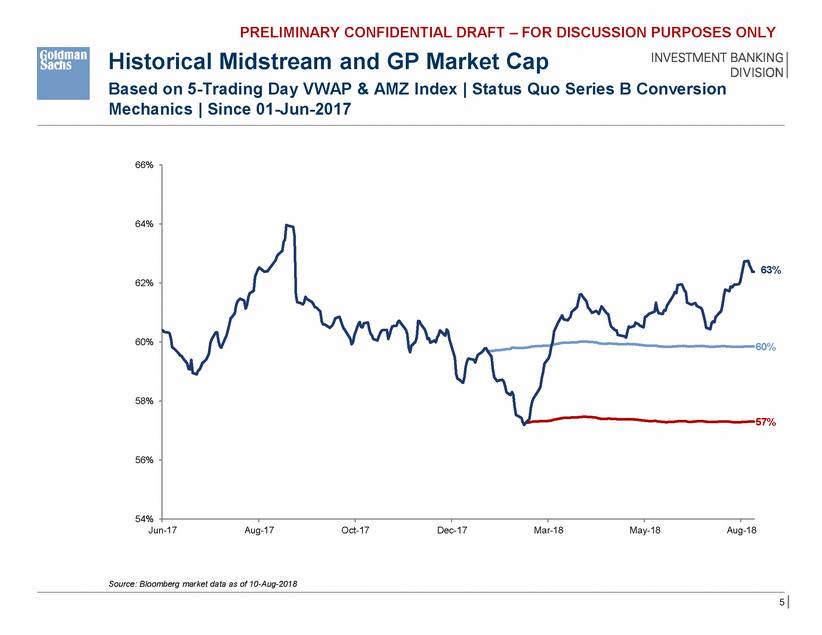
PRELIMINARY CONFIDENTIAL DRAFT – FOR DISCUSSION PURPOSES ONLY Historical Midstream and GP Market Cap Based on 5-Trading Day VWAP & AMZ Mechanics | Since 01-Jun-2017 Index | Status Quo Series B Conversion 66% 64% 63% 62% 60% 60% 58% 57% 56% 54% Jun-17 Aug-17 Oct-17 Dec-17 Mar-18 May-18 Aug-18 Source: Bloomberg market data as of 10-Aug-2018 5

GRAPHIC


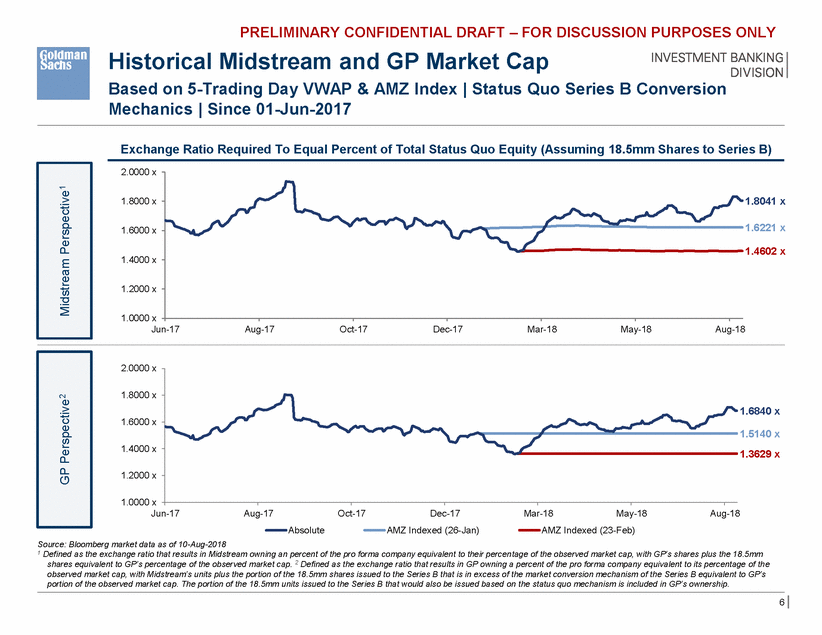
PRELIMINARY CONFIDENTIAL DRAFT – FOR DISCUSSION PURPOSES ONLY Historical Midstream and GP Market Cap Based on 5-Trading Day VWAP & AMZ Index | Status Quo Series B Conversion Mechanics | Since 01-Jun-2017 Exchange Ratio Required To Equal Percent of Total Status Quo Equity (Assuming 18.5mm Shares to Series B) 2.0000 x 1.8041 x 1.8000 x 1.6221 x 1.6000 x 1.4602 x 1.4000 x 1.2000 x 1.0000 x Jun-17 Aug-17 Oct-17 Dec-17 Mar-18 May-18 Aug-18 2.0000 x 1.8000 x 1.6840 x 1.6000 x 1.5140 x 1.3629 x 1.4000 x 1.2000 x 1.0000 x Jun-17 Aug-17 Oct-17 Dec-17 AMZ Indexed (26-Jan) Mar-18 May-18 Aug-18 Absolute AMZ Indexed (23-Feb) Source: Bloomberg market data as of 10-Aug-2018 1 Defined as the exchange ratio that results in Midstream owning an percent of the pro forma company equivalent to their percentage of the observed market cap, with GP’s shares plus the 18.5mm shares equivalent to GP’s percentage of the observed market cap. 2 Defined as the exchange ratio that results in GP owning a percent of the pro forma company equivalent to its percentage of the observed market cap, with Midstream’s units plus the portion of the 18.5mm shares issued to the Series B that is in excess of the market conversion mechanism of the Series B equivalent to GP’s portion of the observed market cap. The portion of the 18.5mm units issued to the Series B that would also be issued based on the status quo mechanism is included in GP’s ownership. 6 GP Perspective2 Midstream Perspective1

GRAPHIC


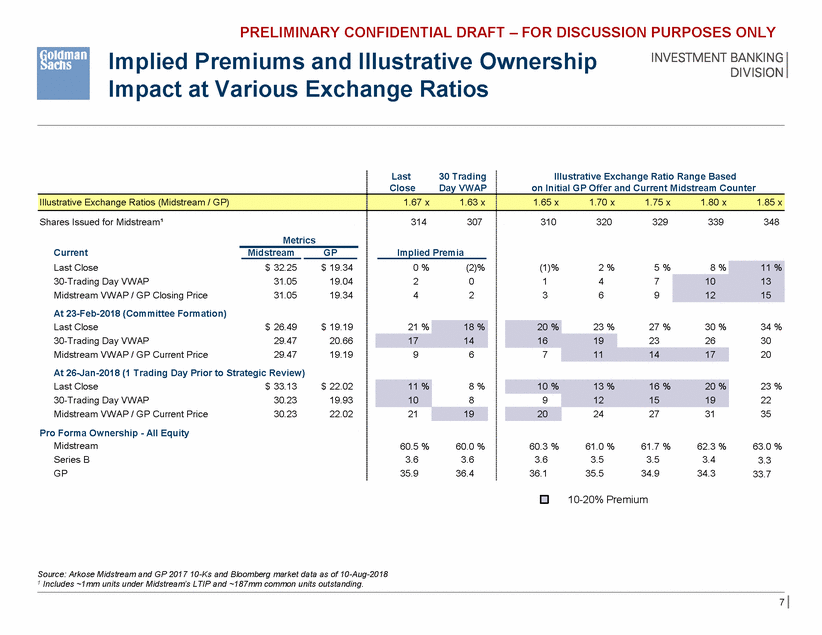
PRELIMINARY CONFIDENTIAL DRAFT – FOR DISCUSSION PURPOSES ONLY Implied Premiums and Illustrative Ownership Impact at Various Exchange Ratios Last Close 30 Trading Day VWAP Illustrative Exchange Ratio Range Based on Initial GP Offer and Current Midstream Counter Shares Issued for Midstream¹ 314 307 310 320 329 339 348 Metrics Current Last Close 30-Trading Day VWAP Midstream VWAP / GP Closing Price At 23-Feb-2018 (Committee Formation) Last Close 30-Trading Day VWAP Midstream VWAP / GP Current Price Midstream GP Implied Premia $ 32.25 31.05 31.05 $ 19.34 19.04 19.34 0 % 2 4 (2)% 0 2 (1)% 1 3 2 % 4 6 5 % 7 9 $ 26.49 29.47 29.47 $ 19.19 20.66 19.19 23 % 27 % 23 30 % 26 34 % 30 20 9 6 7 11 14 17 At 26-Jan-2018 (1 Trading Day Prior to Strategic Review) Last Close 30-Trading Day VWAP Midstream VWAP / GP Current Price Pro Forma Ownership - All Equity Midstream Series B GP $ 33.13 30.23 30.23 $ 22.02 19.93 22.02 8 % 8 23 % 22 35 9 12 15 19 21 19 60.5 % 3.6 35.9 60.0 % 3.6 36.4 60.3 % 3.6 36.1 61.0 % 3.5 35.5 61.7 % 3.5 34.9 62.3 % 3.4 34.3 63.0 % 3.3 33.7 10-20% Premium Source: Arkose Midstream and GP 2017 10-Ks and Bloomberg market data as of 10-Aug-2018 1 Includes ~1mm units under Midstream’s LTIP and ~187mm common units outstanding. 7 10 %13 %16 %20 % 20 242731 11 % 10 20 % 1619 21 % 18 % 1714 8 % 11 % 1013 1215 Illustrative Exchange Ratios (Midstream / GP)1.67 x1.63 x1.65 x1.70 x1.75 x1.80 x1.85 x

GRAPHIC


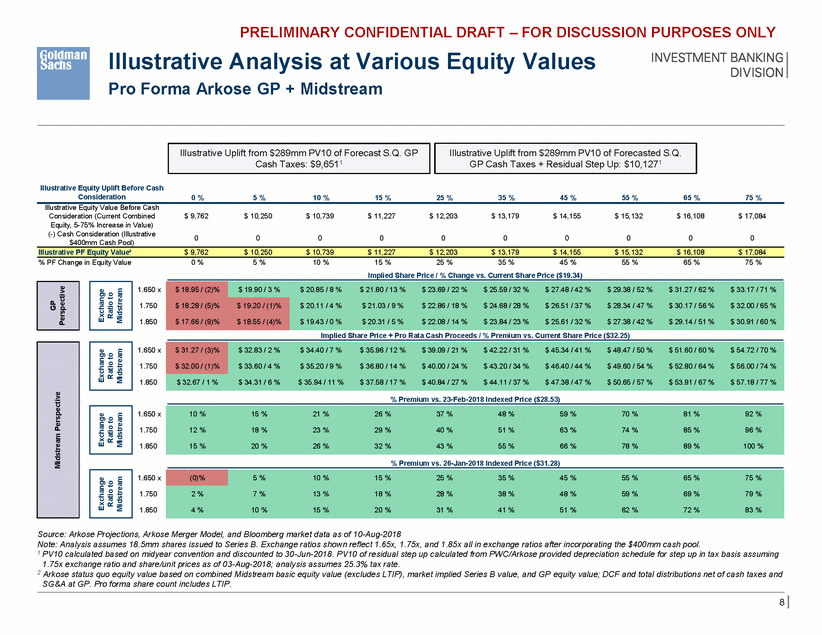
PRELIMINARY CONFIDENTIAL DRAFT – FOR DISCUSSION PURPOSES ONLY Illustrative Analysis at Various Equity Values Pro Forma Arkose GP + Midstream Illustrative Equity Uplift Before Cash Consideration 0 % 5 % 10 % 15 % 25 % 35 % 45 % 55 % 65 % 75 % Illustrative Equity Value Before Cash Consideration (Current Combined Equity, 5-75% Increase in Value) (-) Cash Consideration (Illustrative $400mm Cash Pool) $ 9,762 $ 10,250 $ 10,739 $ 11,227 $ 12,203 $ 13,179 $ 14,155 $ 15,132 $ 16,108 $ 17,084 0 0 0 0 0 0 0 0 0 0 % PF Change in Equity Value 0 % 5 % 10 % 15 % 25 % 35 % 45 % 55 % 65 % 75 % Implied Share Price / % Change vs. Current Share Price ($19.34) 1.650 x 1.750 1.850 Implied Share Price + Pro Rata Cash Proceeds / % Premium vs. Current Share Price ($32.25) 1.650 x 1.750 1.850 % Premium vs. 23-Feb-2018 Indexed Price ($28.53) 1.650 x 1.750 1.850 % Premium vs. 26-Jan-2018 Indexed Price ($31.28) 1.650 x 1.750 1.850 Source: Arkose Projections, Arkose Merger Model, and Bloomberg market data as of 10-Aug-2018 Note: Analysis assumes 18.5mm shares issued to Series B. Exchange ratios shown reflect 1.65x, 1.75x, and 1.85x all in exchange ratios after incorporating the $400mm cash pool. 1 PV10 calculated based on midyear convention and discounted to 30-Jun-2018. PV10 of residual step up calculated from PWC/Arkose provided depreciation schedule for step up in tax basis assuming 1.75x exchange ratio and share/unit prices as of 03-Aug-2018; analysis assumes 25.3% tax rate. 2 Arkose status quo equity value based on combined Midstream basic equity value (excludes LTIP), market implied Series B value, and GP equity value; DCF and total distributions net of cash taxes and SG&A at GP. Pro forma share count includes LTIP. 8 (0)% 5 % 10 % 15 % 25 % 35 % 45 % 55 % 65 % 75 % 2 % 7 % 13 % 18 % 28 % 38 % 48 % 59 % 69 % 79 % 4 % 10 % 15 % 20 % 31 % 41 % 51 % 62 % 72 % 83 % Exchange Ratio to Midstream 10 % 15 % 21 % 26 % 37 % 48 % 59 % 70 % 81 % 92 % 12 % 18 % 23 % 29 % 40 % 51 % 63 % 74 % 85 % 96 % 15 % 20 % 26 % 32 % 43 % 55 % 66 % 78 % 89 % 100 % Exchange Ratio to Midstream $ 31.27 / (3)% $ 32.00 / (1)% $ 32.83 / 2 % $ 34.40 / 7 % $ 35.96 / 12 % $ 39.09 / 21 % $ 42.22 / 31 % $ 45.34 / 41 % $ 48.47 / 50 % $ 51.60 / 60 % $ 54.72 / 70 % $ 33.60 / 4 % $ 35.20 / 9 % $ 36.80 / 14 % $ 40.00 / 24 % $ 43.20 / 34 % $ 46.40 / 44 % $ 49.60 / 54 % $ 52.80 / 64 % $ 56.00 / 74 % $ 32.67 / 1 % $ 34.31 / 6 % $ 35.94 / 11 % $ 37.58 / 17 % $ 40.84 / 27 % $ 44.11 / 37 % $ 47.38 / 47 % $ 50.65 / 57 % $ 53.91 / 67 % $ 57.18 / 77 % Exchange Ratio to Midstream Midstream Perspective $ 18.95 / (2)% $ 19.90 / 3 % $ 20.85 / 8 % $ 21.80 / 13 % $ 23.69 / 22 % $ 25.59 / 32 % $ 27.48 / 42 % $ 29.38 / 52 % $ 31.27 / 62 % $ 33.17 / 71 % $ 18.28 / (5)% $ 19.20 / (1)% $ 17.66 / (9)% $ 18.55 / (4)% $ 20.11 / 4 % $ 21.03 / 9 % $ 22.86 / 18 % $ 24.68 / 28 % $ 26.51 / 37 % $ 28.34 / 47 % $ 30.17 / 56 % $ 32.00 / 65 % $ 19.43 / 0 % $ 20.31 / 5 % $ 22.08 / 14 % $ 23.84 / 23 % $ 25.61 / 32 % $ 27.38 / 42 % $ 29.14 / 51 % $ 30.91 / 60 % Exchange Ratio to Midstream GP Perspective Illustrative PF Equity Value² $ 9,762 $ 10,250 $ 10,739 $ 11,227 $ 12,203 $ 13,179 $ 14,155 $ 15,132 $ 16,108 $ 17,084 Illustrative Uplift from $289mm PV10 of Forecasted S.Q. GP Cash Taxes + Residual Step Up: $10,1271 Illustrative Uplift from $289mm PV10 of Forecast S.Q. GP Cash Taxes: $9,6511

GRAPHIC


PRELIMINARY CONFIDENTIAL DRAFT – FOR DISCUSSION PURPOSES ONLY Appendix A: Additional Reference Materials

GRAPHIC


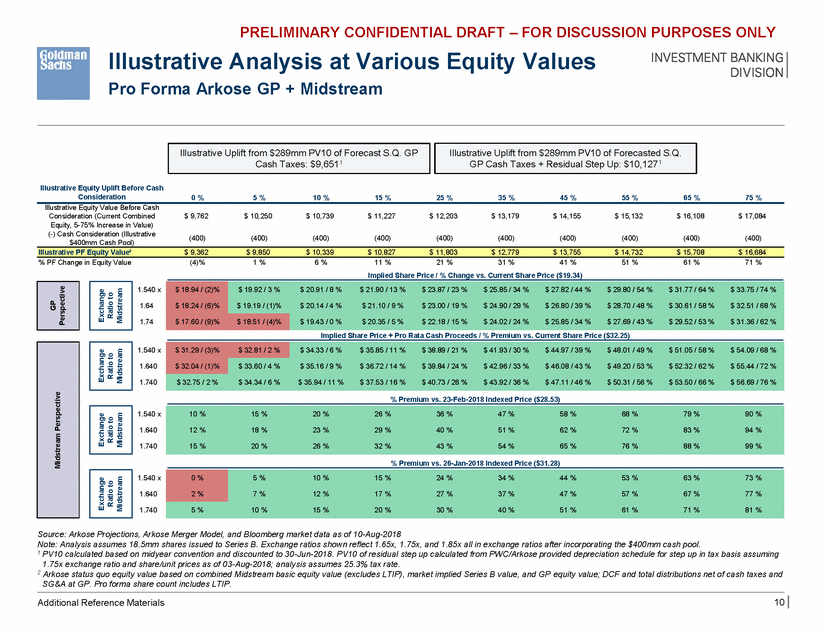
PRELIMINARY CONFIDENTIAL DRAFT – FOR DISCUSSION PURPOSES ONLY Illustrative Analysis at Various Equity Values Pro Forma Arkose GP + Midstream Illustrative Equity Uplift Before Cash Consideration 0 % 5 % 10 % 15 % 25 % 35 % 45 % 55 % 65 % 75 % Illustrative Equity Value Before Cash Consideration (Current Combined Equity, 5-75% Increase in Value) (-) Cash Consideration (Illustrative $400mm Cash Pool) $ 9,762 $ 10,250 $ 10,739 $ 11,227 $ 12,203 $ 13,179 $ 14,155 $ 15,132 $ 16,108 $ 17,084 (400) (400) (400) (400) (400) (400) (400) (400) (400) (400) % PF Change in Equity Value (4)% 1 % 6 % 11 % 21 % 31 % 41 % 51 % 61 % 71 % Implied Share Price / % Change vs. Current Share Price ($19.34) 1.540 x 1.64 1.74 Implied Share Price + Pro Rata Cash Proceeds / % Premium vs. Current Share Price ($32.25) 1.540 x 1.640 1.740 % Premium vs. 23-Feb-2018 Indexed Price ($28.53) 1.540 x 1.640 1.740 % Premium vs. 26-Jan-2018 Indexed Price ($31.28) 1.540 x 1.640 1.740 Source: Arkose Projections, Arkose Merger Model, and Bloomberg market data as of 10-Aug-2018 Note: Analysis assumes 18.5mm shares issued to Series B. Exchange ratios shown reflect 1.65x, 1.75x, and 1.85x all in exchange ratios after incorporating the $400mm cash pool. 1 PV10 calculated based on midyear convention and discounted to 30-Jun-2018. PV10 of residual step up calculated from PWC/Arkose provided depreciation schedule for step up in tax basis assuming 1.75x exchange ratio and share/unit prices as of 03-Aug-2018; analysis assumes 25.3% tax rate. 2 Arkose status quo equity value based on combined Midstream basic equity value (excludes LTIP), market implied Series B value, and GP equity value; DCF and total distributions net of cash taxes and SG&A at GP. Pro forma share count includes LTIP. 10 Additional Reference Materials 0 % 2 % 5 % 10 % 15 % 24 % 34 % 44 % 53 % 63 % 73 % 7 % 12 % 17 % 27 % 37 % 47 % 57 % 67 % 77 % 5 % 10 % 15 % 20 % 30 % 40 % 51 % 61 % 71 % 81 % Exchange Ratio to Midstream 10 % 15 % 20 % 26 % 36 % 47 % 58 % 68 % 79 % 90 % 12 % 18 % 23 % 29 % 40 % 51 % 62 % 72 % 83 % 94 % 15 % 20 % 26 % 32 % 43 % 54 % 65 % 76 % 88 % 99 % Exchange Ratio to Midstream $ 31.29 / (3)% $ 32.81 / 2 % $ 34.33 / 6 % $ 35.85 / 11 % $ 38.89 / 21 % $ 41.93 / 30 % $ 44.97 / 39 % $ 48.01 / 49 % $ 51.05 / 58 % $ 54.09 / 68 % $ 32.04 / (1)% $ 33.60 / 4 % $ 35.16 / 9 % $ 36.72 / 14 % $ 39.84 / 24 % $ 42.96 / 33 % $ 46.08 / 43 % $ 49.20 / 53 % $ 52.32 / 62 % $ 55.44 / 72 % $ 32.75 / 2 % $ 34.34 / 6 % $ 35.94 / 11 % $ 37.53 / 16 % $ 40.73 / 26 % $ 43.92 / 36 % $ 47.11 / 46 % $ 50.31 / 56 % $ 53.50 / 66 % $ 56.69 / 76 % Exchange Ratio to Midstream Midstream Perspective $ 18.94 / (2)% $ 18.24 / (6)% $ 19.92 / 3 % $ 20.91 / 8 % $ 21.90 / 13 % $ 23.87 / 23 % $ 25.85 / 34 % $ 27.82 / 44 % $ 29.80 / 54 % $ 31.77 / 64 % $ 33.75 / 74 % $ 19.19 / (1)% $ 20.14 / 4 % $ 21.10 / 9 % $ 23.00 / 19 % $ 24.90 / 29 % $ 26.80 / 39 % $ 28.70 / 48 % $ 30.61 / 58 % $ 32.51 / 68 % $ 17.60 / (9)% $ 18.51 / (4)% $ 19.43 / 0 % $ 20.35 / 5 % $ 22.18 / 15 % $ 24.02 / 24 % $ 25.85 / 34 % $ 27.69 / 43 % $ 29.52 / 53 % $ 31.36 / 62 % Exchange Ratio to Midstream GP Perspective Illustrative PF Equity Value² $ 9,362 $ 9,850 $ 10,339 $ 10,827 $ 11,803 $ 12,779 $ 13,755 $ 14,732 $ 15,708 $ 16,684 Illustrative Uplift from $289mm PV10 of Forecasted S.Q. GP Cash Taxes + Residual Step Up: $10,1271 Illustrative Uplift from $289mm PV10 of Forecast S.Q. GP Cash Taxes: $9,6511

GRAPHIC


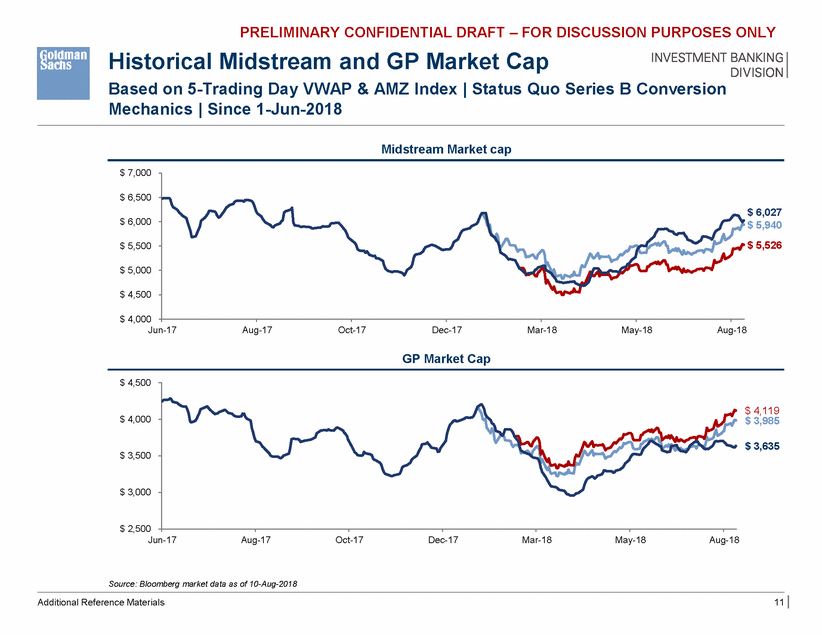
PRELIMINARY CONFIDENTIAL DRAFT – FOR DISCUSSION PURPOSES ONLY Historical Midstream and GP Market Cap Based on 5-Trading Day VWAP & AMZ Index | Status Quo Series B Conversion Mechanics | Since 1-Jun-2018 Midstream Market cap $ 7,000 $ 6,500 $ 6,027 $ 5,940 $ 5,526 $ 6,000 $ 5,500 $ 5,000 $ 4,500 $ 4,000 Jun-17 Aug-17 Oct-17 Dec-17 Mar-18 May-18 Aug-18 GP Market Cap $ 4,500 $ 4,119 $ 3,985 $ 4,000 $ 3,635 $ 3,500 $ 3,000 $ 2,500 Jun-17 Aug-17 Oct-17 Dec-17 Mar-18 May-18 Aug-18 Source: Bloomberg market data as of 10-Aug-2018 Additional Reference Materials 11

GRAPHIC


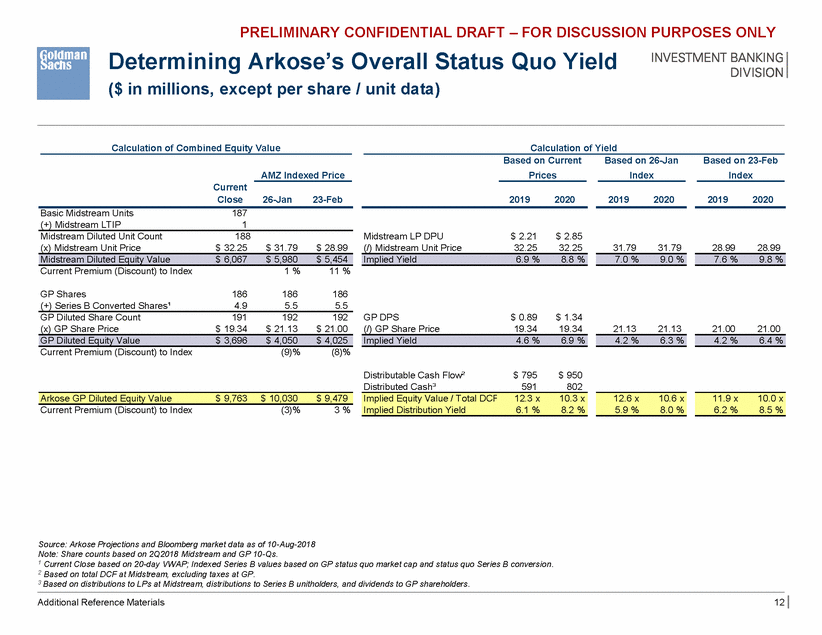
PRELIMINARY CONFIDENTIAL DRAFT – FOR DISCUSSION PURPOSES ONLY Determining Arkose’s Overall Status Quo Yield ($ in millions, except per share / unit data) Calculation of Combined Equity Value Calculation of Yield Based on Current Prices Based on 26-Jan Index Based on 23-Feb Index AMZ Indexed Price Current Close 26-Jan 23-Feb 2019 2020 2019 2020 2019 2020 Basic Midstream Units (+) Midstream LTIP 187 1 Midstream Diluted Unit Count (x) Midstream Unit Price 188 $ 32.25 Midstream LP DPU (/) Midstream Unit Price $ 2.21 32.25 $ 2.85 32.25 $ 31.79 $ 28.99 31.79 31.79 28.99 28.99 Current Premium (Discount) to Index 1 % 11 % GP Shares (+) Series B Converted Shares¹ 186 4.9 186 5.5 186 5.5 GP Diluted Share Count (x) GP Share Price 191 $ 19.34 192 $ 21.13 192 $ 21.00 GP DPS (/) GP Share Price $ 0.89 19.34 $ 1.34 19.34 21.13 21.13 21.00 21.00 Current Premium (Discount) to Index (9)% (8)% Distributable Cash Flow² Distributed Cash³ $ 795 591 $ 950 802 Current Premium (Discount) to Index (3)% 3 % Source: Arkose Projections and Bloomberg market data as of 10-Aug-2018 Note: Share counts based on 2Q2018 Midstream and GP 10-Qs. 1 Current Close based on 20-day VWAP; Indexed Series B values based on GP status quo market cap and status quo Series B conversion. 2 Based on total DCF at Midstream, excluding taxes at GP. 3 Based on distributions to LPs at Midstream, distributions to Series B unitholders, and dividends to GP shareholders. Additional Reference Materials 12 11.9 x10.0 x 6.2 %8.5 % 12.6 x10.6 x 5.9 %8.0 % Implied Equity Value / Total DCF12.3 x10.3 x Implied Distribution Yield6.1 %8.2 % Arkose GP Diluted Equity Value$ 9,763$ 10,030$ 9,479 4.2 %6.4 % 4.2 %6.3 % Implied Yield4.6 %6.9 % GP Diluted Equity Value$ 3,696$ 4,050$ 4,025 7.6 %9.8 % 7.0 %9.0 % Implied Yield6.9 %8.8 % Midstream Diluted Equity Value$ 6,067$ 5,980$ 5,454

GRAPHIC


PRELIMINARY CONFIDENTIAL DRAFT – FOR DISCUSSION PURPOSES ONLY Appendix B: Potential Exhibits for Revised Offer Letter

GRAPHIC


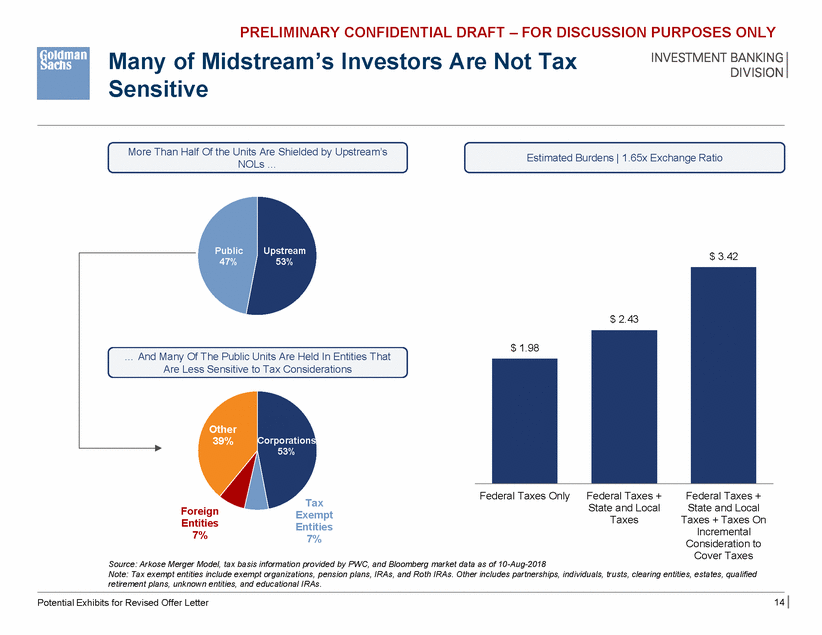
PRELIMINARY CONFIDENTIAL DRAFT – FOR DISCUSSION PURPOSES ONLY Many of Midstream’s Investors Sensitive Are Not Tax More Than Half Of the Units Are Shielded by Upstream’s NOLs … Estimated Burdens | 1.65x Exchange Ratio PPublic 47% UUpstream 53% $ 3.42 … And Many Of The Public Units Are Held In Entities That Are Less Sensitive to Tax Considerations Other 39% Corporations 53% Federal Taxes Only Federal Taxes + State and Local Taxes Federal Taxes + State and Local Taxes + Taxes On Incremental Consideration to Cover Taxes Tax Exempt Entities 7% Foreign Entities 7% Source: Arkose Merger Model, tax basis information provided by PWC, and Bloomberg market data as of 10-Aug-2018 Note: Tax exempt entities include exempt organizations, pension plans, IRAs, and Roth IRAs. Other includes partnerships, individuals, trusts, clearing entities, estates, qualified retirement plans, unknown entities, and educational IRAs. 14 Potential Exhibits for Revised Offer Letter $ 2.43 $ 1.98

GRAPHIC


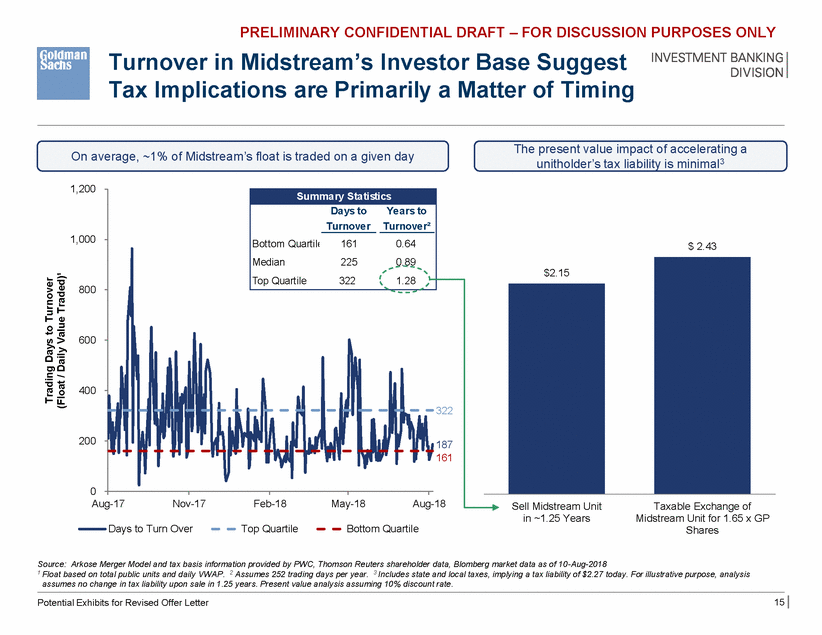
PRELIMINARY CONFIDENTIAL DRAFT – FOR DISCUSSION PURPOSES ONLY Turnover in Midstream’s Investor Base Suggest Tax Implications are Primarily a Matter of Timing The present value impact of accelerating a unitholder’s tax liability is minimal3 On average, ~1% of Midstream’s float is traded on a given day 1,200 1,000 $ 2.43 800 600 400 322 200 187 161 0 Aug-17 Nov-17 Feb-18 May-18 Aug-18 Sell Midstream Unit in ~1.25 Years Taxable Exchange of Midstream Unit for 1.65 x GP Shares Days to Turn Over Top Quartile Bottom Quartile Source: Arkose Merger Model and tax basis information provided by PWC, Thomson Reuters shareholder data, Blomberg market data as of 10-Aug-2018 1 Float based on total public units and daily VWAP. 2 Assumes 252 trading days per year. 3 Includes state and local taxes, implying a tax liability of $2.27 today. For illustrative purpose, analysis assumes no change in tax liability upon sale in 1.25 years. Present value analysis assuming 10% discount rate. 15 Potential Exhibits for Revised Offer Letter Trading Days to Turnover (Float / Daily Value Traded)¹ $2.15 Summary Statistics Days toYears to TurnoverTurnover² Bottom Quartil 161 0.64 Median 225 0.89 Top Quartile 322 1.28

GRAPHIC


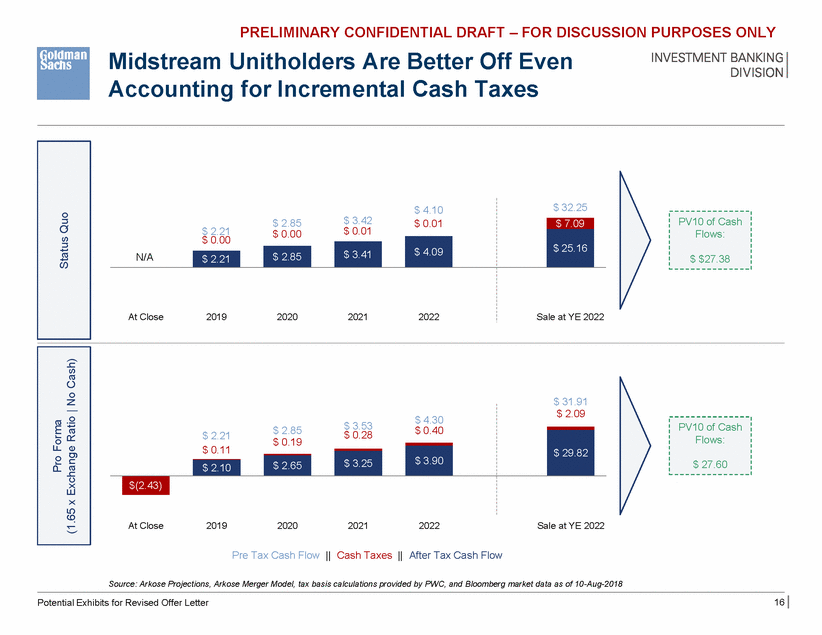
PRELIMINARY CONFIDENTIAL DRAFT – FOR DISCUSSION PURPOSES ONLY Midstream Unitholders Are Better Off Even Accounting for Incremental Cash Taxes $ 2.21 $ 0.00 $ 0.01 $ 0.00 $ 31.91 $ 3.53 $ 2.85 $ 0.40 $ 0.11 At Close 2019 2020 2021 2022 Sale at YE 2022 Pre Tax Cash Flow || Cash Taxes || After Tax Cash Flow Source: Arkose Projections, Arkose Merger Model, tax basis calculations provided by PWC, and Bloomberg market data as of 10-Aug-2018 16 Potential Exhibits for Revised Offer Letter (1.65 x Exchange Ratio | No Cash) $ 4.30 $ 2.21$ 0.19$ 0.28 $ 2.09 $ 29.82 $ 3.90 $ 3.25 $ 2.65 $ 2.10 $(2.43) PV10 of Cash Flows: $ 27.60 Pro Forma $ 4.10 $ 2.85$ 3.42$ 0.01 $ 32.25 $ 7.09 $ 25.16 $ 4.09 $ 3.41 $ 2.85 N/A $ 2.21 At Close2019202020212022 Sale at YE 2022 PV10 of Cash Flows: $ $27.38 Status Quo

GRAPHIC


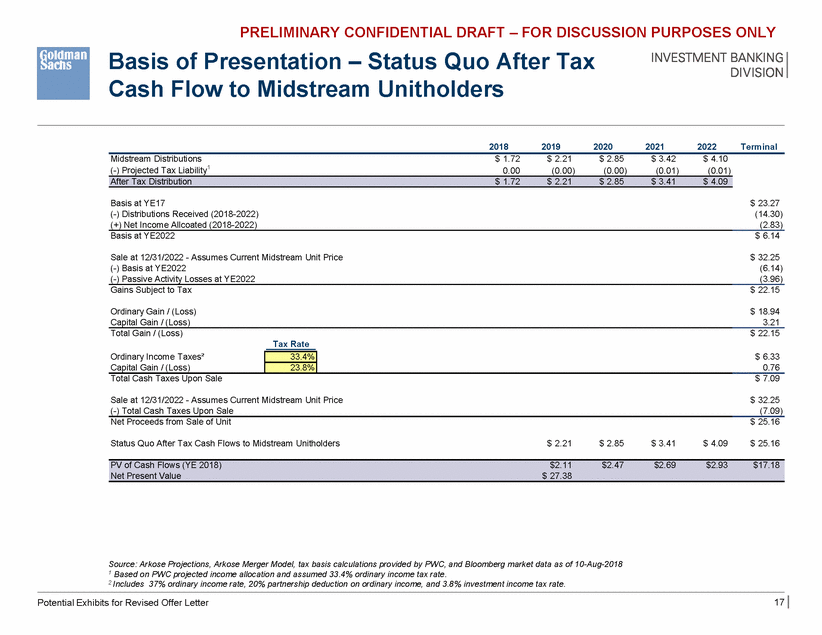
PRELIMINARY CONFIDENTIAL DRAFT – FOR DISCUSSION PURPOSES ONLY Basis of Presentation – Status Quo After Tax Cash Flow to Midstream Unitholders 2018 2019 2020 2021 2022 Terminal Midstream Distributions (-) Projected Tax Liability1 $ 1.72 0.00 $ 2.21 (0.00) $ 2.85 (0.00) $ 3.42 (0.01) $ 4.10 (0.01) Basis at YE17 (-) Distributions Received (2018-2022) (+) Net Income Allcoated (2018-2022) $ 23.27 (14.30) (2.83) Basis at YE2022 $ 6.14 Sale at 12/31/2022 - Assumes Current Midstream Unit Price (-) Basis at YE2022 (-) Passive Activity Losses at YE2022 $ 32.25 (6.14) (3.96) Gains Subject to Tax $ 22.15 Ordinary Gain / (Loss) Capital Gain / (Loss) $ 18.94 3.21 Total Gain / (Loss) $ 22.15 Tax Rate Total Cash Taxes Upon Sale $ 7.09 Sale at 12/31/2022 - Assumes Current Midstream Unit Price (-) Total Cash Taxes Upon Sale $ 32.25 (7.09) Net Proceeds from Sale of Unit $ 25.16 Status Quo After Tax Cash Flows to Midstream Unitholders $ 2.21 $ 2.85 $ 3.41 $ 4.09 $ 25.16 Source: Arkose Projections, Arkose Merger Model, tax basis calculations provided by PWC, and Bloomberg market data as of 10-Aug-2018 1 Based on PWC projected income allocation and assumed 33.4% ordinary income tax rate. 2 Includes 37% ordinary income rate, 20% partnership deduction on ordinary income, and 3.8% investment income tax rate. 17 Potential Exhibits for Revised Offer Letter PV of Cash Flows (YE 2018)$2.11$2.47$2.69$2.93$17.18 Net Present Value$ 27.38 Ordinary Income Taxes² Capital Gain / (Loss) 33.4% $ 6.33 0.76 23.8% After Tax Distribution$ 1.72$ 2.21$ 2.85$ 3.41$ 4.09

GRAPHIC


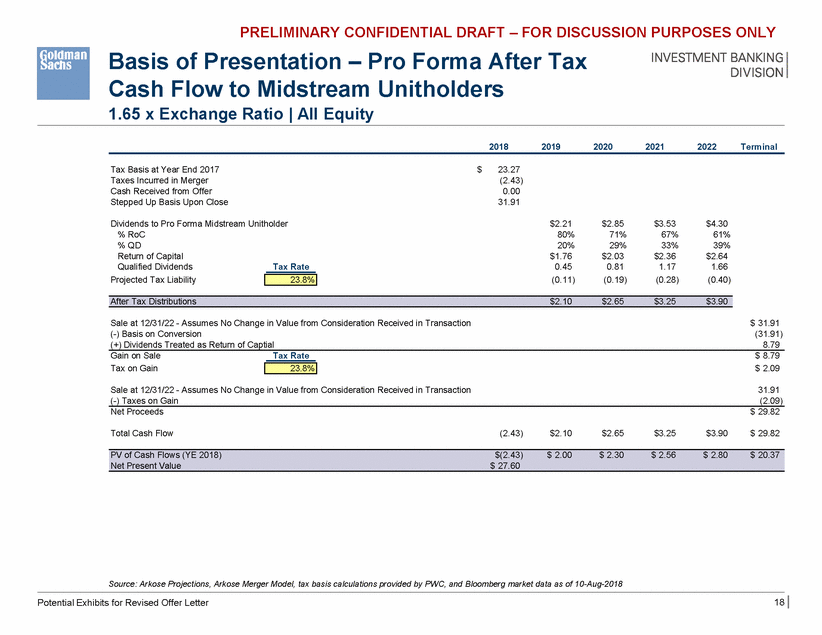
PRELIMINARY CONFIDENTIAL DRAFT – FOR DISCUSSION PURPOSES ONLY Basis of Presentation – Pro Forma After Tax Cash Flow to Midstream Unitholders 1.65 x Exchange Ratio | All Equity 2018 2019 2020 2021 2022 Terminal Tax Basis at Year End 2017 Taxes Incurred in Merger Cash Received from Offer Stepped Up Basis Upon Close $ 23.27 (2.43) 0.00 31.91 Dividends to Pro Forma Midstream Unitholder % RoC % QD Return of Capital $2.21 80% 20% $1.76 0.45 (0.11) $2.85 71% 29% $2.03 0.81 (0.19) $3.53 67% 33% $2.36 1.17 (0.28) $4.30 61% 39% $2.64 1.66 (0.40) Qualified Dividends Projected Tax Liability Tax Rate Sale at 12/31/22 - Assumes No Change in Value from Consideration Received in Transaction (-) Basis on Conversion (+) Dividends Treated as Return of Captial $ 31.91 (31.91) 8.79 Gain on Sale Tax on Gain Tax Rate $ 8.79 $ 2.09 Sale at 12/31/22 - Assumes No Change in Value from Consideration Received in Transaction (-) Taxes on Gain 31.91 (2.09) Net Proceeds $ 29.82 Total Cash Flow (2.43) $2.10 $2.65 $3.25 $3.90 $ 29.82 Source: Arkose Projections, Arkose Merger Model, tax basis calculations provided by PWC, and Bloomberg market data as of 10-Aug-2018 18 Potential Exhibits for Revised Offer Letter PV of Cash Flows (YE 2018)$(2.43)$ 2.00$ 2.30$ 2.56$ 2.80$ 20.37 Net Present Value$ 27.60 23.8% After Tax Distributions$2.10$2.65$3.25$3.90 23.8%

GRAPHIC