Exhibit (c)(30)

Project Francis Conflicts Committee of the GP LLC Precedent Premia Reference Materials Board of Directors of Arkose August 21, 2018 PRIVATE AND CONFIDENTIAL. This document is being sent to you for your information only as an investment banking client of Gol dman Sachs and should not be forwarded outside of your organization. This document has been prepared by the Investment Banking Division and is not a produ ct of Goldman Sachs Global Investment Research. This document should not be used as a basis for trading in the securities or loans of the companies name d herein or for any other investment decision. This document does not constitute an offer to sell the securities or loans of the companies named herein or a solic itation of proxies or votes and should not be construed as consisting of investment advice. Goldman Sachs does not provide accounting, tax, or legal advice.
GRAPHIC


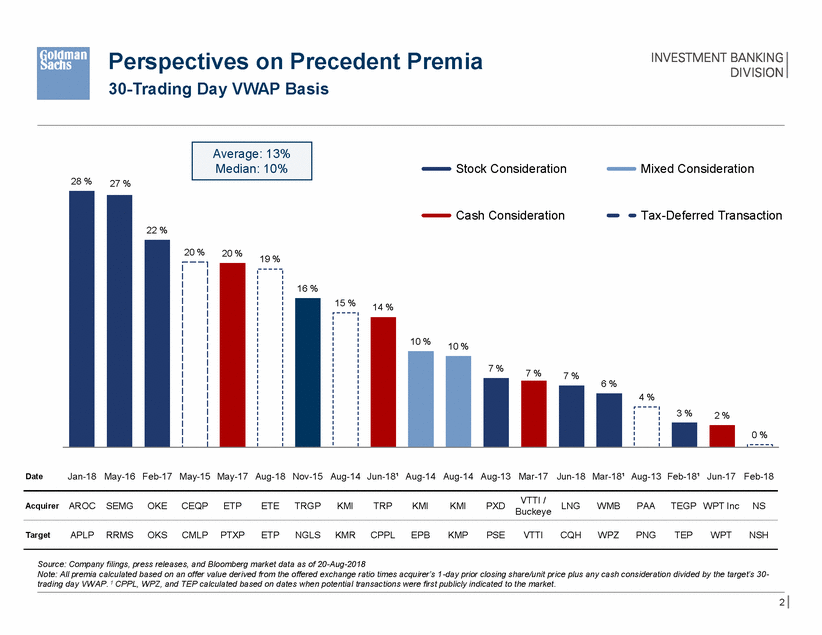
Implied Premiums and Illustrative Ownership Impact at Various Exchange Ratios GP Last Offer Midstream Last Offer Last Close 30 Trading Day VWAP Illustrative All Equity Exchange Ratio Range Shares Issued for Midstream¹ (+) Series B Conversion (+) GP Shares Outstanding 306 19 186 312 19 186 320 19 186 325 19 186 329 19 186 334 19 186 339 19 186 343 19 186 348 19 186 351 19 186 Total Shares Outstanding 511 517 525 529 534 539 543 548 553 556 Metrics Current Last Close 30-Trading Day VWAP Midstream VWAP / GP Closing Price Midstream GP Implied Premia $ 31.06 31.59 31.59 $ 19.09 19.03 19.09 (0)% (2) (2) 2 % 0 0 4 % 2 3 6 % 4 4 8 % 5 6 9 % 7 7 11 % 8 9 12 % 10 10 14 % 11 12 15 % 12 13 At 26-Jan-2018 (1 Trading Day Prior to Strategic Review) Last Close 30-Trading Day VWAP Midstream VWAP / GP Closing Price $ 33.13 30.23 30.23 $ 22.02 19.93 22.02 8 % 7 19 10 % 9 21 13 % 12 24 15 % 14 26 16 % 15 27 18 % 17 29 20 % 19 31 21 % 20 33 23 % 22 35 24 % 23 36 Pro Forma Ownership - All Equity Midstream Series B GP 59.9 % 3.6 36.5 60.4 % 3.6 36.0 61.0 % 3.5 35.5 61.3 % 3.5 35.2 61.7 % 3.5 34.9 62.0 % 3.4 34.6 62.3 % 3.4 34.3 62.6 % 3.4 34.0 63.0 % 3.3 33.7 63.2 % 3.3 33.5 Source: Arkose Midstream and GP 2017 10-Ks and Bloomberg market data as of 20-Aug-2018 1 Includes ~1mm units under Midstream’s LTIP and ~187mm common units outstanding. 1 Illustrative Exchange Ratios (Midstream / GP)1.63 x1.66 x1.700 x1.725 x1.750 x1.775 x1.800 x1.825 x1.850 x1.865 x

GRAPHIC


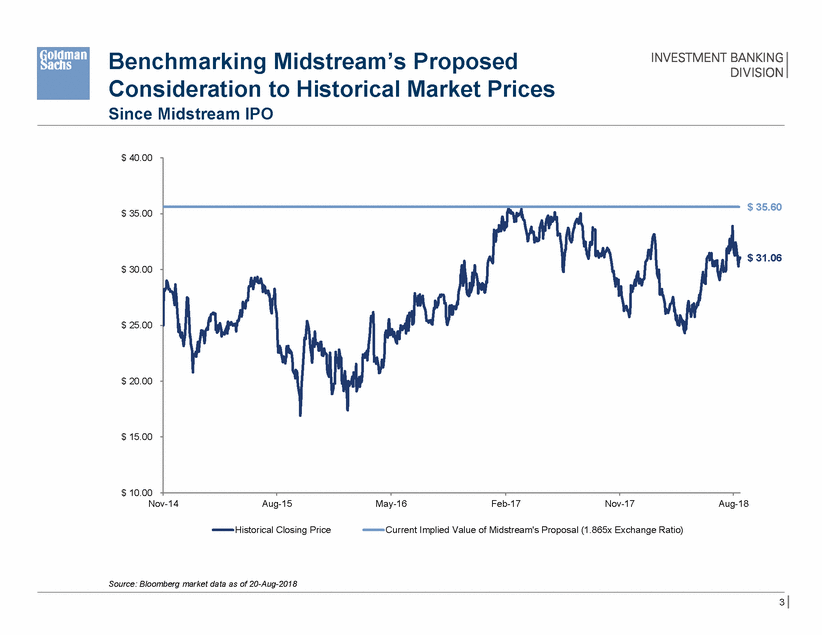
Perspectives on Precedent 30-Trading Day VWAP Basis Premia Stock Consideration Mixed Consideration 28 % 27 % saction 6 % DateJan-18 May-16 Feb-17 May-15 May-17 Aug-18 Nov-15 Aug-14 Jun-18¹ Aug-14 Aug-14 Aug-13 Mar-17 Jun-18 Mar-18¹ Aug-13 Feb-18¹ Jun-17 Feb-18 VTTI / Buckeye AROC SEMG OKE CEQP ETP ETE TRGP KMI TRP KMI KMI PXD LNG WMB PAA TEGP WPT IncNS Acquirer APLP RRMS OKS CMLP PTXP ETP NGLS KMR CPPL EPB KMP PSE VTTI CQH WPZ PNG TEP WPT NSH Target Source: Company filings, press releases, and Bloomberg market data as of 20-Aug-2018 Note: All premia calculated based on an offer value derived from the offered exchange ratio times acquirer’s 1-day prior closing share/unit price plus any cash consideration divided by the target’s 30-trading day VWAP. 1 CPPL, WPZ, and TEP calculated based on dates when potential transactions were first publicly indicated to the market. 2 Cash ConsiderationTax-Deferred Tran 22 % 20 %20 %19 % 16 % 15 %14 % 10 %10 % 7 %7 %7 % 4 % 3 %2 % 0 % Average: 13% Median: 10%

GRAPHIC


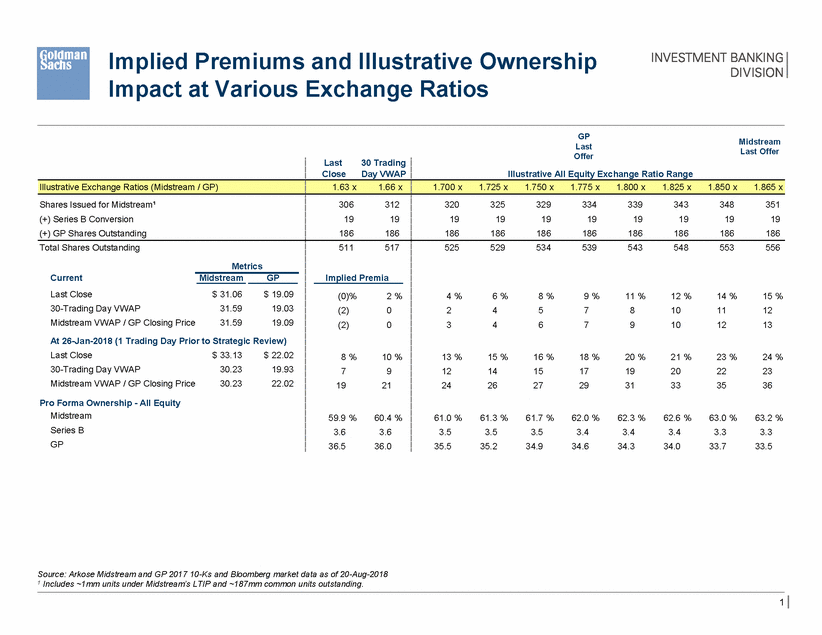
Benchmarking Midstream’s Proposed Consideration to Since Midstream IPO Historical Market Prices $ 40.00 $ 35.60 $ 35.00 $ 31.06 $ 30.00 $ 25.00 $ 20.00 $ 15.00 $ 10.00 Nov-14 Aug-15 May-16 Feb-17 Nov-17 Aug-18 Historical Closing Price Current Implied Value of Midstream's Proposal (1.865x Exchange Ratio) Source: Bloomberg market data as of 20-Aug-2018 3

GRAPHIC