Project Francis Conflicts Committee GP LLC Discussion Materials of the Board of Directors of Arkose October 8, 2018
Project Francis Conflicts Committee GP LLC Discussion Materials of the Board of Directors of Arkose October 8, 2018

Disclaimer These materials have been prepared and are provided by Goldman Sachs on a confidential basis solely for the information and assistance of the Conflicts Committee of Board of Directors of Arkose GP LLC (the “General Partner” and such conflicts committee, the “Committee”), the general partner of Arkose Midstream GP LP (the "Company"), in connection with its consideration of the matters referred to herein. These materials and Goldman Sachs’ presentation relating to these materials (the “Confidential Information”) may not be disclosed to any third party or circulated or referred to publicly or used for or relied upon for any other purpose without the prior written consent of Goldman Sachs. The Confidential Information was not prepared with a view to public disclosure or to conform to any disclosure standards under any state, federal or international securities laws or other laws, rules or regulations, and Goldman Sachs does not take any responsibility for the use of the Confidential Information by persons other than those set forth above. Notwithstanding anything in this Confidential Information to the contrary, the Committee may disclose to any person the US federal income and state income tax treatment and tax structure of any transaction described herein and all materials of any kind (including tax opinions and other tax analyses) that are provided to the Committee relating to such tax treatment and tax structure, without Goldman Sachs imposing any limitation of any kind. The Confidential Information has been prepared by the Investment Banking Division of Goldman Sachs and is not a product of its research department. Goldman Sachs and its affiliates are engaged in advisory, underwriting and financing, principal investing, sales and trading, research, investment management and other financial and non-financial activities and services for various persons and entities. Goldman Sachs and its affiliates and employees, and funds or other entities they manage or in which they invest or have other economic interests or with which they co-invest, may at any time purchase, sell, hold or vote long or short positions and investments in securities, derivatives, loans, commodities, currencies, credit default swaps and other financial instruments of the Company, any other party to any transaction and any of their respective affiliates or any currency or commodity that may be involved in any transaction. Goldman Sachs’ investment banking division maintains regular, ordinary course client service dialogues with clients and potential clients to review events, opportunities, and conditions in particular sectors and industries and, in that connection, Goldman Sachs may make reference to the Company, the Committee or the General Partner, but Goldman Sachs will not disclose any confidential information received from the Company, the Committee or the General Partner. The Confidential Information has been prepared based on historical financial information, forecasts and other information obtained by Goldman Sachs from publicly available sources, the management of the Company or other sources (approved for our use by the Committee in the case of information from management and non-public information). In preparing the Confidential Information, Goldman Sachs has relied upon and assumed, without assuming any responsibility for independent verification, the accuracy and completeness of all of the financial, legal, regulatory, tax, accounting and other information provided to, discussed with or reviewed by us, and Goldman Sachs does not assume any liability for any such information. Goldman Sachs does not provide accounting, tax, legal or regulatory advice. Goldman Sachs has not made an independent evaluation or appraisal of the assets and liabilities (including any contingent, derivative or other off-balance sheet assets and liabilities) of the Company or any other party to any transaction or any of their respective affiliates and has no obligation to evaluate the solvency of the Company or any other party to any transaction under any state or federal laws relating to bankruptcy, insolvency or similar matters. The analyses contained in the Confidential Information do not purport to be appraisals nor do they necessarily reflect the prices at which businesses or securities actually may be sold or purchased. Goldman Sachs’ role in any due diligence review is limited solely to performing such a review as it shall deem necessary to support its own advice and analysis and shall not be on behalf of the Company, the Committee or the General Partner. Analyses based upon forecasts of future results are not necessarily indicative of actual future results, which may be significantly more or less favorable than suggested by these analyses, and Goldman Sachs does not assume responsibility if future results are materially different from those forecast. The Confidential Information does not address the underlying business decision of the Company to engage in any transaction, or the relative merits of any transaction or strategic alternative referred to herein as compared to any other transaction or alternative that may be available to the Company. The Confidential Information is necessarily based on economic, monetary, market and other conditions as in effect on, and the information made available to Goldman Sachs as of, the date of such Confidential Information and Goldman Sachs assumes no responsibility for updating or revising the Confidential Information based on circumstances, developments or events occurring after such date. The Confidential Information does not constitute any opinion, nor does the Confidential Information constitute a recommendation to the Committee, any security holder of the Company or any other person as to how to vote or act with respect to any transaction or any other matter. The Confidential Information, including this disclaimer, is subject to, and governed by, any written agreement between the Company, the Committee or the General partner, on the one hand, and Goldman Sachs, on the other hand. 1
Table of Contents I. II. III. Transaction Overview Financial Forecasts Financial Analyses Appendix A: Appendix B: Appendix C: Cost of Capital Materials Additional Valuation Reference Materials Additional Detail on Financial Forecasts 2
I. Transaction Overview
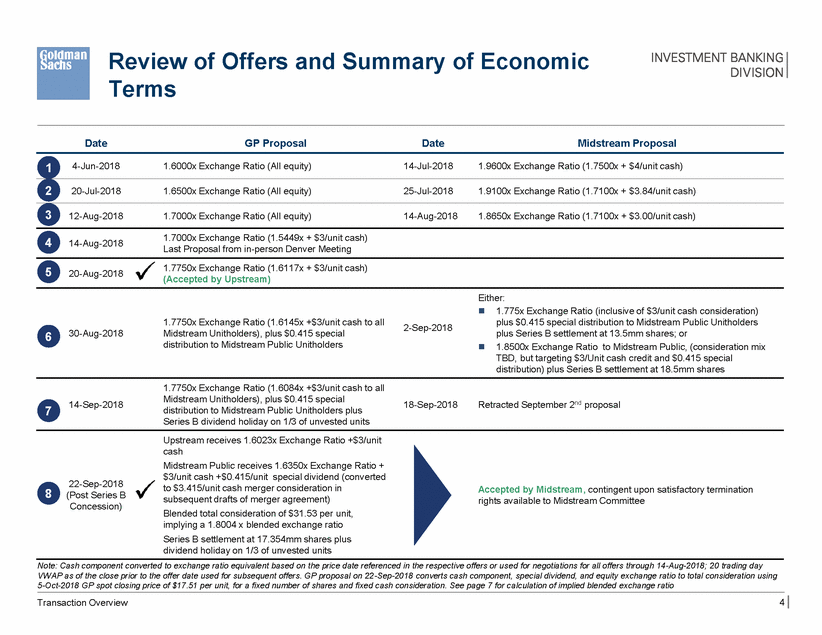
Review of Offers and Terms Summary of Economic Date GP Proposal Date Midstream Proposal 1 4-Jun-2018 1.6000x Exchange Ratio (All equity) 14-Jul-2018 1.9600x Exchange Ratio (1.7500x + $4/unit cash) 2 20-Jul-2018 1.6500x Exchange Ratio (All equity) 25-Jul-2018 1.9100x Exchange Ratio (1.7100x + $3.84/unit cash) 3 12-Aug-2018 1.7000x Exchange Ratio (All equity) 14-Aug-2018 1.8650x Exchange Ratio (1.7100x + $3.00/unit cash) 1.7000x Exchange Ratio (1.5449x + $3/unit cash) Last Proposal from in-person Denver Meeting 4 14-Aug-2018 1.7750x Exchange Ratio (1.6117x + $3/unit cash) (Accepted by Upstream) 5 20-Aug-2018 Either: 1.775x Exchange Ratio (inclusive of $3/unit cash consideration) plus $0.415 special distribution to Midstream Public Unitholders plus Series B settlement at 13.5mm shares; or 1.8500x Exchange Ratio to Midstream Public, (consideration mix TBD, but targeting $3/Unit cash credit and $0.415 special distribution) plus Series B settlement at 18.5mm shares 1.7750x Exchange Ratio (1.6145x +$3/unit cash to all Midstream Unitholders), plus $0.415 special distribution to Midstream Public Unitholders 2-Sep-2018 30-Aug-2018 6 1.7750x Exchange Ratio (1.6084x +$3/unit cash to all Midstream Unitholders), plus $0.415 special distribution to Midstream Public Unitholders plus Series B dividend holiday on 1/3 of unvested units Retracted September 2nd proposal 14-Sep-2018 18-Sep-2018 7 Upstream receives 1.6023x Exchange Ratio +$3/unit cash Midstream Public receives 1.6350x Exchange Ratio + $3/unit cash +$0.415/unit special dividend (converted to $3.415/unit cash merger consideration in subsequent drafts of merger agreement) Blended total consideration of $31.53 per unit, implying a 1.8004 x blended exchange ratio Series B settlement at 17.354mm shares plus dividend holiday on 1/3 of unvested units 22-Sep-2018 (Post Series B Concession) Accepted by Midstream, contingent upon satisfactory termination rights available to Midstream Committee 8 Note: Cash component converted to exchange ratio equivalent based on the price date referenced in the respective offers or us ed for negotiations for all offers through 14-Aug-2018; 20 trading day VWAP as of the close prior to the offer date used for subsequent offers. GP proposal on 22-Sep-2018 converts cash component, special dividend, and equity exchange ratio to total consideration using 5-Oct-2018 GP spot closing price of $17.51 per unit, for a fixed number of shares and fixed cash consideration. See page 7 for calculation of implied blended exchange ratio 4 Transaction Overview
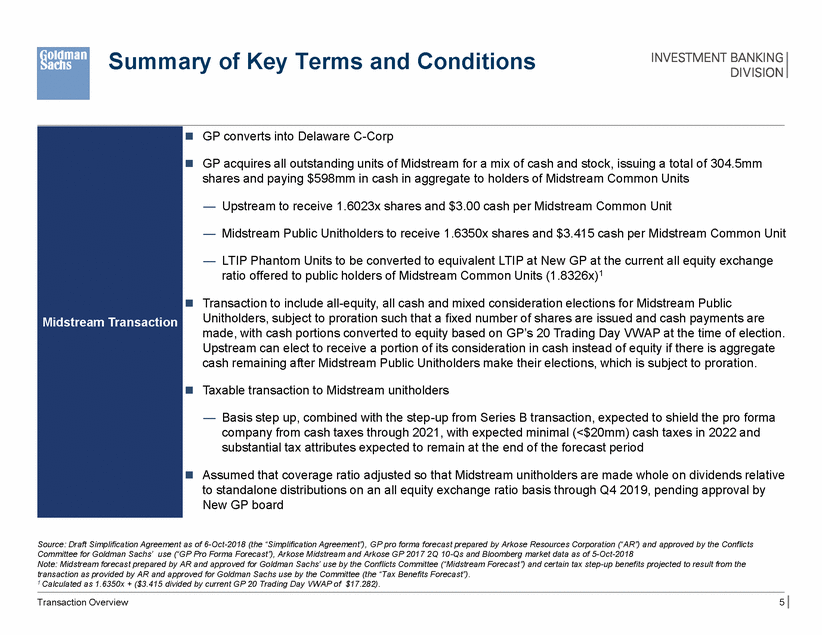
Summary of Key Terms and Conditions made, with cash portions converted to equity based on GP’s 20 Trading Day VWAP at the time of election. Source: Draft Simplification Agreement as of 6-Oct-2018 (the “Simplification Agreement”), GP pro forma forecast prepared by Arkose Resources Corporation (“AR”) and approved by the Conflicts Committee for Goldman Sachs’ use (“GP Pro Forma Forecast”), Arkose Midstream and Arkose GP 2017 2Q 10-Qs and Bloomberg market data as of 5-Oct-2018 Note: Midstream forecast prepared by AR and approved for Goldman Sachs’ use by the Conflicts Committee (“Midstream Forecast”) and certain tax step-up benefits projected to result from the transaction as provided by AR and approved for Goldman Sachs use by the Committee (the “Tax Benefits Forecast”). 1 Calculated as 1.6350x + ($3.415 divided by current GP 20 Trading Day VWAP of $17.282). Transaction Overview 5 Midstream Transaction GP converts into Delaware C-Corp GP acquires all outstanding units of Midstream for a mix of cash and stock, issuing a total of 304.5mm shares and paying $598mm in cash in aggregate to holders of Midstream Common Units — Upstream to receive 1.6023x shares and $3.00 cash per Midstream Common Unit — Midstream Public Unitholders to receive 1.6350x shares and $3.415 cash per Midstream Common Unit — LTIP Phantom Units to be converted to equivalent LTIP at New GP at the current all equity exchange ratio offered to public holders of Midstream Common Units (1.8326x)1 Transaction to include all-equity, all cash and mixed consideration elections for Midstream Public Unitholders, subject to proration such that a fixed number of shares are issued and cash payments are Upstream can elect to receive a portion of its consideration in cash instead of equity if there is aggregate cash remaining after Midstream Public Unitholders make their elections, which is subject to proration. Taxable transaction to Midstream unitholders — Basis step up, combined with the step-up from Series B transaction, expected to shield the pro forma company from cash taxes through 2021, with expected minimal (<$20mm) cash taxes in 2022 and substantial tax attributes expected to remain at the end of the forecast period Assumed that coverage ratio adjusted so that Midstream unitholders are made whole on dividends relative to standalone distributions on an all equity exchange ratio basis through Q4 2019, pending approval by New GP board
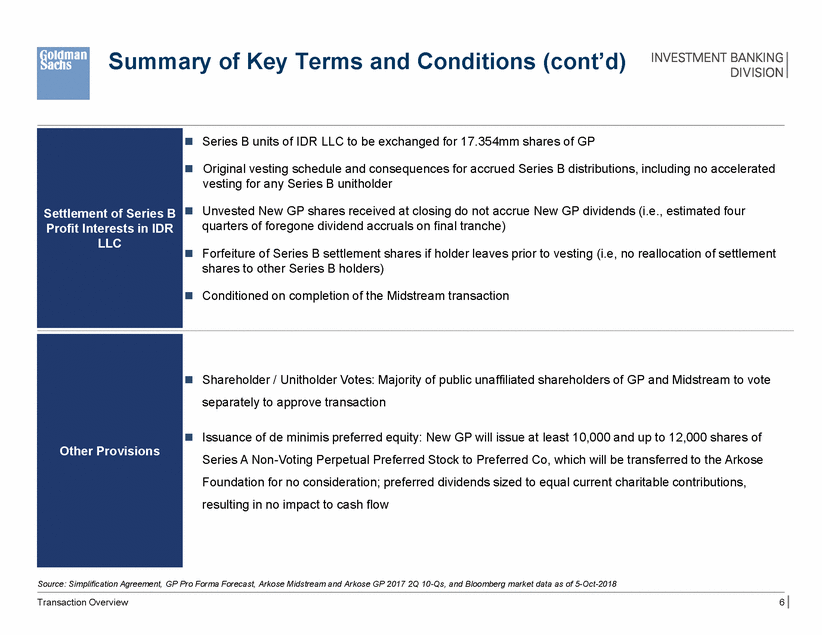
Summary of Key Terms and Conditions (cont’d) Series B units of IDR LLC to be exchanged for 17.354mm shares of GP Original vesting schedule and consequences for accrued Series B distributions, including no accelerated vesting for any Series B unitholder Unvested New GP shares received at closing do not accrue New GP dividends (i.e., estimated four quarters of foregone dividend accruals on final tranche) Forfeiture of Series B settlement shares if holder leaves prior to vesting (i.e, no reallocation of settlement shares to other Series B holders) Conditioned on completion of the Midstream transaction Shareholder / Unitholder Votes: Majority of public unaffiliated shareholders of GP and Midstream to vote separately to approve transaction Issuance of de minimis preferred equity: New GP will issue at least 10,000 and up to 12,000 shares of Series A Non-Voting Perpetual Preferred Stock to Preferred Co, which will be transferred to the Arkose Foundation for no consideration; preferred dividends sized to equal current charitable contributions, resulting in no impact to cash flow Source: Simplification Agreement, GP Pro Forma Forecast, Arkose Midstream and Arkose GP 2017 2Q 10-Qs, and Bloomberg market data as of 5-Oct-2018 Transaction Overview 6 Other Provisions Settlement of Series B Profit Interests in IDR LLC
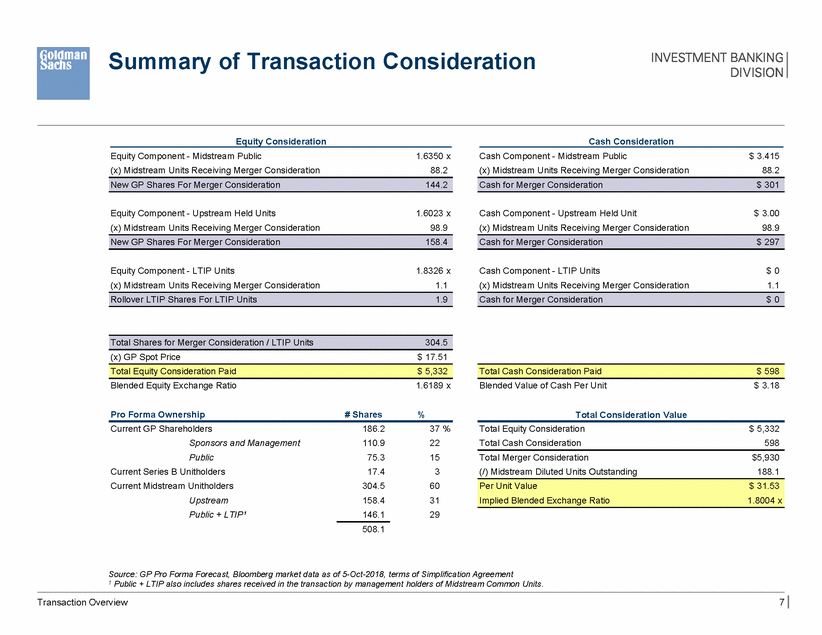
Summary of Transaction Consideration Equity Consideration Cash Consideration Equity Component - Midstream Public (x) Midstream Units Receiving Merger Consideration 1.6350 x 88.2 Cash Component - Midstream Public (x) Midstream Units Receiving Merger Consideration $ 3.415 88.2 Equity Component - Upstream Held Units (x) Midstream Units Receiving Merger Consideration 1.6023 x 98.9 Cash Component - Upstream Held Unit (x) Midstream Units Receiving Merger Consideration $ 3.00 98.9 Equity Component - LTIP Units (x) Midstream Units Receiving Merger Consideration 1.8326 x 1.1 Cash Component - LTIP Units (x) Midstream Units Receiving Merger Consideration $ 0 1.1 (x) GP Spot Price $ 17.51 Blended Equity Exchange Ratio 1.6189 x Blended Value of Cash Per Unit $ 3.18 Pro Forma Ownership # Shares % Total Consideration Value Current GP Shareholders Sponsors and Management Public Current Series B Unitholders Current Midstream Unitholders Upstream Public + LTIP¹ 186.2 110.9 75.3 17.4 304.5 158.4 146.1 37 % 22 15 3 60 31 29 Total Equity Consideration Total Cash Consideration $ 5,332 598 Total Merger Consideration (/) Midstream Diluted Units Outstanding $5,930 188.1 508.1 Source: GP Pro Forma Forecast, Bloomberg market data as of 5-Oct-2018, terms of Simplification Agreement 1 Public + LTIP also includes shares received in the transaction by management holders of Midstream Common Units. Transaction Overview 7 Per Unit Value $ 31.53 Implied Blended Exchange Ratio 1.8004 x Total Cash Consideration Paid $ 598 Total Equity Consideration Paid $ 5,332 Total Shares for Merger Consideration / LTIP Units 304.5 Cash for Merger Consideration $ 0 Rollover LTIP Shares For LTIP Units 1.9 Cash for Merger Consideration $ 297 New GP Shares For Merger Consideration 158.4 Cash for Merger Consideration $ 301 New GP Shares For Merger Consideration 144.2
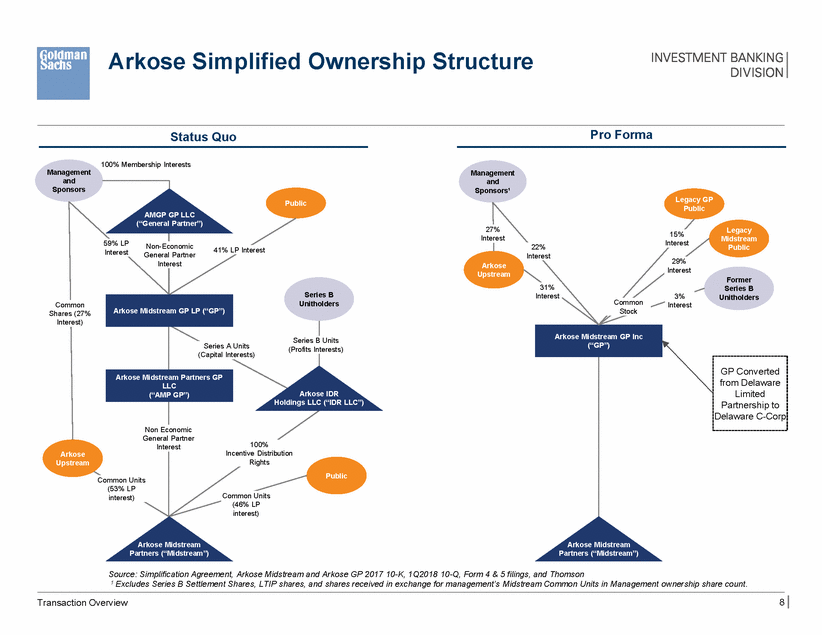
Arkose Simplified Ownership Structure Pro Forma Status Quo 100% Membership Interests Management and Sponsors Management and Sponsors¹ Legacy GP Public Public AMGP GP LLC (“General Partner”) 27% Interest Legacy Midstream Public 15% Interest 59% LP Interest Non-Economic General Partner Interest 22% Interest 41% LP Interest 29% Interest Arkose Upstream Former Series B Unitholders 31% Interest Series B Unitholders 3% Interest Common Stock Common Shares (27% Interest) Series B Units (Profits Interests) Units erests) Arkose IDR Holdings LLC (“IDR LLC”) Non Economic General Partner Interest 100% Incentive Distribution Rights Arkose Upstream Public Common Units (53% LP interest) Common Units (46% LP interest) Arkose Midstream Partners (“Midstream”) Arkose Midstream Partners (“Midstream”) Source: Simplification Agreement, Arkose Midstream and Arkose GP 2017 10-K, 1Q2018 10-Q, Form 4 & 5 filings, and Thomson 1 Excludes Series B Settlement Shares, LTIP shares, and shares received in exchange for management’s Midstream Common Units in Management ownership share count. 8 Transaction Overview GP Converted from Delaware Limited Partnership to Delaware C-Corp Arkose Midstream GP Inc (“GP”) Arkose Midstream GP LP (“GP”) Series A (Capital Int Arkose Midstream Partners GP LLC (“AMP GP”)
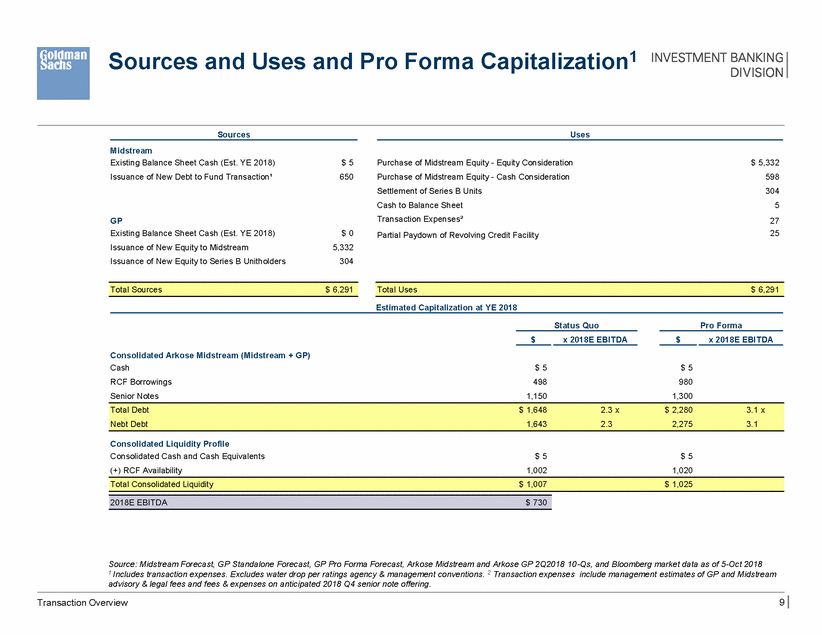
Pro Forma Capitalization1 Sources and Uses and Sources Uses Midstream Existing Balance Sheet Cash (Est. YE 2018) Issuance of New Debt to Fund Transaction¹ $ 5 650 Purchase of Midstream Equity - Equity Consideration Purchase of Midstream Equity - Cash Consideration Settlement of Series B Units Cash to Balance Sheet Transaction Expenses² Partial Paydown of Revolving Credit Facility $ 5,332 598 304 5 27 25 GP Existing Balance Sheet Cash (Est. YE 2018) Issuance of New Equity to Midstream Issuance of New Equity to Series B Unitholders $ 0 5,332 304 Estimated Capitalization at YE 2018 Status Quo Pro Forma $ x 2018E EBITDA $ x 2018E EBITDA Consolidated Arkose Midstream (Midstream + GP) Cash RCF Borrowings Senior Notes $ 5 498 1,150 $ 5 980 1,300 Consolidated Liquidity Profile Consolidated Cash and Cash Equivalents (+) RCF Availability $ 5 1,002 $ 5 1,020 Source: Midstream Forecast, GP Standalone Forecast, GP Pro Forma Forecast, Arkose Midstream and Arkose GP 2Q2018 10-Qs, and Bloomberg market data as of 5-Oct 2018 1 Includes transaction expenses. Excludes water drop per ratings agency & management conventions. 2 Transaction expenses include management estimates of GP and Midstream advisory & legal fees and fees & expenses on anticipated 2018 Q4 senior note offering. 9 Transaction Overview 2018E EBITDA $ 730 Total Consolidated Liquidity $ 1,007 $ 1,025 Total Debt $ 1,648 2.3 x $ 2,280 3.1 x Nebt Debt 1,643 2.3 2,275 3.1 Total Uses $ 6,291 Total Sources $ 6,291
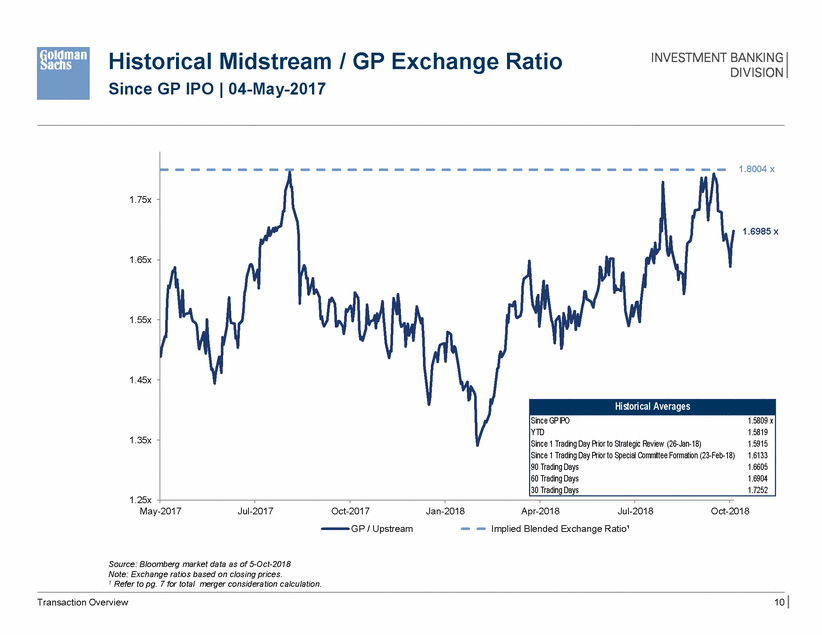
Historical Midstream Since GP IPO | 04-May-2017 / GP Exchange Ratio 1.8004 x 1.75x 1.6985 x 1.65x 1.55x 1.45x 1.35x 1.25x May-2017 Jul-2017 Oct-2017 Jan-2018 Apr-2018 Jul-2018 Oct-2018 GP / Upstream Implied Blended Exchange Ratio¹ Source: Bloomberg market data as of 5-Oct-2018 Note: Exchange ratios based on closing prices. 1 Refer to pg. 7 for total merger consideration calculation. Transaction Overview 10 1.5809 x 1.5819 1.5915 1.6133 1.6605 1.6904 1.7252 Historical Averages Since GP IPO YTD Since 1 Trading Day Prior to Strategic Review (26-Jan-18) Since 1 Trading Day Prior to Special Committee Formation (23-Feb-18) 90 Trading Days 60 Trading Days 30 Trading Days
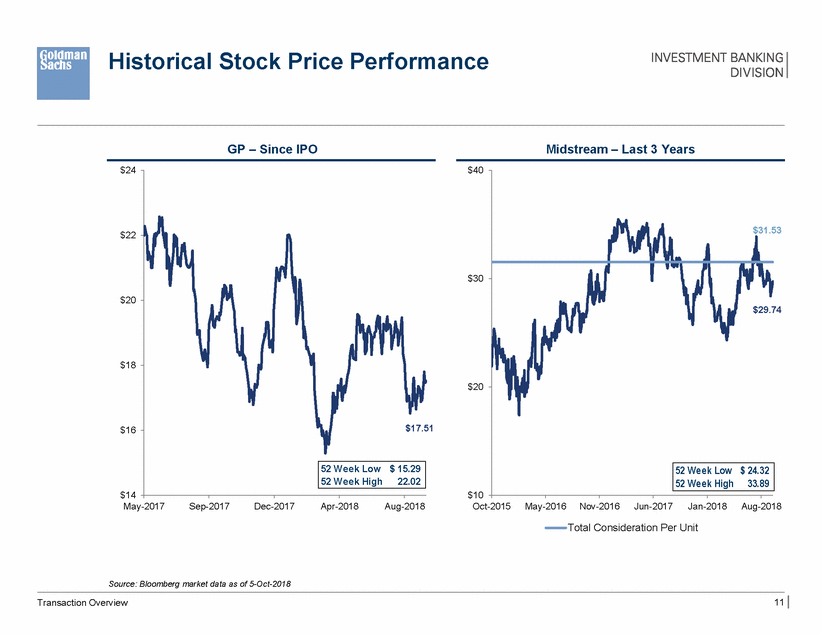
Historical Stock Price Performance GP – Since IPO Midstream – Last 3 Years $24 $40 53 $22 $30 $20 74 $18 $20 .51 $16 $14 $10 May-2017 Sep-2017 Dec-2017 Apr-2018 Aug-2018 Oct-2015 May-2016 Nov-2016 Jun-2017 Jan-2018 Aug-2018 Total Consideration Per Unit Source: Bloomberg market data as of 5-Oct-2018 11 Transaction Overview $31. $29. 52 Week Low $ 24.32 52 Week High33.89 $17 52 Week Low $ 15.29 52 Week High22.02
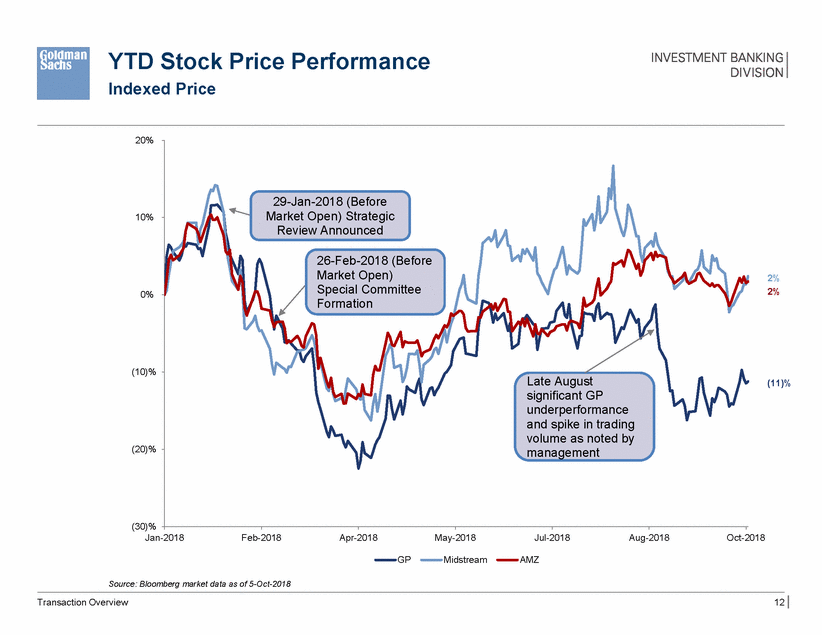
YTD Stock Indexed Price Price Performance 20% 10% 2% 2% 0% (10)% (11)% (20)% (30)% Jan-2018 Feb-2018 Apr-2018 May-2018 Jul-2018 Aug-2018 Oct-2018 GP Midstream AMZ Source: Bloomberg market data as of 5-Oct-2018 Transaction Overview 12 29-Jan-2018 (Before Market Open) Strategic Review Announced 26-Feb-2018 (Before Market Open) Special Committee Formation Late August significant GP underperformance and spike in trading volume as noted by management
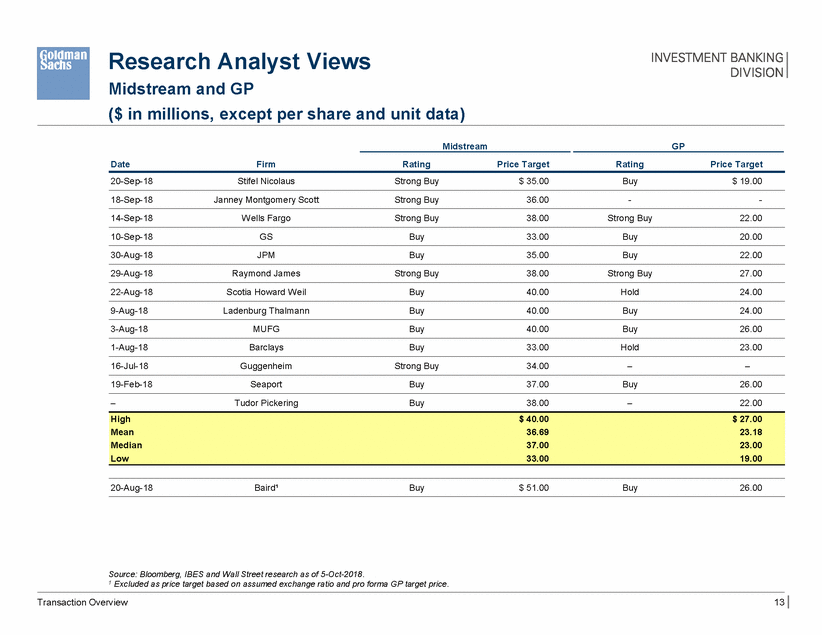
Research Analyst Views Midstream and GP ($ in millions, except per share and unit data) Midstream GP Date Firm Rating Price Target Rating Price Target 20-Sep-18 Stifel Nicolaus Strong Buy $ 35.00 Buy $ 19.00 18-Sep-18 Janney Montgomery Scott Strong Buy 36.00 - - 14-Sep-18 Wells Fargo Strong Buy 38.00 Strong Buy 22.00 10-Sep-18 GS Buy 33.00 Buy 20.00 30-Aug-18 JPM Buy 35.00 Buy 22.00 29-Aug-18 Raymond James Strong Buy 38.00 Strong Buy 27.00 22-Aug-18 Scotia Howard Weil Buy 40.00 Hold 24.00 9-Aug-18 Ladenburg Thalmann Buy 40.00 Buy 24.00 3-Aug-18 MUFG Buy 40.00 Buy 26.00 1-Aug-18 Barclays Buy 33.00 Hold 23.00 16-Jul-18 Guggenheim Strong Buy 34.00 – – 19-Feb-18 Seaport Buy 37.00 Buy 26.00 – Tudor Pickering Buy 38.00 – 22.00 20-Aug-18 Baird¹ Buy $ 51.00 Buy 26.00 Source: Bloomberg, IBES and Wall Street research as of 5-Oct-2018. 1 Excluded as price target based on assumed exchange ratio and pro forma GP target price. Transaction Overview 13 High $ 40.00 $ 27.00 Mean 36.69 23.18 Median 37.00 23.00 Low 33.00 19.00
II. Financial Forecasts
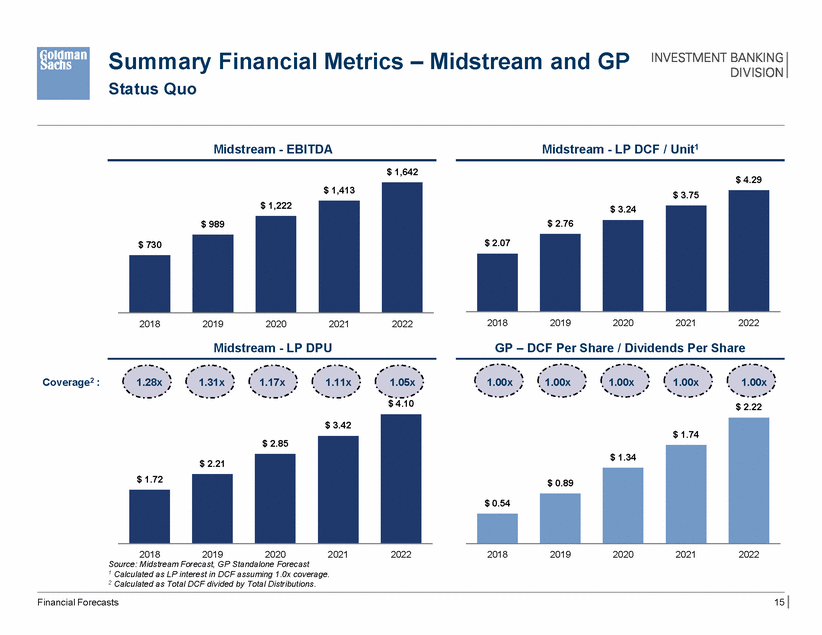
Summary Financial Metrics – Status Quo Midstream and GP Midstream - EBITDA Midstream - LP DCF / Unit1 $ 1,642 $ 4.29 2018 2019 2020 2021 2022 2018 2019 2020 2021 2022 Midstream - LP DPU GP – DCF Per Share / Dividends Per Share Coverage2 : 1.28x 1.31x 1.17x 1.11x 1.05x 1.00x 1.00x 1.00x 1.00x 1.00x $ 4.10 $ 2.22 2018 2019 2020 2021 2022 2018 2019 2020 2021 2022 Source: Midstream Forecast, GP Standalone Forecast 1 Calculated as LP interest in DCF assuming 1.0x coverage. 2 Calculated as Total DCF divided by Total Distributions. Financial Forecasts 15 $ 1.74 $ 1.34 $ 0.89 $ 0.54 $ 3.42 $ 2.85 $ 2.21 $ 1.72 $ 3.75 $ 3.24 $ 2.76 $ 2.07 $ 1,413 $ 1,222 $ 989 $ 730
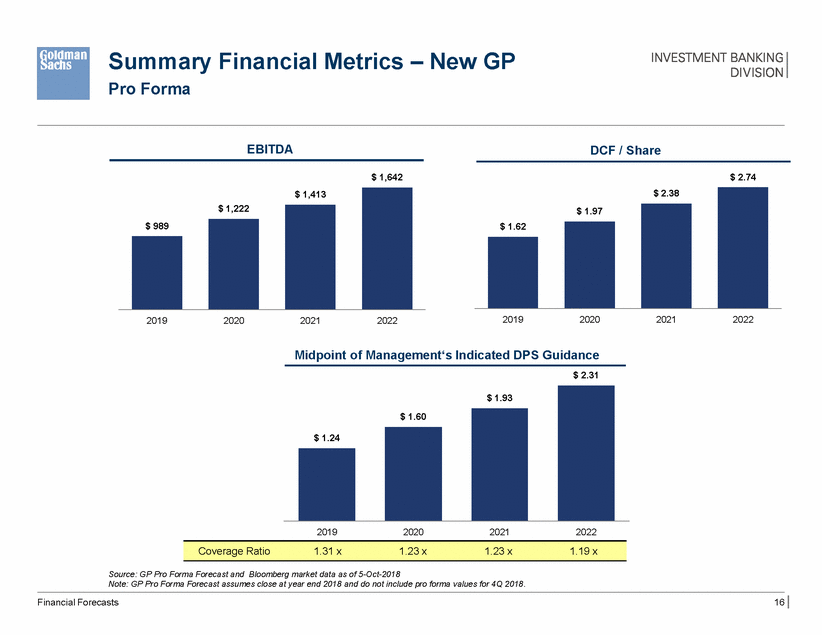
Summary Pro Forma Financial Metrics – New GP EBITDA DCF / Share $ 2.74 $ 1,642 2019 2020 2021 2022 2019 2020 2021 2022 Midpoint of Management‘s Indicated DPS Guidance $ 2.31 2019 2020 2021 2022 Source: GP Pro Forma Forecast and Bloomberg market data as of 5-Oct-2018 Note: GP Pro Forma Forecast assumes close at year end 2018 and do not include pro forma values for 4Q 2018. Financial Forecasts 16 Coverage Ratio 1.31 x1.23 x1.23 x1.19 x $ 1.93 $ 1.60 $ 1.24 $ 2.38 $ 1.97 $ 1.62 $ 1,413 $ 1,222 $ 989
III. Financial Analyses
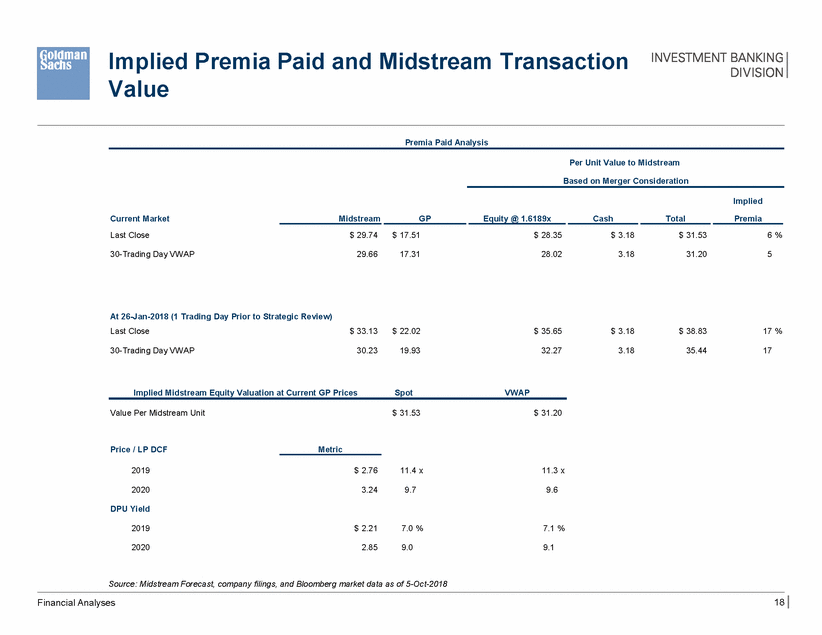
Implied Value Premia Paid and Midstream Transaction Premia Paid Analysis Per Unit Value to Midstream Based on Merger Consideration Implied Current Market Last Close Midstream GP Equity @ 1.6189x Cash Total Premia $ 29.74 $ 17.51 $ 28.35 $ 3.18 $ 31.53 6 % 30-Trading Day VWAP 29.66 17.31 28.02 3.18 31.20 5 At 26-Jan-2018 (1 Trading Day Prior to Strategic Review) Last Close $ 33.13 $ 22.02 $ 35.65 $ 3.18 $ 38.83 17 % 30-Trading Day VWAP 30.23 19.93 32.27 3.18 35.44 17 Implied Midstream Equity Valuation at Current GP Prices Spot VWAP Value Per Midstream Unit $ 31.53 $ 31.20 Price / LP DCF Metric 2019 $ 2.76 11.4 x 11.3 x 2020 3.24 9.7 9.6 DPU Yield 2019 $ 2.21 7.0 % 7.1 % 2020 2.85 9.0 9.1 Source: Midstream Forecast, company filings, and Bloomberg market data as of 5-Oct-2018 18 Financial Analyses
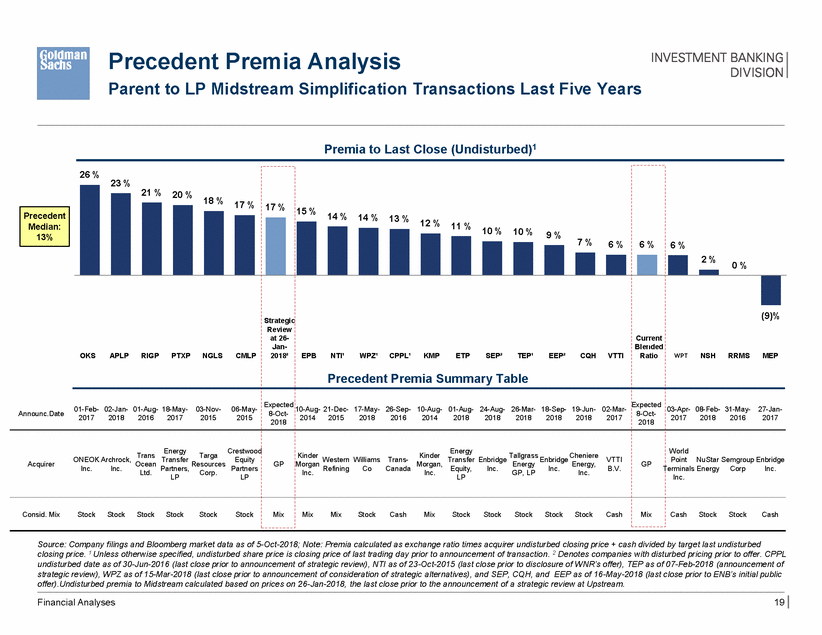
Precedent Premia Analysis Parent to LP Midstream Simplification Transactions Last Five Years Premia to Last Close (Undisturbed)1 23 % 21 % 20 % 18 % 17 % 12 % 11 % 10 % 10 % 9 % 7 % 6 % 20172018 2016 2017 Point NuStar Semgroup Enbridge Terminals EnergyCorp Inc. Source: Company filings and Bloomberg market data as of 5-Oct-2018; Note: Premia calculated as exchange ratio times acquirer undisturbed closing price + cash divided by target last undisturbed closing price. 1 Unless otherwise specified, undisturbed share price is closing price of last trading day prior to announcement of transaction. 2 Denotes companies with disturbed pricing prior to offer. CPPL undisturbed date as of 30-Jun-2016 (last close prior to announcement of strategic review), NTI as of 23-Oct-2015 (last close prior to disclosure of WNR’s offer), TEP as of 07-Feb-2018 (announcement of strategic review), WPZ as of 15-Mar-2018 (last close prior to announcement of consideration of strategic alternatives), and SEP, CQH, and EEP as of 16-May-2018 (last close prior to ENB’s initial public offer).Undisturbed premia to Midstream calculated based on prices on 26-Jan-2018, the last close prior to the announcement of a strategic review at Upstream. Financial Analyses 19 Announc.Date 26 % 17 % 15 % 14 % 14 % 13 % 6 % 6 % 2 %0 % OKSAPLPRIGPPTXPNGLSCMLP Strategic Review at 26-Jan-2018² EPBNTI¹WPZ¹CPPL¹KMPETPSEP²TEP¹EEP²CQHVTTI Precedent Premia Summary Table Current Blended Ratio (9)% WPTNSHRRMSMEP 01-Feb-02-Jan-01-Aug-18-May-03-Nov-06-May-201720182016201720152015 Expected 8-Oct-2018 10-Aug-21-Dec-17-May-26-Sep-10-Aug-01-Aug-24-Aug-26-Mar-18-Sep-19-Jun-02-Mar-20142015201820162014201820182018201820182017 Expected 8-Oct-2018 03-Apr-08-Feb-31-May-27-Jan-Trans EnergyTarga Crestwood AcquirerONEOK Archrock, Ocean Transfer Resources Equity Inc.Inc.Ltd. Partners, Corp.Partners LPLP GP KinderKinder EnergyTallgrassCheniere Morgan Western Williams Trans-Morgan, Transfer Enbridge Energy Enbridge Energy,VTTI Inc. RefiningCoCanadaInc.Equity,Inc.GP, LPInc.Inc.B.V. LP GP World Inc. Consid. MixStockStockStockStockStockStock Mix MixMixStockCashMixStockStockStockStockStockCash Mix CashStockStockCash Precedent Median: 13%
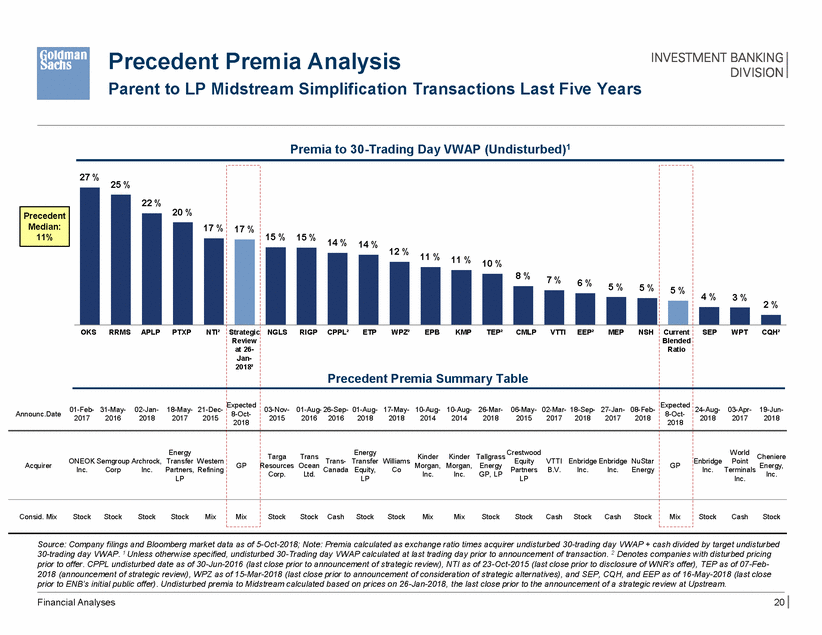
Precedent Premia Analysis Parent to LP Midstream Simplification Transactions Last Five Years Premia to 30-Trading Day VWAP (Undisturbed)1 25 % 20 % 12 % 11 % 11 % 5 % 5 % 2 % 2018 2017 2018 Enbridge Point Resources Ocean Canada Energy, Inc. Equity, Co Partners B.V. Inc. Inc. Energy Inc. Source: Company filings and Bloomberg market data as of 5-Oct-2018; Note: Premia calculated as exchange ratio times acquirer undisturbed 30-trading day VWAP + cash divided by target undisturbed 30-trading day VWAP. 1 Unless otherwise specified, undisturbed 30-Trading day VWAP calculated at last trading day prior to announcement of transaction. 2 Denotes companies with disturbed pricing prior to offer. CPPL undisturbed date as of 30-Jun-2016 (last close prior to announcement of strategic review), NTI as of 23-Oct-2015 (last close prior to disclosure of WNR’s offer), TEP as of 07-Feb-2018 (announcement of strategic review), WPZ as of 15-Mar-2018 (last close prior to announcement of consideration of strategic alternatives), and SEP, CQH, and EEP as of 16-May-2018 (last close prior to ENB’s initial public offer). Undisturbed premia to Midstream calculated based on prices on 26-Jan-2018, the last close prior to the announcement of a strategic review at Upstream. Financial Analyses 20 Announc.Date 0 27 % 17 % 15 % 15 % 14 % 14 % 5 % 4 %3 % 22 % 17 % 10 % 8 %7 %6 % OKSRRMSAPLPPTXPNTI² Strategic Review at 26-Jan-2018² NGLSRIGP CPPL²ETPWPZ²EPBKMPTEP²CMLPVTTIEEP²MEPNSH Precedent Premia Summary Table Current Blended Ratio SEPWPTCQH² 1-Feb-31-May-02-Jan-18-May-21-Dec-20172016201820172015 Expected 8-Oct-2018 03-Nov-01-Aug-26-Sep-01-Aug-17-May-10-Aug-10-Aug-26-Mar-06-May-02-Mar-18-Sep-27-Jan-08-Feb-2015201620162018201820142014201820152017201820172018 Expected 8-Oct-2018 24-Aug-03-Apr-19-Jun-Energy AcquirerONEOK Semgroup Archrock, Transfer Western Inc.CorpInc.Partners, Refining LP GP TargaTransEnergyKinderKinder Tallgrass Crestwood Trans-Transfer Williams Morgan, Morgan, EnergyEquityVTTI Enbridge Enbridge NuStar Corp.Ltd.LPInc.Inc.GP, LPLP GP World Cheniere Inc.Terminals Consid. MixStockStockStockStockMix Mix StockStock CashStockStockMixMixStockStockCashStockCashStock Mix StockCashStock Precedent Median: 11%
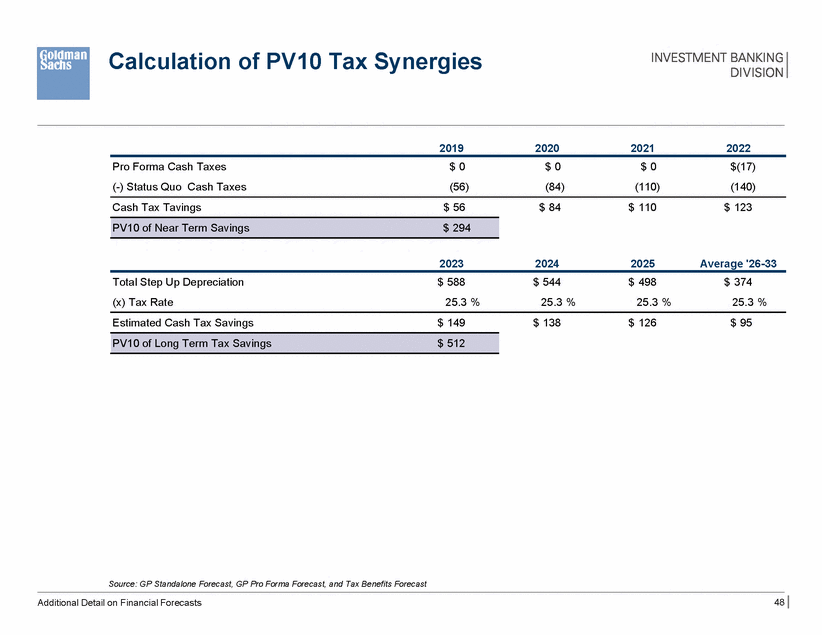
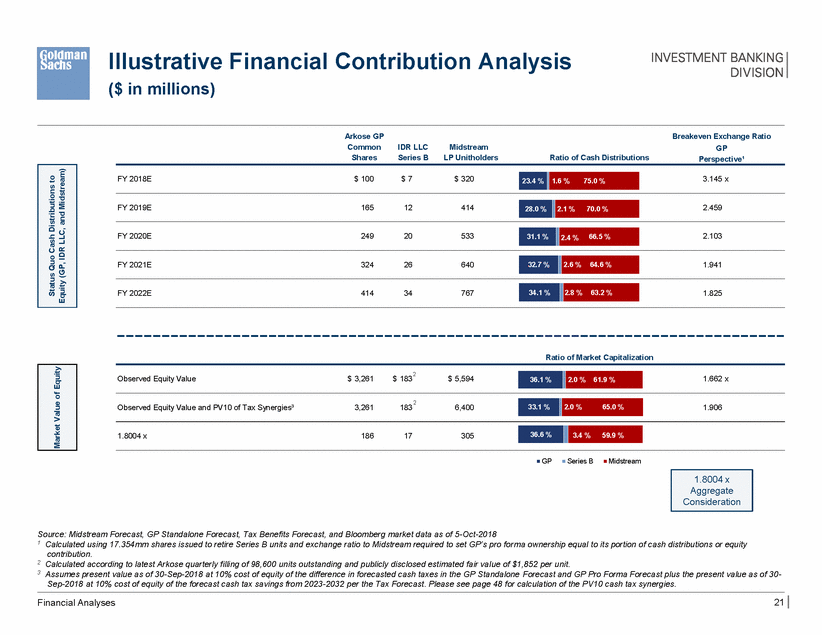
Illustrative ($ in millions) Financial Contribution Analysis Arkose GP Common Shares Breakeven Exchange Ratio GP Perspective¹ IDR LLC Series B Midstream LP Unitholders Ratio of Cash Distributions FY 2018E $ 100 $ 7 $ 320 3.145 x FY 2019E 165 12 414 2.459 FY 2020E 249 20 533 2.103 FY 2021E 324 26 640 1.941 FY 2022E 414 34 767 1.825 Ratio of Market Capitalization 2 Observed Equity Value $ 3,261 $ 183 $ 5,594 1.662 x 2 Observed Equity Value and PV10 of Tax Synergies³ 3,261 183 6,400 1.906 1.8004 x 186 17 305 GP Series B Midstream Source: Midstream Forecast, GP Standalone Forecast, Tax Benefits Forecast, and Bloomberg market data as of 5-Oct-2018 1 Calculated using 17.354mm shares issued to retire Series B units and exchange ratio to Midstream required to set GP’s pro forma ownership equal to its portion of cash distributions or equity contribution. 2 Calculated according to latest Arkose quarterly filling of 98,600 units outstanding and publicly disclosed estimated fair value of $1,852 per unit. 3 Assumes present value as of 30-Sep-2018 at 10% cost of equity of the difference in forecasted cash taxes in the GP Standalone Forecast and GP Pro Forma Forecast plus the present value as of 30-Sep-2018 at 10% cost of equity of the forecast cash tax savings from 2023-2032 per the Tax Forecast. Please see page 48 for calculation of the PV10 cash tax synergies. 21 Financial Analyses 1.8004 x Aggregate Consideration 36.6 % 3.4 % 59.9 % 33.1 % 2.0 % 65.0 % 36.1 % 2.0 % 61.9 % Market Value of Equity 34.1 % 2.8 % 63.2 % 32.7 % 2.6 % 64.6 % 31.1 % 2.4 % 66.5 % 28.0 % 2.1 % 70.0 % 23.4 % 1.6 % 75.0 % Status Quo Cash Distributions to Equity (GP, IDR LLC, and Midstream)
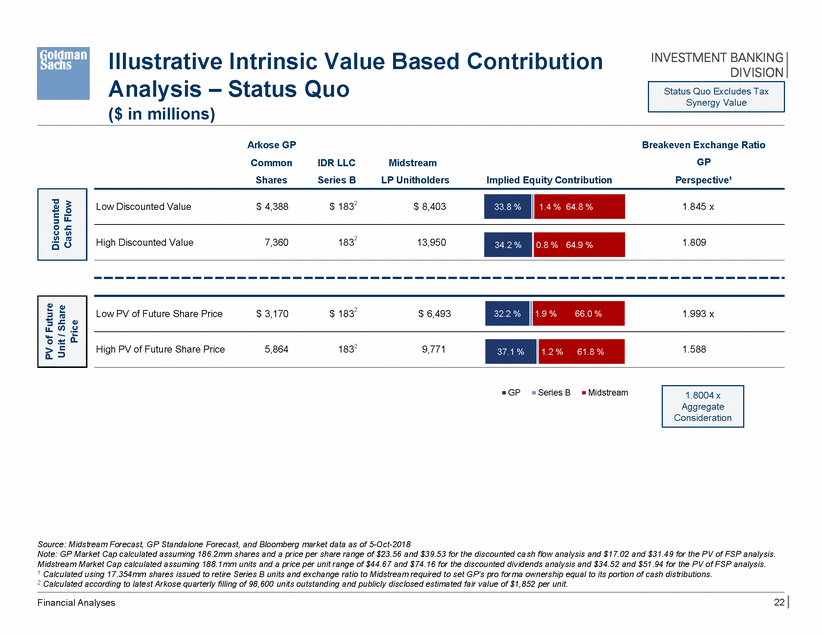
Illustrative Analysis – ($ in millions) Intrinsic Value Based Contribution Status Quo Arkose GP Common Shares Breakeven Exchange Ratio GP Perspective¹ IDR LLC Series B Midstream LP Unitholders Implied Equity Contribution $ 1832 Low Discounted Value $ 4,388 $ 8,403 1.845 x $ 1832 Low PV of Future Share Price $ 3,170 $ 6,493 1.993 x 1832 High PV of Future Share Price 5,864 9,771 1.588 GP Series B Midstream Source: Midstream Forecast, GP Standalone Forecast, and Bloomberg market data as of 5-Oct-2018 Note: GP Market Cap calculated assuming 186.2mm shares and a price per share range of $23.56 and $39.53 for the discounted cash flow analysis and $17.02 and $31.49 for the PV of FSP analysis. Midstream Market Cap calculated assuming 188.1mm units and a price per unit range of $44.67 and $74.16 for the discounted dividends analysis and $34.52 and $51.94 for the PV of FSP analysis. 1 Calculated using 17.354mm shares issued to retire Series B units and exchange ratio to Midstream required to set GP’s pro forma ownership equal to its portion of cash distributions. 2 Calculated according to latest Arkose quarterly filling of 98,600 units outstanding and publicly disclosed estimated fair value of $1,852 per unit. 22 Financial Analyses Unit / Share 1.8004 x Aggregate Consideration 37.1 % 1.2 % 61.8 % 32.2 % 1.9 % 66.0 % PV of Future Price High Discounted Value 7,360 1832 13,950 34.2 % 0.8 % 64.9 % 1.809 33.8 % 1.4 % 64.8 % Discounted Cash Flow Status Quo Excludes Tax Synergy Value
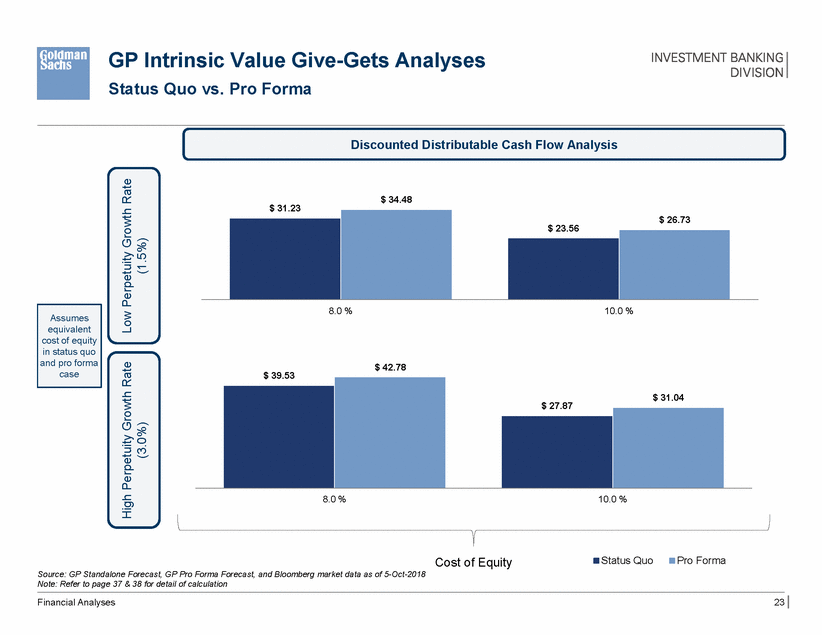
GP Intrinsic Value Give-Gets Analyses Status Quo vs. Pro Forma Discounted Distributable Cash Flow Analysis $ 34.48 $ 31.23 $ 23.56 8.0 % 10.0 % $ 42.78 $ 39.53 $ 27.87 8.0 % 10.0 % Status Quo Pro Forma Cost of Equity Source: GP Standalone Forecast, GP Pro Forma Forecast, and Bloomberg market data as of 5-Oct-2018 Note: Refer to page 37 & 38 for detail of calculation Financial Analyses 23 High Perpetuity Growth Rate (3.0%) Low Perpetuity Growth Rate (1.5%) $ 31.04 Assumes equivalent cost of equity in status quo and pro forma case $ 26.73
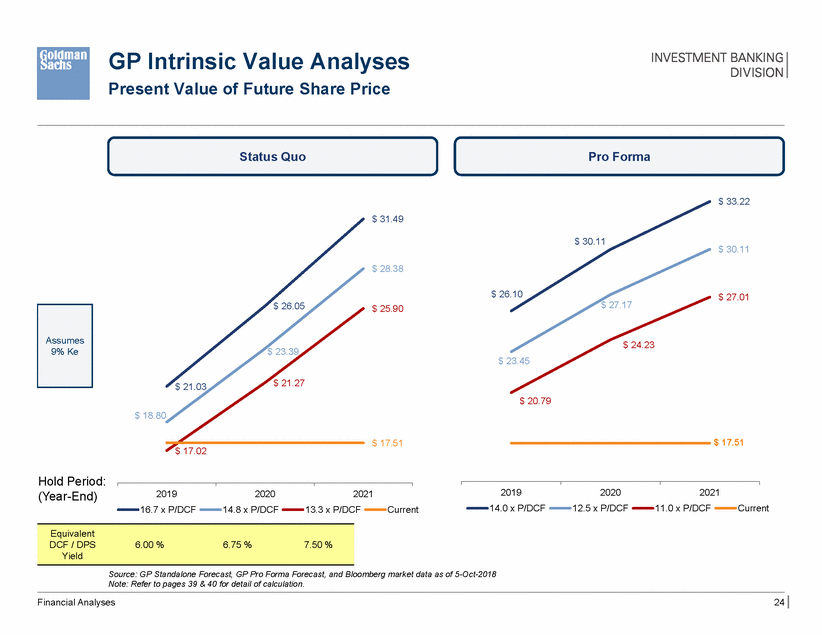
GP Intrinsic Value Analyses Present Value of Future Share Price Status Quo Pro Forma $ 33.22 $ 31.49 $ 30.11 $ 30.11 $ 28.38 $ 26.10 $ 27.01 $ 27.17 $ 26.05 $ 25.90 $ 24.23 $ 23.39 $ 23.45 $ 21.27 $ 21.03 $ 20.79 $ 18.80 $ 17.51 $ 17.51 $ 17.02 Hold Period: (Year-End) 2019 14.0 x P/DCF 2020 12.5 x P/DCF 2021 2019 16.7 x P/DCF 2020 14.8 x P/DCF 2021 11.0 x P/DCF Current 13.3 x P/DCF Current Source: GP Standalone Forecast, GP Pro Forma Forecast, and Bloomberg market data as of 5-Oct-2018 Note: Refer to pages 39 & 40 for detail of calculation. Financial Analyses 24 Equivalent DCF / DPS6.00 %6.75 %7.50 % Yield Assumes 9% Ke
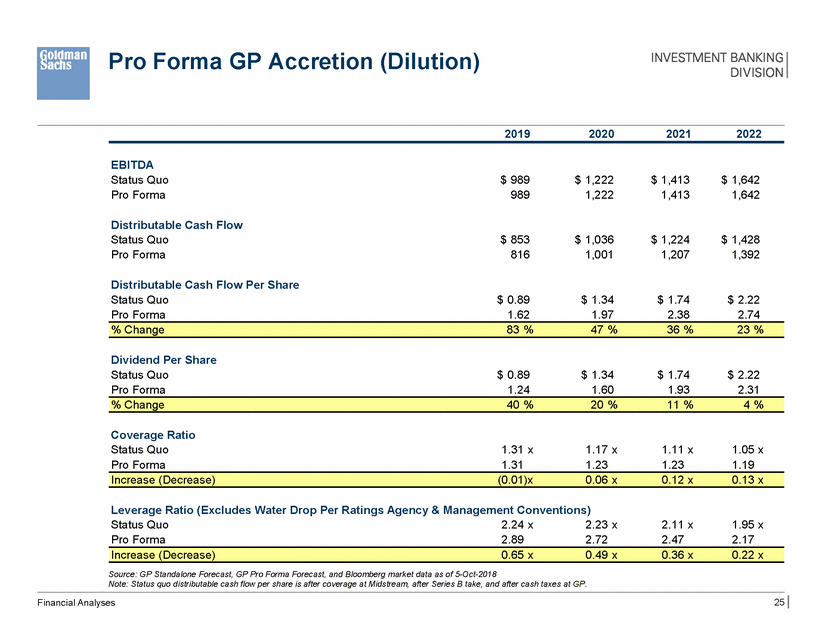
Pro Forma GP Accretion (Dilution) 2019 2020 2021 2022 EBITDA Status Quo Pro Forma $ 989 989 $ 1,222 1,222 $ 1,413 1,413 $ 1,642 1,642 Distributable Cash Flow Status Quo Pro Forma $ 853 816 $ 1,036 1,001 $ 1,224 1,207 $ 1,428 1,392 Distributable Cash Flow Per Share Status Quo Pro Forma $ 0.89 1.62 $ 1.34 1.97 $ 1.74 2.38 $ 2.22 2.74 Dividend Per Share Status Quo Pro Forma $ 0.89 1.24 $ 1.34 1.60 $ 1.74 1.93 $ 2.22 2.31 Coverage Ratio Status Quo Pro Forma 1.31 x 1.31 1.17 x 1.23 1.11 x 1.23 1.05 x 1.19 Leverage Ratio (Excludes Water Drop Per Ratings Agency & Management Conventions) Status Quo Pro Forma 2.24 x 2.89 2.23 x 2.72 2.11 x 2.47 1.95 x 2.17 Source: GP Standalone Forecast, GP Pro Forma Forecast, and Bloomberg market data as of 5-Oct-2018 Note: Status quo distributable cash flow per share is after coverage at Midstream, after Series B take, and after cash taxes at GP. 25 Financial Analyses Increase (Decrease)0.65 x0.49 x0.36 x0.22 x Increase (Decrease)(0.01)x0.06 x0.12 x0.13 x % Change40 %20 %11 %4 % % Change83 %47 %36 %23 %
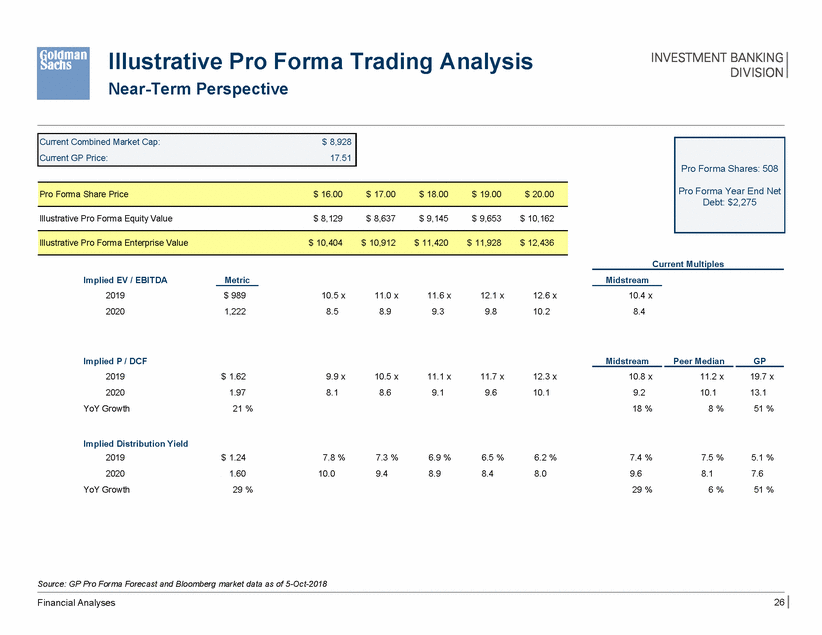
Illustrative Pro Forma Near-Term Perspective Trading Analysis Illustrative Pro Forma Equity Value $ 8,129 $ 8,637 $ 9,145 $ 9,653 $ 10,162 Current Multiples Implied EV / EBITDA 2019 2020 Metric Midstream $ 989 1,222 10.5 x 8.5 11.0 x 8.9 11.6 x 9.3 12.1 x 9.8 12.6 x 10.2 10.4 x 8.4 Implied P / DCF 2019 2020 YoY Growth Midstream Peer Median GP $ 1.62 1.97 21 % 9.9 x 8.1 10.5 x 8.6 11.1 x 9.1 11.7 x 9.6 12.3 x 10.1 10.8 x 9.2 18 % 11.2 x 10.1 8 % 19.7 x 13.1 51 % Implied Distribution Yield 2019 2020 YoY Growth $ 1.24 1.60 29 % 7.8 % 10.0 7.3 % 9.4 6.9 % 8.9 6.5 % 8.4 6.2 % 8.0 7.4 % 9.6 29 % 7.5 % 8.1 6 % 5.1 % 7.6 51 % Source: GP Pro Forma Forecast and Bloomberg market data as of 5-Oct-2018 26 Financial Analyses Illustrative Pro Forma Enterprise Value $ 10,404 $ 10,912 $ 11,420 $ 11,928 $ 12,436 Pro Forma Share Price $ 16.00 $ 17.00 $ 18.00 $ 19.00 $ 20.00 Pro Forma Shares: 508 Pro Forma Year End Net Debt: $2,275 Current Combined Market Cap: $ 8,928 Current GP Price: 17.51
Appendix A: Cost of Capital Materials
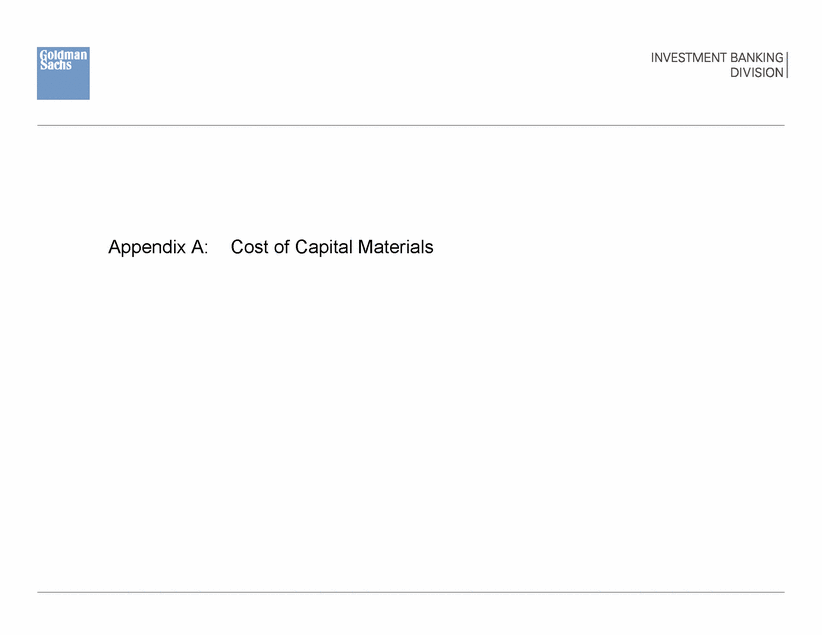
Illustrative Cost of Equity Midstream and GP Analysis Midpoint of Cost of Equity Range Cost of Equity Sensitivity Analysis Risk Free Rate 3.2 % Risk Free Rate 3.2 % Midpoint of Beta Range 1.10 0.90 0.95 1.00 1.05 1.10 1.15 1.20 1.25 1.30 Equity Risk Premium 5.4 % GP vs. MLP Historical Beta Comparison Implied Arkose GP Beta GP / MLP GP Beta MLP Beta ENLC / ENLK EQGP / EQM WGP / WES 0.85 0.87 0.81 1.02 0.96 0.98 (0.17) (0.09) (0.17) 1.04 1.11 1.03 Source: Company filings and press releases, Axioma Historical Betas, Duff and Phelps, and Bloomberg market data as of 5-Oct-2018 Note: Two year historical Levered Beta per Axioma. Risk Free Rate represents yield of 30-year U.S. Government Treasury Notes with 20 years remaining life. Equity Risk Premium per Duff & Phelps. Midpoint of beta range calculated as the median between the low Midstream peer median and 1.3x, based on the approximate 75th percentile of Midstream’s historical beta range. Implied Arkose GP beta calculated as midstream beta minus the delta in the peer family beta. Cost of Capital Materials 28 Midstream Peer Median0.90 High1.11 Low1.03 Cost of Equity9.2 % 8.1 % 8.4 8.6 8.9 9.2 9.4 9.7 10.0 10.2 Equity Beta
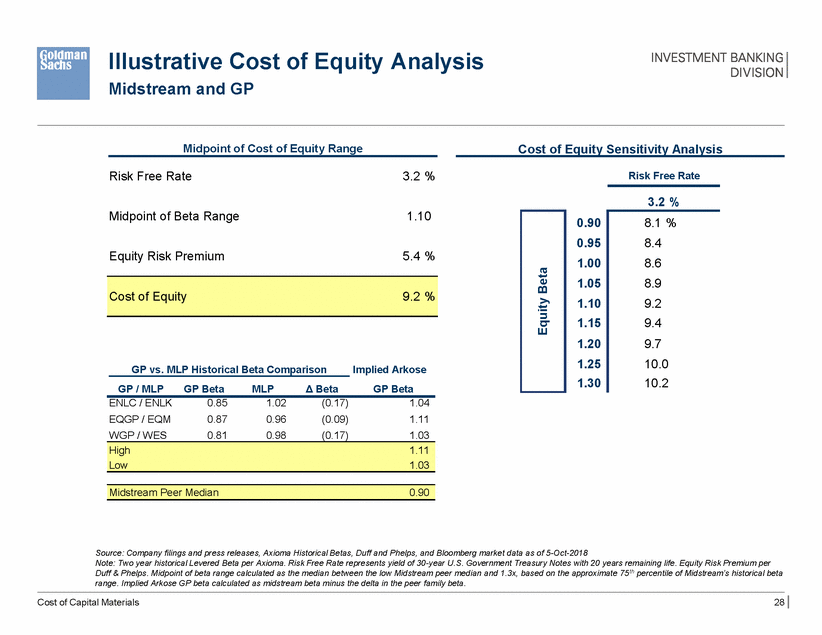
Midstream Historical Last Two Years & Predicted Beta 23-Feb-2018 (Before Market 29-Jan-2018 (Before 1.61 1.47 Midstream: 1.27 1.33 1.20 1.19 1.05 0.91 0.90 0.77 Oct-2016 Feb-2017 Jun-2017 Oct-2017 Feb-2018 Predicted Beta Jun-2018 Oct-2018 Historical Beta Source: Axioma as of 5-Oct-2018 29 Cost of Capital Materials Beta Market Open) StrategicOpen) Special Committee Review Announced: 1.54Formation: 1.44 6-Jun-2018 First Proposal to Summary Statistics (Historical Beta) Last 2 Years 25th Percentile 1.16 x Median 1.19 75th Percentile 1.25 Last Twelve Months 25th Percentile 1.19 x Median 1.23 75th Percentile 1.27
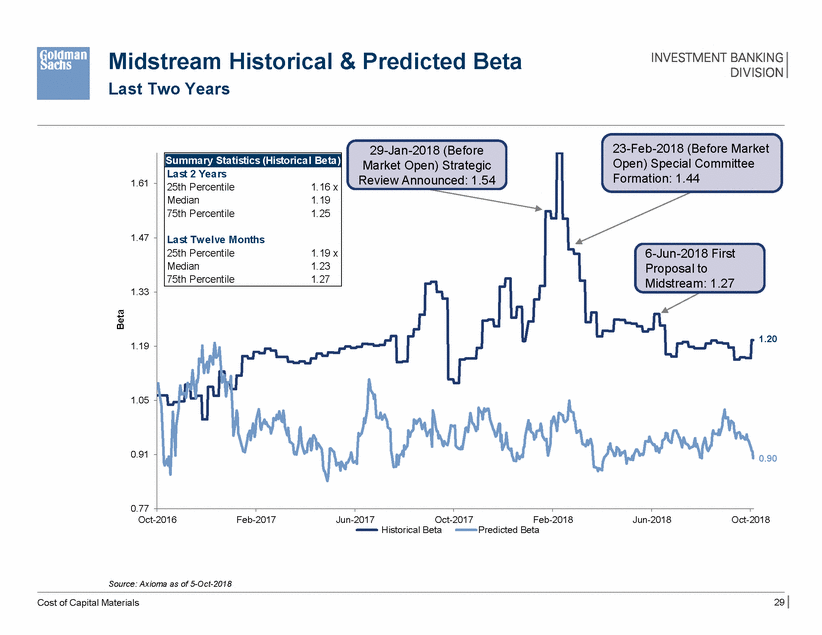
Public Company Beta Calculations Midstream and GP Comparable Companies Company Historical Equity Beta Predicted Beta Basic Shares Share Price Basic Market Cap Debt Cash Debt / Cap Cash / Cap Selected Comparable Companies CNXM CEQP DCP ENBL ENLK EQM HESM NBLX SHLX TRGP WES 0.94 0.79 0.80 0.76 1.02 0.96 0.90 0.90 0.95 0.69 0.98 0.72 0.86 0.93 0.93 0.99 0.91 0.81 0.99 0.85 0.85 1.00 64 71 150 433 350 120 55 40 224 226 153 $ 19.92 37.74 42.69 17.23 18.68 52.67 22.88 40.36 21.90 58.51 45.80 $ 1,268 2,688 6,412 7,462 6,544 6,344 1,249 1,601 4,901 13,197 6,990 $ 404 1,562 4,835 3,707 3,990 3,454 0 530 2,115 5,694 4,177 $ 1 6 4 7 37 684 57 16 175 220 52 24.2 % 36.8 43.0 33.2 38.0 37.9 0.0 25.1 30.9 30.5 37.6 0.0 % 0.1 0.0 0.1 0.3 7.5 4.7 0.8 2.6 1.2 0.5 Company Historical Equity Beta Predicted Beta Basic Shares Share Price Basic Market Cap Debt Cash Debt / Cap Cash / Cap Selected Comparable Companies ENLC EQGP WGP 0.85 0.87 0.81 0.91 0.79 0.89 181 302 219 $ 17.16 21.28 32.46 $ 3,107 6,436 7,107 $ 84 0 26 $ 0 0 3 2.6 % 0.0 0.4 0.0 % 0.0 0.0 Source: Axioma, company filings, and Bloomberg market data as of 5-Oct-2018 30 Cost of Capital Materials High0.870.91$ 7,107$ 84$ 32.6 %0.0 % Mean0.840.865,5503711.00.0 Median0.850.896,4362600.40.0 Low0.810.793,107000.00.0 GP--186$ 17.51$ 3,260$(2)$ 2(0.1)%0.1 % High1.021.00$ 13,197$ 5,694$ 68443.0 %7.5 % Mean0.880.895,3322,770 11430.71.6 Median0.900.916,3443,4543733.20.5 Low0.690.721,249010.00.0 Midstream1.200.90187$ 29.74$ 5,563$ 1,420$ 2020.4 %0.3 %
Appendix B: Additional Valuation Reference Materials
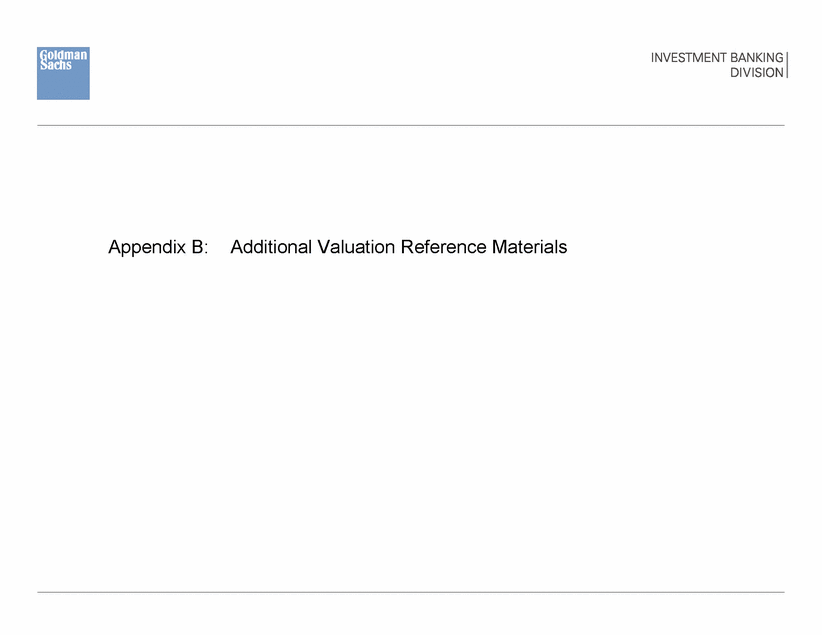
Determining Arkose’s Overall Status Quo Yield ($ in millions, except per share / unit data) Calculation of Combined Equity Value Calculation of Multiples and Yield 2019 2020 Midstream Units (+) Midstream LTIP 187.0 1.1 Midstream Unit Price (/) LP DCF $ 29.74 2.76 $ 29.74 3.24 Midstream Diluted Units Outstanding (x) Midstream Unit Price 188.1 $ 29.74 Midstream LP DPU (/) Midstream Unit Price $ 2.21 29.74 $ 2.85 29.74 GP Shares (+) Series B Converted Shares¹ 186.2 4.2 GP Diluted Share Count (x) GP Share Price 190.4 $ 17.51 GP DPS (/) GP Share Price $ 0.89 17.51 $ 1.34 17.51 19-20 Average Yield 6.4 % Distributable Cash Flow² Distributed Cash³ $ 797 591 $ 952 802 Net Debt (Excl. Water Drop Down Liability)4 $ 1,392 EBITDA $ 989 $ 1,222 Source: Midstream Forecast, GP Standalone Forecast, and Bloomberg market data as of 5-Oct-2018 1 Based on 20-day VWAP. 2 Based on total DCF at Midstream, excluding taxes at GP. 3 Based on distributions to LPs at Midstream, distributions to Series B unitholders, and dividends to GP shareholders. 4 As of 2Q18 10-Q (30-Jun-2018). Additional Valuation Reference Materials 32 EV/EBITDA10.4 x8.4 x Implied Equity Value / Total DCF11.2 x9.4 x Implied Distribution Yield6.6 %9.0 % Enterprise Value$ 10,320 Arkose Combined Market Cap$ 8,928 Implied Yield5.1 %7.6 % GP Diluted Equity Value$ 3,334 Implied Yield7.4 %9.6 % Midstream Diluted Equity Value$ 5,594 Midstream P/LP DCF10.8 x9.2 x
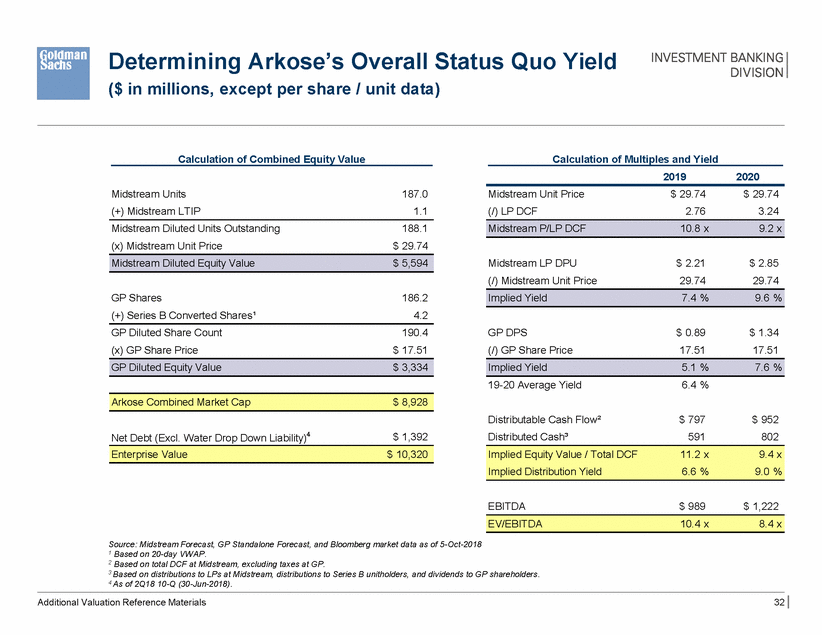
Public Company Trading Midstream Comparable Companies ($ in millions, except per share / unit values) 19E-20E DCF YoY Growth 19E-20E DPU YoY Growth Price / LP DCF DPU Yield Total Debt / 2018E EBITDA Company 2019E 2020E 2019E 2020E CNX Midstream Crestwood DCP Midstream Enable Midstream EnLink Midstream EQT Midstream Hess Midstream Noble Midstream Shell Midstream Targa Resources Western Gas 11.2 x 11.2 10.7 10.9 11.4 9.0 12.3 9.1 14.3 12.9 10.2 10.0 x 10.9 10.1 10.1 11.1 7.8 10.7 8.0 13.1 10.6 9.9 12 % 3 7 7 3 NA² 15 15 9 22 3 7.9 % 6.6 7.3 7.5 8.4 9.6 7.1 6.5 7.8 6.2 8.9 9 % 7 8 8 9 11 8 8 8 6 9 15 % 6 3 2 2 15 15 20 8 0 5 2.5 x 3.7 4.3 3.5 3.9 3.4 0.0 2.4 3.5 4.3 3.5 Sources: IBES, latest publicly available financial statements, and Bloomberg market data as of 5-Oct-2018. Projected EBITDA and DPS are based on IBES median estimates; projected LP DCF calculated based on median of brokers who provide LP DCF and/or total DCF and LP units outstanding. All research estimates have been calendarized to December. 1 Source: Midstream Forecast, latest publicly available financial statements, IBES/Wall Street research, and Bloomberg market data as of 5-Oct-2018, Projected EBITDA, LP DCF, and DPS are based on Midstream Forecast; IBES case follows the same methodology as peers. 2 NA due to lack of broker consensus for status quo and pro forma. Additional Valuation Reference Materials 33 High Valuation 14.3 x 13.1 x 22 % 6.2 % 6.5 % 20 % 4.3 x Mean 11.2 10.2 10 7.6 8.3 8 3.2 Median 11.2 10.1 8 7.5 8.1 6 3.5 Low Valuation 9.0 7.8 3 9.6 11.0 0 0.0 Arkose Midstream¹ (Management) 10.8 x 9.2 x 20 % 7.4 % 9.6 % 29 % 1.9 x
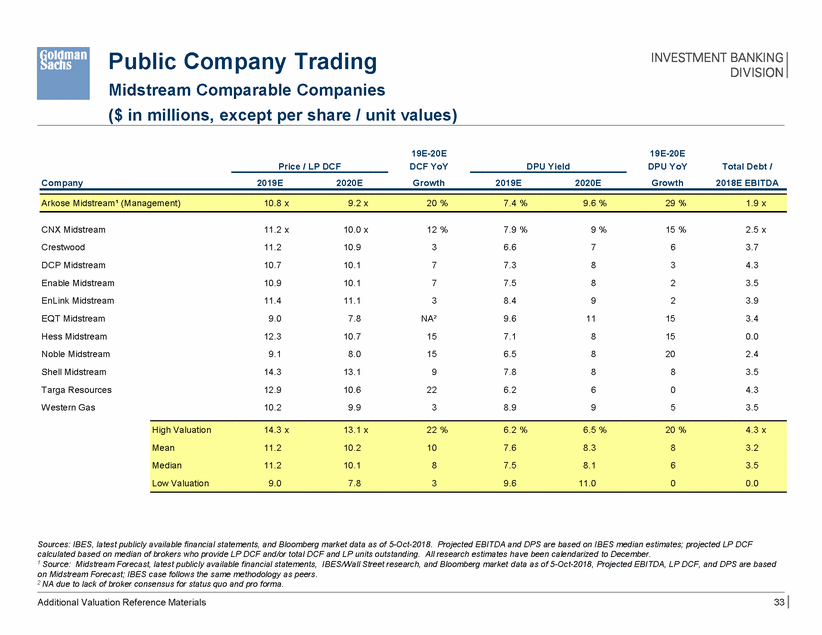
Illustrative Arkose Midstream Discounted Dividends Analysis Status Quo Midstream | ($ in millions, except per share data) Assumptions Illustrative Discounted Cash Flow Implied value as of 9/30/2018 Status Quo DDM 4Q 2018 2019 2020 2021 2022 Terminal¹ Dividends Received Perpetuity Growth Rate Implied Terminal Value Implied NTM Yield at Y.E. 2022 Total Cash Flows $ 0.47 $ 2.21 $ 2.85 $ 3.42 $ 4.10 $ 4.10 2.0 % $ 59.74 6.9 % $ 59.74 Discounted using mid-year convention Perpetuity growth rate of 2.0% $ 0.47 $ 2.21 $ 2.85 $ 3.42 $ 4.10 Ke of 9.0% Discount Period¹ Discount Rate Discount Factor 0.25 9.0 % 0.98 0.75 1.75 2.75 3.75 3.75 0.94 0.86 0.79 0.72 0.72 Present Value of Cash Flows $0.46 $2.07 $2.45 $2.70 $2.97 $43.25 1.5 % 2.0 % 2.5 % 3.0 % 1.5 % 2.0 % 2.5 % 3.0 % 8.0 % 8.5 9.0 9.5 10.0 Source: Midstream Forecast and Bloomberg market data as of 5-Oct-2018 1 Q4 2018 dividend valued at year end 2018; all others based on mid-year convention. Additional Valuation Reference Materials 34 6.4 % 5.9 % 5.4 % 4.9 % 6.9 6.4 5.9 5.4 7.3 6.9 6.4 5.9 7.8 7.3 6.9 6.4 8.3 7.8 7.3 6.9 $ 58.85 $ 63.10 $ 68.13 $ 74.16 54.54 58.14 62.34 67.31 50.81 53.89 57.45 61.60 47.55 50.21 53.26 56.77 44.67 46.99 49.62 52.63 Cost of Equity Implied Terminal Yield Perpetuity Growth Rate Implied Per Unit Value of Status Quo Midstream $ 53.89
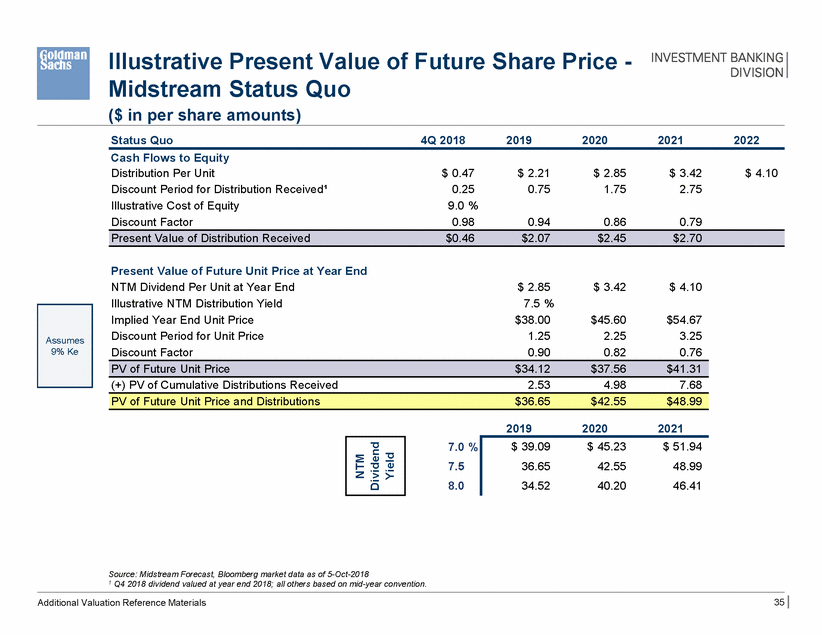
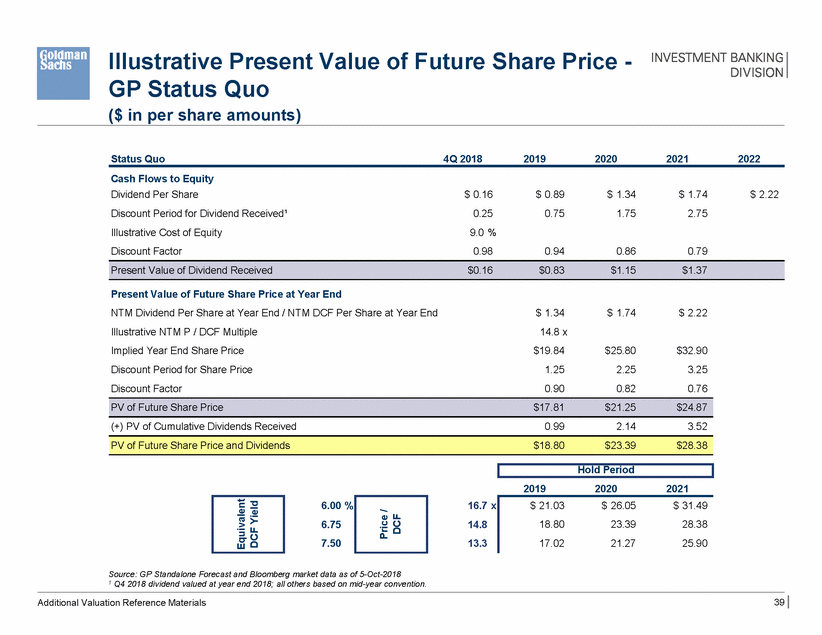
Illustrative Present Value of Future Share Price - Midstream Status Quo ($ in per share amounts) Status Quo 4Q 2018 2019 2020 2021 2022 Cash Flows to Equity Distribution Per Unit Discount Period for Distribution Received¹ Illustrative Cost of Equity Discount Factor $ 0.47 0.25 9.0 % 0.98 $ 2.21 0.75 $ 2.85 1.75 $ 3.42 2.75 $ 4.10 0.94 0.86 0.79 Present Value of Future Unit Price at Year End NTM Dividend Per Unit at Year End Illustrative NTM Distribution Yield Implied Year End Unit Price Discount Period for Unit Price Discount Factor $ 2.85 7.5 % $38.00 1.25 0.90 $ 3.42 $ 4.10 $45.60 2.25 0.82 $54.67 3.25 0.76 (+) PV of Cumulative Distributions Received 2.53 4.98 7.68 2019 2020 2021 7.0 % 7.5 8.0 Source: Midstream Forecast, Bloomberg market data as of 5-Oct-2018 1 Q4 2018 dividend valued at year end 2018; all others based on mid-year convention. 35 Additional Valuation Reference Materials $ 39.09 $ 45.23 $ 51.94 36.65 42.55 48.99 34.52 40.20 46.41 NTM Dividend Yield PV of Future Unit Price and Distributions $36.65 $42.55 $48.99 PV of Future Unit Price $34.12 $37.56 $41.31 Assumes 9% Ke Present Value of Distribution Received $0.46 $2.07 $2.45 $2.70
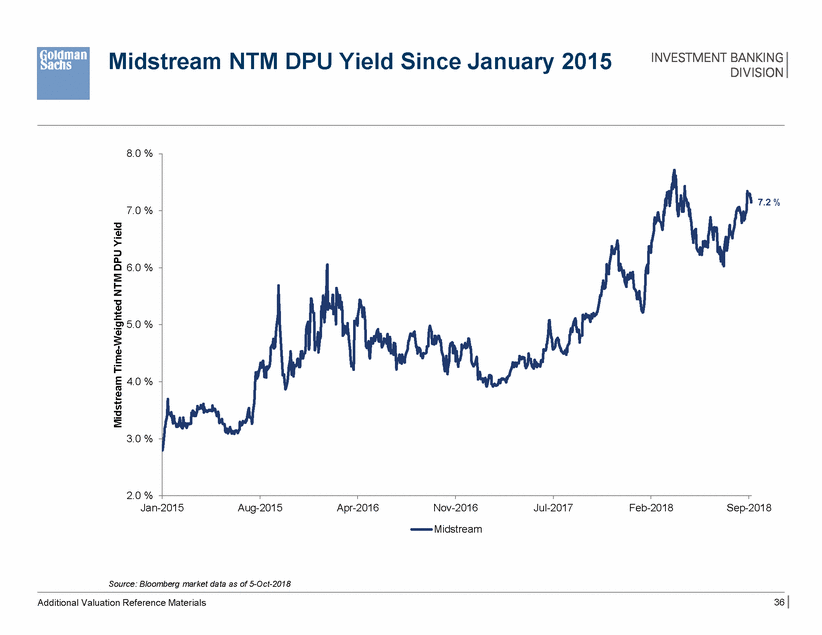
Midstream NTM DPU Yield Since January 2015 8.0 % 7.2 % 7.0 % 6.0 % 5.0 % 4.0 % 3.0 % 2.0 % Jan-2015 Aug-2015 Apr-2016 Nov-2016 Midstream Jul-2017 Feb-2018 Sep-2018 Source: Bloomberg market data as of 5-Oct-2018 36 Additional Valuation Reference Materials Midstream Time-Weighted NTM DPU Yield
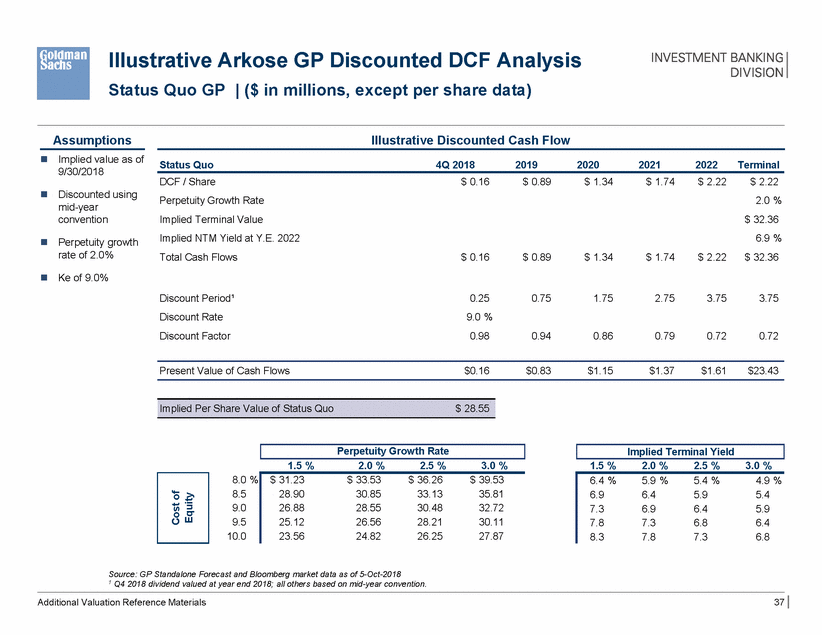
Illustrative Arkose GP Discounted DCF Analysis Status Quo GP | ($ in millions, except per share data) Assumptions Illustrative Discounted Cash Flow Implied value as of 9/30/2018 Status Quo 4Q 2018 2019 2020 2021 2022 Terminal DCF / Share Perpetuity Growth Rate Implied Terminal Value Implied NTM Yield at Y.E. 2022 Total Cash Flows $ 0.16 $ 0.89 $ 1.34 $ 1.74 $ 2.22 $ 2.22 2.0 % $ 32.36 6.9 % $ 32.36 Discounted using mid-year convention Perpetuity growth rate of 2.0% $ 0.16 $ 0.89 $ 1.34 $ 1.74 $ 2.22 Ke of 9.0% Discount Period¹ Discount Rate Discount Factor 0.25 9.0 % 0.98 0.75 1.75 2.75 3.75 3.75 0.94 0.86 0.79 0.72 0.72 Present Value of Cash Flows $0.16 $0.83 $1.15 $1.37 $1.61 $23.43 1.5 % 2.0 % 2.5 % 3.0 % 1.5 % 2.0 % 2.5 % 3.0 % 8.0 % 8.5 9.0 9.5 10.0 Source: GP Standalone Forecast and Bloomberg market data as of 5-Oct-2018 1 Q4 2018 dividend valued at year end 2018; all others based on mid-year convention. Additional Valuation Reference Materials 37 6.4 % 5.9 % 5.4 % 4.9 % 6.9 6.4 5.9 5.4 7.3 6.9 6.4 5.9 7.8 7.3 6.8 6.4 8.3 7.8 7.3 6.8 $ 31.23 $ 33.53 $ 36.26 $ 39.53 28.90 30.85 33.13 35.81 26.88 28.55 30.48 32.72 25.12 26.56 28.21 30.11 23.56 24.82 26.25 27.87 Cost of Equity Implied Terminal Yield Perpetuity Growth Rate Implied Per Share Value of Status Quo $ 28.55
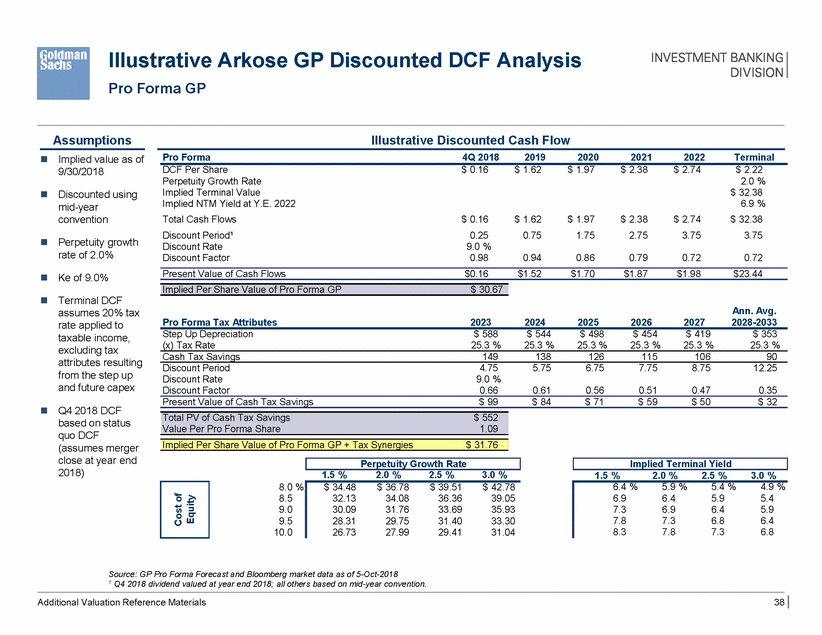
Illustrative Pro Forma GP Arkose GP Discounted DCF Analysis Assumptions Illustrative Discounted Cash Flow Pro Forma 4Q 2018 2019 2020 2021 2022 Terminal Implied value as of 9/30/2018 DCF Per Share Perpetuity Growth Rate Implied Terminal Value Implied NTM Yield at Y.E. 2022 Total Cash Flows Discount Period¹ Discount Rate Discount Factor $ 0.16 $ 1.62 $ 1.97 $ 2.38 $ 2.74 $ 2.22 2.0 % $ 32.38 6.9 % $ 32.38 3.75 Discounted using mid-year convention $ 0.16 0.25 9.0 % 0.98 $ 1.62 0.75 $ 1.97 1.75 $ 2.38 2.75 $ 2.74 3.75 Perpetuity growth rate of 2.0% 0.94 0.86 0.79 0.72 0.72 Present Value of Cash Flows $0.16 $1.52 $1.70 $1.87 $1.98 $23.44 Ke of 9.0% Terminal DCF assumes 20% tax rate applied to taxable income, excluding tax attributes resulting from the step up and future capex Ann. Avg. Pro Forma Tax Attributes 2023 2024 2025 2026 2027 2028-2033 Step Up Depreciation (x) Tax Rate $ 588 25.3 % $ 544 25.3 % $ 498 25.3 % $ 454 25.3 % $ 419 25.3 % $ 353 25.3 % Cash Tax Savings 149 138 126 115 106 90 Discount Period Discount Rate Discount Factor 4.75 9.0 % 0.66 5.75 6.75 7.75 8.75 12.25 0.61 0.56 0.51 0.47 0.35 Present Value of Cash Tax Savings $ 99 $ 84 $ 71 $ 59 $ 50 $ 32 Q4 2018 DCF based on status quo DCF (assumes merger close at year end 2018) 1.5 % 2.0 % 2.5 % 3.0 % 1.5 % 2.0 % 2.5 % 3.0 % 8.0 % 8.5 9.0 9.5 10.0 Source: GP Pro Forma Forecast and Bloomberg market data as of 5-Oct-2018 1 Q4 2018 dividend valued at year end 2018; all others based on mid-year convention. Additional Valuation Reference Materials 38 6.4 % 5.9 % 5.4 % 4.9 % 6.9 6.4 5.9 5.4 7.3 6.9 6.4 5.9 7.8 7.3 6.8 6.4 8.3 7.8 7.3 6.8 $ 34.48 $ 36.78 $ 39.51 $ 42.78 32.13 34.08 36.36 39.05 30.09 31.76 33.69 35.93 28.31 29.75 31.40 33.30 26.73 27.99 29.41 31.04 Cost of Equity Implied Terminal Yield Perpetuity Growth Rate Implied Per Share Value of Pro Forma GP + Tax Synergies $ 31.76 Total PV of Cash Tax Savings $ 552 Value Per Pro Forma Share 1.09 Implied Per Share Value of Pro Forma GP $ 30.67
Illustrative Present Value of Future Share Price - GP Status Quo ($ in per share amounts) Status Quo 4Q 2018 2019 2020 2021 2022 Cash Flows to Equity Dividend Per Share Discount Period for Dividend Received¹ Illustrative Cost of Equity Discount Factor $ 0.16 0.25 9.0 % 0.98 $ 0.89 0.75 $ 1.34 1.75 $ 1.74 2.75 $ 2.22 0.94 0.86 0.79 Present Value of Future Share Price at Year End NTM Dividend Per Share at Year End / NTM DCF Per Share at Year End Illustrative NTM P / DCF Multiple Implied Year End Share Price Discount Period for Share Price Discount Factor $ 1.34 14.8 x $19.84 1.25 0.90 $ 1.74 $ 2.22 $25.80 2.25 0.82 $32.90 3.25 0.76 (+) PV of Cumulative Dividends Received 0.99 2.14 3.52 2019 2020 2021 6.00 % 6.75 7.50 16.7 x 14.8 13.3 Source: GP Standalone Forecast and Bloomberg market data as of 5-Oct-2018 1 Q4 2018 dividend valued at year end 2018; all others based on mid-year convention. 39 Additional Valuation Reference Materials $ 21.03 $ 26.05 $ 31.49 18.80 23.39 28.38 17.02 21.27 25.90 Price / DCF Equivalent DCF Yield Hold Period PV of Future Share Price and Dividends $18.80 $23.39 $28.38 PV of Future Share Price $17.81 $21.25 $24.87 Present Value of Dividend Received $0.16 $0.83 $1.15 $1.37
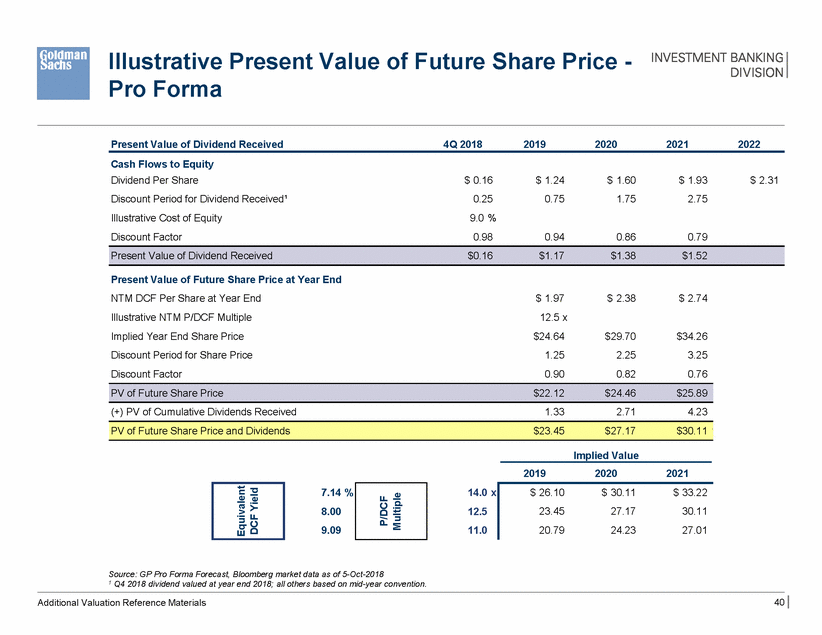
Illustrative Present Pro Forma Value of Future Share Price - Present Value of Dividend Received 4Q 2018 2019 2020 2021 2022 Cash Flows to Equity Dividend Per Share Discount Period for Dividend Received¹ Illustrative Cost of Equity Discount Factor $ 0.16 0.25 9.0 % 0.98 $ 1.24 0.75 $ 1.60 1.75 $ 1.93 2.75 $ 2.31 0.94 0.86 0.79 Present Value of Future Share Price at Year End NTM DCF Per Share at Year End Illustrative NTM P/DCF Multiple Implied Year End Share Price Discount Period for Share Price Discount Factor $ 1.97 12.5 x $24.64 1.25 0.90 $ 2.38 $ 2.74 $29.70 2.25 0.82 $34.26 3.25 0.76 (+) PV of Cumulative Dividends Received 1.33 2.71 4.23 Implied Value 2019 2020 2021 7.14 % 8.00 9.09 14.0 x 12.5 11.0 Source: GP Pro Forma Forecast, Bloomberg market data as of 5-Oct-2018 1 Q4 2018 dividend valued at year end 2018; all others based on mid-year convention. 40 Additional Valuation Reference Materials $ 26.10 $ 30.11 $ 33.22 23.45 27.17 30.11 20.79 24.23 27.01 P/DCF Multiple Equivalent DCF Yield PV of Future Share Price and Dividends $23.45 $27.17 $30.11 PV of Future Share Price $22.12 $24.46 $25.89 Present Value of Dividend Received $0.16 $1.17 $1.38 $1.52
Appendix C: Additional Detail on Financial Forecasts
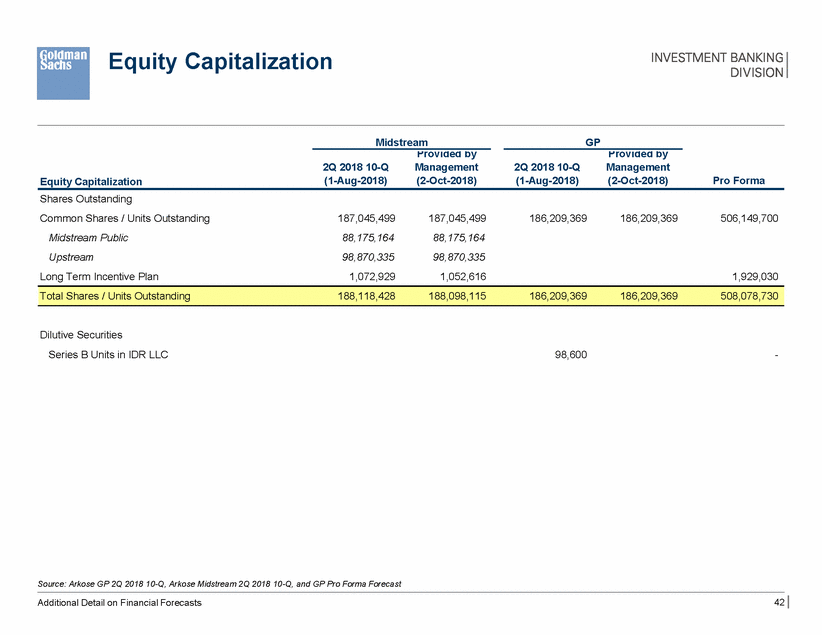
Equity Capitalization Midstream GP Provided by Provided by 2Q 2018 10-Q (1-Aug-2018) Management (2-Oct-2018) 2Q 2018 10-Q (1-Aug-2018) Management (2-Oct-2018) Pro Forma Equity Capitalization Shares Outstanding Common Shares / Units Outstanding Midstream Public Upstream Long Term Incentive Plan 187,045,499 88,175,164 98,870,335 1,072,929 187,045,499 88,175,164 98,870,335 1,052,616 186,209,369 186,209,369 506,149,700 1,929,030 Dilutive Securities Series B Units in IDR LLC 98,600 - Source: Arkose GP 2Q 2018 10-Q, Arkose Midstream 2Q 2018 10-Q, and GP Pro Forma Forecast 42 Additional Detail on Financial Forecasts Total Shares / Units Outstanding188,118,428188,098,115186,209,369186,209,369508,078,730
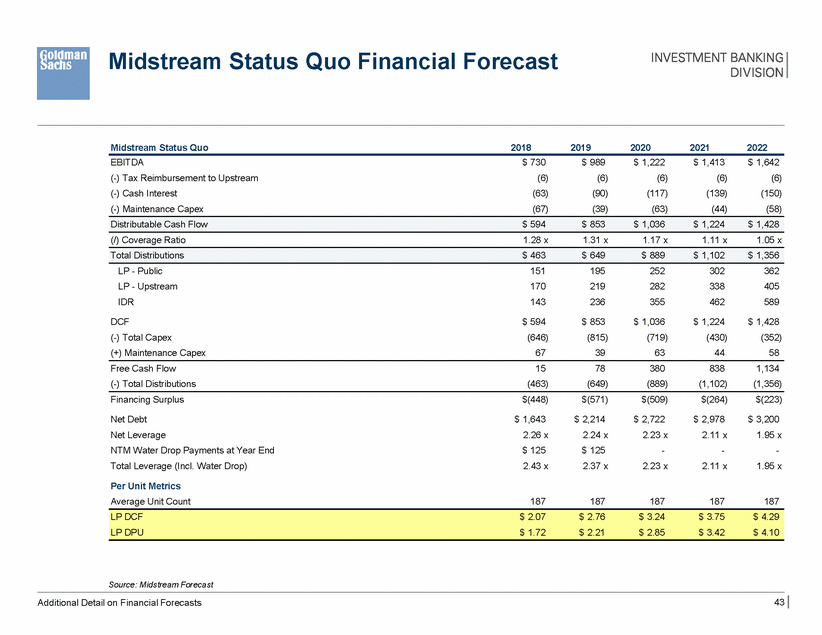
Midstream Status Quo Financial Forecast Midstream Status Quo 2018 2019 2020 2021 2022 EBITDA (-) Tax Reimbursement to Upstream (-) Cash Interest (-) Maintenance Capex $ 730 (6) (63) (67) $ 989 (6) (90) (39) $ 1,222 (6) (117) (63) $ 1,413 (6) (139) (44) $ 1,642 (6) (150) (58) (/) Coverage Ratio 1.28 x 1.31 x 1.17 x 1.11 x 1.05 x LP - Public LP - Upstream IDR 151 170 143 195 219 236 252 282 355 302 338 462 362 405 589 DCF (-) Total Capex (+) Maintenance Capex $ 594 (646) 67 $ 853 (815) 39 $ 1,036 (719) 63 $ 1,224 (430) 44 $ 1,428 (352) 58 Free Cash Flow (-) Total Distributions 15 (463) 78 (649) 380 (889) 838 (1,102) 1,134 (1,356) Financing Surplus $(448) $(571) $(509) $(264) $(223) Net Debt Net Leverage NTM Water Drop Payments at Year End Total Leverage (Incl. Water Drop) $ 1,643 2.26 x $ 125 2.43 x $ 2,214 2.24 x $ 125 2.37 x $ 2,722 2.23 x - 2.23 x $ 2,978 2.11 x - 2.11 x $ 3,200 1.95 x - 1.95 x Per Unit Metrics Average Unit Count 187 187 187 187 187 Source: Midstream Forecast 43 Additional Detail on Financial Forecasts LP DCF $ 2.07 $ 2.76 $ 3.24 $ 3.75 $ 4.29 LP DPU $ 1.72 $ 2.21 $ 2.85 $ 3.42 $ 4.10 Total Distributions $ 463 $ 649 $ 889 $ 1,102 $ 1,356 Distributable Cash Flow $ 594 $ 853 $ 1,036 $ 1,224 $ 1,428
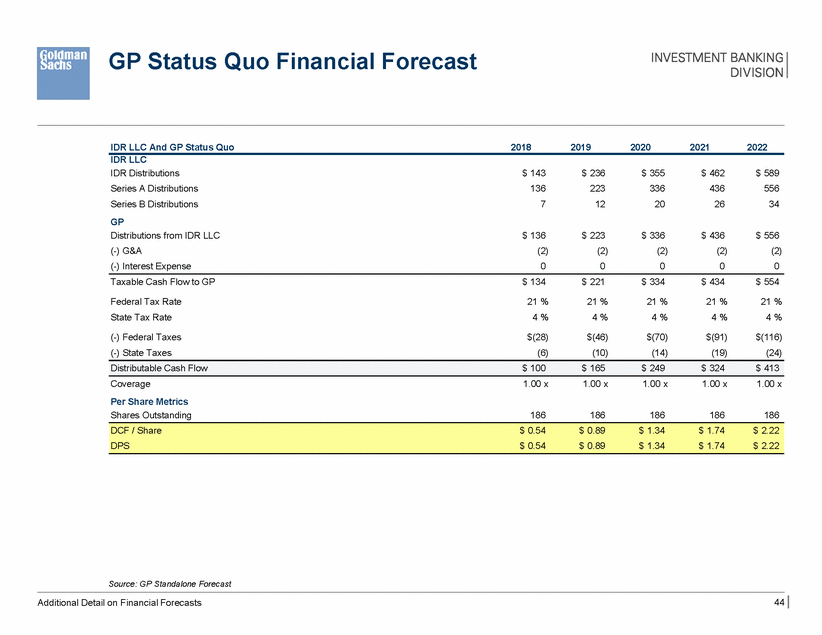
GP Status Quo Financial Forecast IDR LLC And GP Status Quo 2018 2019 2020 2021 2022 IDR LLC IDR Distributions Series A Distributions Series B Distributions GP Distributions from IDR LLC (-) G&A (-) Interest Expense $ 143 136 7 $ 236 223 12 $ 355 336 20 $ 462 436 26 $ 589 556 34 $ 136 (2) 0 $ 223 (2) 0 $ 336 (2) 0 $ 436 (2) 0 $ 556 (2) 0 Taxable Cash Flow to GP $ 134 $ 221 $ 334 $ 434 $ 554 Federal Tax Rate State Tax Rate 21 % 4 % 21 % 4 % 21 % 4 % 21 % 4 % 21 % 4 % (-) Federal Taxes (-) State Taxes $(28) (6) $(46) (10) $(70) (14) $(91) (19) $(116) (24) Coverage Per Share Metrics Shares Outstanding 1.00 x 1.00 x 1.00 x 1.00 x 1.00 x 186 186 186 186 186 Source: GP Standalone Forecast 44 Additional Detail on Financial Forecasts DCF / Share $ 0.54 $ 0.89 $ 1.34 $ 1.74 $ 2.22 DPS $ 0.54 $ 0.89 $ 1.34 $ 1.74 $ 2.22 Distributable Cash Flow $ 100 $ 165 $ 249 $ 324 $ 413
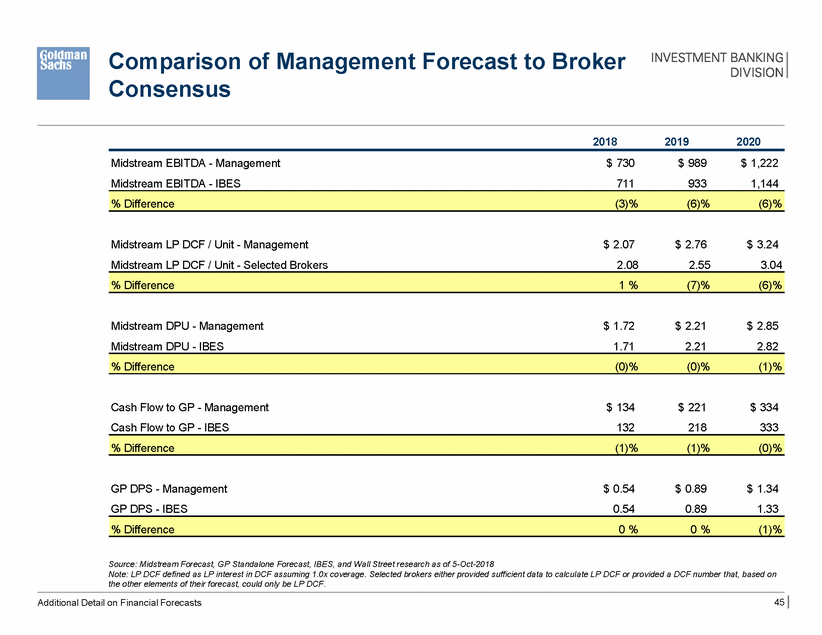
Comparison of Management Consensus Forecast to Broker 2018 2019 2020 Midstream EBITDA - Management Midstream EBITDA - IBES $ 730 711 $ 989 933 $ 1,222 1,144 Midstream LP DCF / Unit - Management Midstream LP DCF / Unit - Selected Brokers $ 2.07 2.08 $ 2.76 2.55 $ 3.24 3.04 Midstream DPU - Management Midstream DPU - IBES $ 1.72 1.71 $ 2.21 2.21 $ 2.85 2.82 Cash Flow to GP - Management Cash Flow to GP - IBES $ 134 132 $ 221 218 $ 334 333 GP DPS - Management GP DPS - IBES $ 0.54 0.54 $ 0.89 0.89 $ 1.34 1.33 Source: Midstream Forecast, GP Standalone Forecast, IBES, and Wall Street research as of 5-Oct-2018 Note: LP DCF defined as LP interest in DCF assuming 1.0x coverage. Selected brokers either provided sufficient data to calculate LP DCF or provided a DCF number that, based on the other elements of their forecast, could only be LP DCF. 45 Additional Detail on Financial Forecasts % Difference 0 % 0 % (1)% % Difference (1)% (1)% (0)% % Difference (0)% (0)% (1)% % Difference 1 % (7)% (6)% % Difference (3)% (6)% (6)%
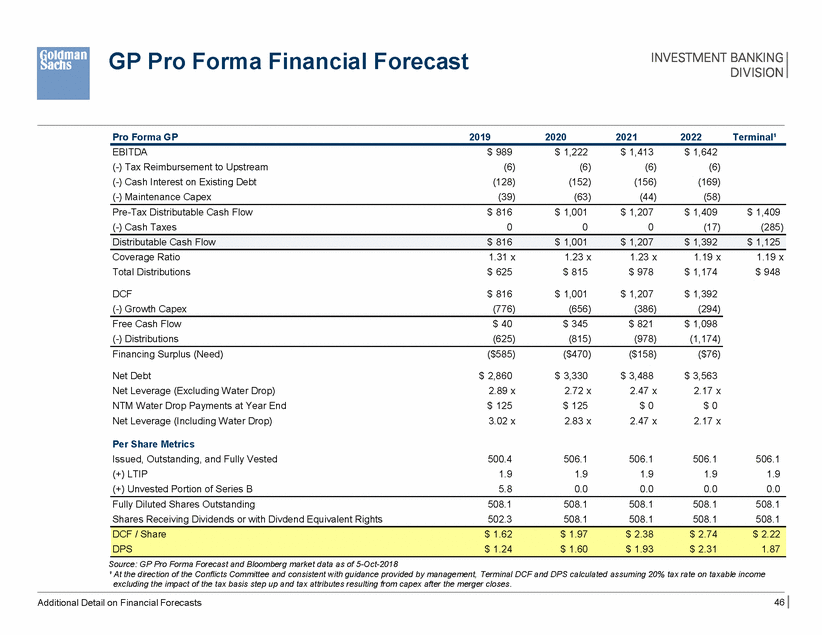
GP Pro Forma Financial Forecast Pro Forma GP 2019 2020 2021 2022 Terminal¹ EBITDA (-) Tax Reimbursement to Upstream (-) Cash Interest on Existing Debt (-) Maintenance Capex $ 989 (6) (128) (39) $ 1,222 (6) (152) (63) $ 1,413 (6) (156) (44) $ 1,642 (6) (169) (58) Pre-Tax Distributable Cash Flow (-) Cash Taxes $ 816 0 $ 1,001 0 $ 1,207 0 $ 1,409 (17) $ 1,409 (285) Coverage Ratio Total Distributions 1.31 x $ 625 1.23 x $ 815 1.23 x $ 978 1.19 x $ 1,174 1.19 x $ 948 DCF (-) Growth Capex $ 816 (776) $ 1,001 (656) $ 1,207 (386) $ 1,392 (294) Free Cash Flow (-) Distributions $ 40 (625) $ 345 (815) $ 821 (978) $ 1,098 (1,174) Financing Surplus (Need) ($585) ($470) ($158) ($76) Net Debt Net Leverage (Excluding Water Drop) NTM Water Drop Payments at Year End Net Leverage (Including Water Drop) $ 2,860 2.89 x $ 125 3.02 x $ 3,330 2.72 x $ 125 2.83 x $ 3,488 2.47 x $ 0 2.47 x $ 3,563 2.17 x $ 0 2.17 x Per Share Metrics Issued, Outstanding, and Fully Vested (+) LTIP (+) Unvested Portion of Series B 500.4 1.9 5.8 506.1 1.9 0.0 506.1 1.9 0.0 506.1 1.9 0.0 506.1 1.9 0.0 Fully Diluted Shares Outstanding Shares Receiving Dividends or with Divdend Equivalent Rights 508.1 502.3 508.1 508.1 508.1 508.1 508.1 508.1 508.1 508.1 Source: GP Pro Forma Forecast and Bloomberg market data as of 5-Oct-2018 ¹ At the direction of the Conflicts Committee and consistent with guidance provided by management, Terminal DCF and DPS calculated assuming 20% tax rate on taxable income excluding the impact of the tax basis step up and tax attributes resulting from capex after the merger closes. 46 Additional Detail on Financial Forecasts DCF / Share $ 1.62 $ 1.97 $ 2.38 $ 2.74 $ 2.22 DPS $ 1.24 $ 1.60 $ 1.93 $ 2.31 1.87 Distributable Cash Flow $ 816 $ 1,001 $ 1,207 $ 1,392 $ 1,125
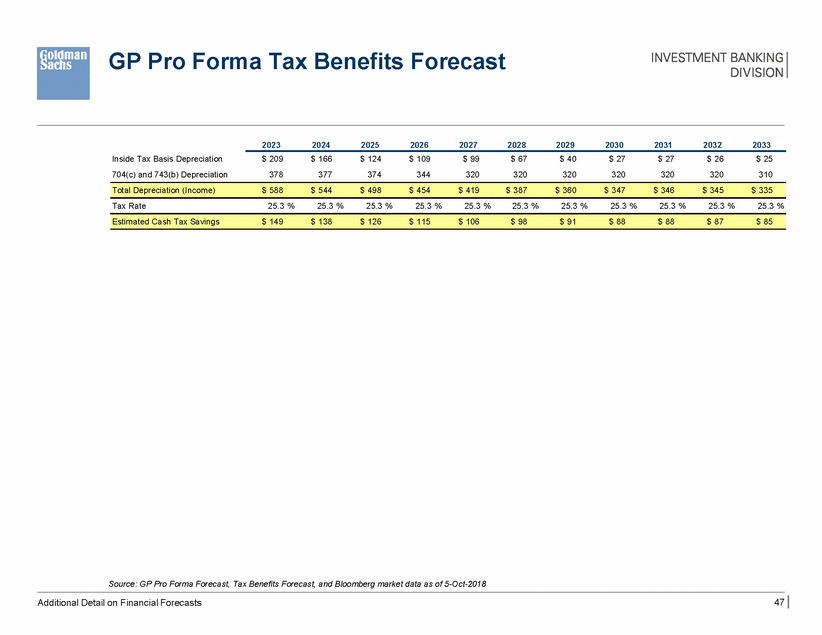
GP Pro Forma Tax Benefits Forecast 2023 2024 2025 2026 2027 2028 2029 2030 2031 2032 2033 Inside Tax Basis Depreciation 704(c) and 743(b) Depreciation $ 209 378 $ 166 377 $ 124 374 $ 109 344 $ 99 320 $ 67 320 $ 40 320 $ 27 320 $ 27 320 $ 26 320 $ 25 310 Tax Rate 25.3 % 25.3 % 25.3 % 25.3 % 25.3 % 25.3 % 25.3 % 25.3 % 25.3 % 25.3 % 25.3 % Source: GP Pro Forma Forecast, Tax Benefits Forecast, and Bloomberg market data as of 5-Oct-2018 47 Additional Detail on Financial Forecasts Estimated Cash Tax Savings$ 149$ 138$ 126$ 115$ 106$ 98$ 91$ 88$ 88$ 87$ 85 Total Depreciation (Income)$ 588$ 544$ 498$ 454$ 419$ 387$ 360$ 347$ 346$ 345$ 335
Calculation of PV10 Tax Synergies 2019 2020 2021 2022 Pro Forma Cash Taxes (-) Status Quo Cash Taxes $ 0 (56) $ 0 (84) $ 0 (110) $(17) (140) Cash Tax Tavings $ 56 $ 84 $ 110 $ 123 2023 2024 2025 Average '26-33 Total Step Up Depreciation (x) Tax Rate $ 588 25.3 % $ 544 25.3 % $ 498 25.3 % $ 374 25.3 % Estimated Cash Tax Savings $ 149 $ 138 $ 126 $ 95 Source: GP Standalone Forecast, GP Pro Forma Forecast, and Tax Benefits Forecast 48 Additional Detail on Financial Forecasts PV10 of Long Term Tax Savings$ 512 PV10 of Near Term Savings$ 294
