Confidential PROJECT BRONCO CONFIDENTIAL DISCUSSION MATERIALS March 30, 2018 Project Bronco |

Confidential PROJECT BRONCO CONFIDENTIAL DISCUSSION MATERIALS March 30, 2018 Project Bronco |
Confidential TABLE OF CONTENTS CONFIDENTIAL DISCUSSION MATERIALS Process Update Water Earn-Out Discussion Case Study: Tallgrass Simplification Appendix 1 2 3 A. Cost of Capital Analysis Page 1 Project Bronco |
Confidential PROCESS UPDATE Project Bronco |
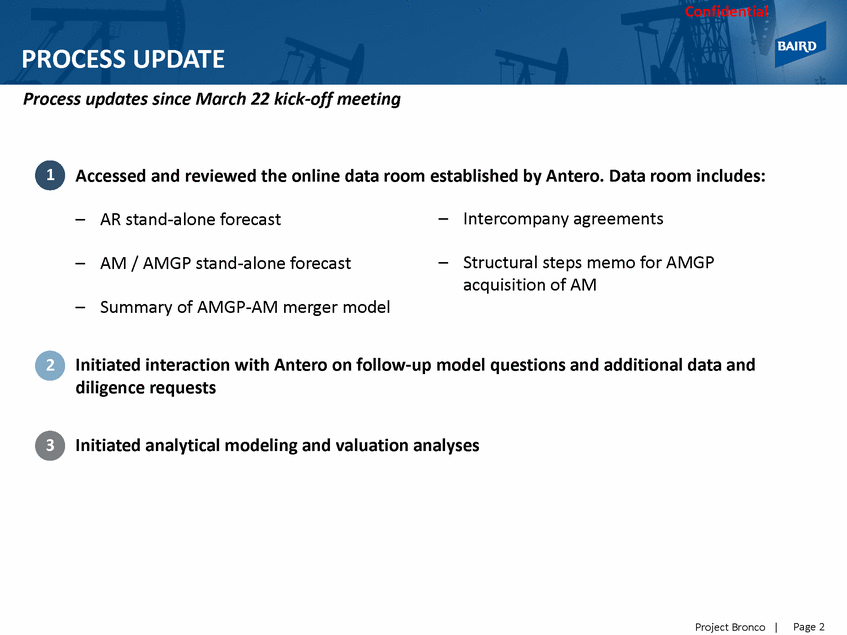
Confidential PROCESS UPDATE Process updates since March 22 kick-off meeting 1 Accessed and reviewed the online data room established by Antero. Data room includes: – Intercompany agreements – AR stand-alone forecast – Structural steps memo for AMGP acquisition of AM – AM / AMGP stand-alone forecast – Summary of AMGP-AM merger model Initiated interaction with Antero on follow-up model questions and additional data and diligence requests 2 3 Initiated analytical modeling and valuation analyses Page 2 Project Bronco |
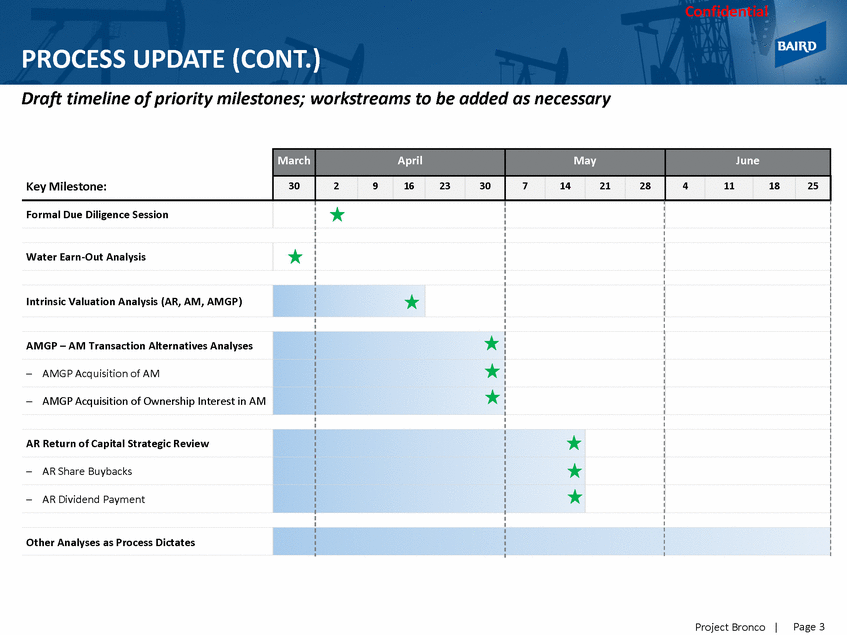
Confidential PROCESS UPDATE (CONT.) Draft timeline of priority milestones; workstreams to be added as necessary Page 3 Project Bronco | Key Milestone: March April May June 30 2 9 16 23 30 7 14 21 28 4 11 18 25 Formal Due Diligence Session Water Earn-Out Analysis Intrinsic Valuation Analysis (AR, AM, AMGP) AMGP – AM Transaction Alternatives Analyses – AMGP Acquisition of AM – AMGP Acquisition of Ownership Interest in AM AR Return of Capital Strategic Review – AR Share Buybacks – AR Dividend Payment Other Analyses as Process Dictates
Confidential WATER EARN-OUT DISCUSSION Project Bronco |

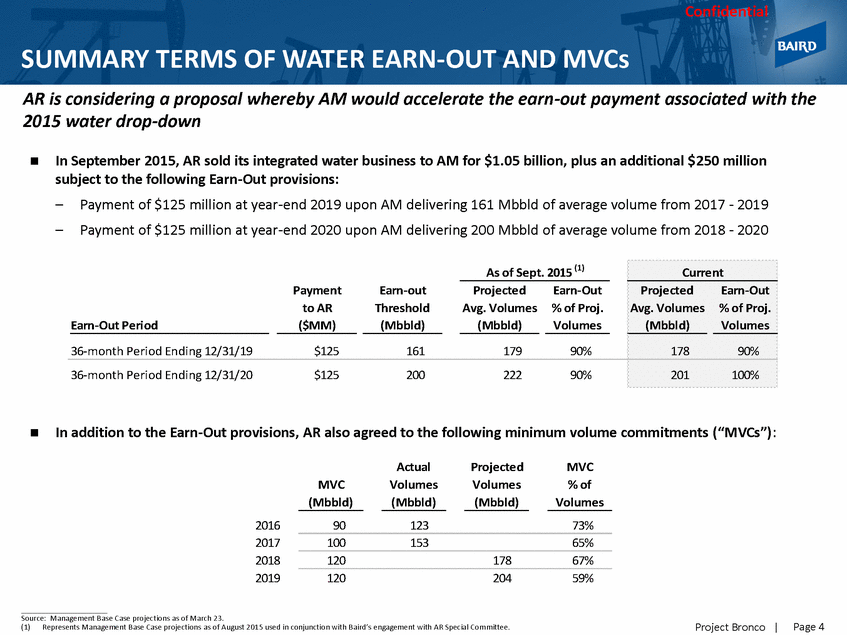
Confidential SUMMARY TERMS OF WATER EARN-OUT AND MVCs AR is considering a proposal whereby AM would accelerate the earn-out payment associated with the 2015 water drop-down In September 2015, AR sold its integrated water business to AM for $1.05 billion, plus an additional $250 million subject to the following Earn-Out provisions: – – Payment of $125 million at year-end 2019 upon AM delivering 161 Mbbld of average volume from 2017 - 2019 Payment of $125 million at year-end 2020 upon AM delivering 200 Mbbld of average volume from 2018 - 2020 In addition to the Earn-Out provisions, AR also agreed to the following minimum volume commitments (“MVCs”): Actual Volumes (Mbbld) Projected Volumes (Mbbld) MVC % of Volumes MVC (Mbbld) 2016 2017 2018 2019 90 123 73% 100 153 65% 120 178 67% 120 204 59% Source: Management Base Case projections as of March 23. (1)Represents Management Base Case projections as of August 2015 used in conjunction with Baird’s engagement with AR Special Committee. Page 4 Project Bronco | As of Sept. 2015 (1) Payment Earn-out Projected Earn-Out to AR Threshold Avg. Volumes % of Proj. Earn-Out Period ($MM) (Mbbld) (Mbbld) Volumes 36-month Period Ending 12/31/19 $125 161 179 90% Current Projected Avg. Volumes (Mbbld) Earn-Out % of Proj. Volumes 178 90% 36-month Period Ending 12/31/20 $125 200 222 90% 201 100%
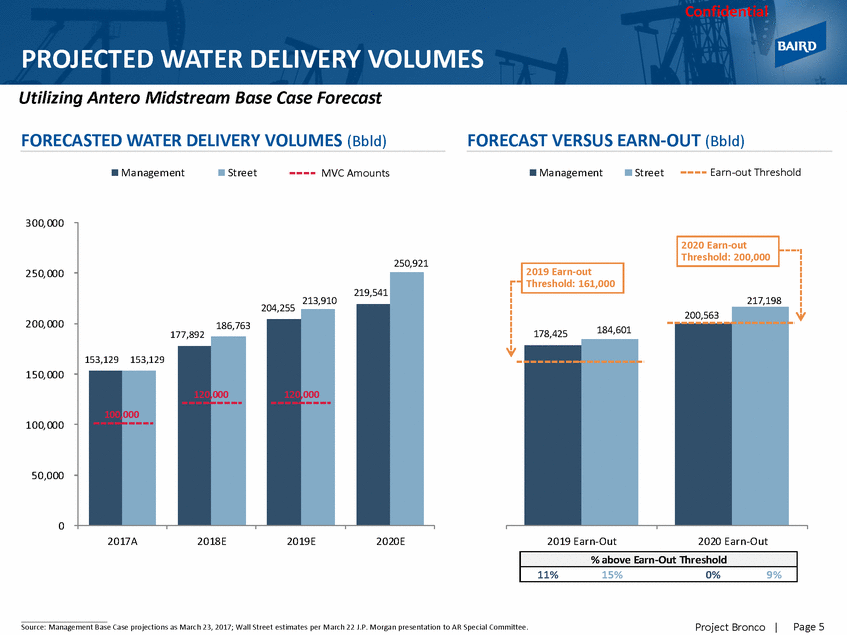
Confidential PROJECTED WATER DELIVERY VOLUMES Utilizing Antero Midstream Base Case Forecast FORECASTED WATER DELIVERY VOLUMES (Bbld) FORECAST VERSUS EARN-OUT (Bbld) Ma nagement Street Ma nagement Street Earn-out Threshold MVC Amounts 300, 000 250, 000 213,910 217,198 204,255 200, 000 150, 000 000 120,000 100, 000 50,000 0 2017A 2018E 2019E 2020E 2019 Earn-Out 2020 Earn-Out Page 5 Project Bronco | Source: Management Base Case projections as March 23, 2017; Wall Street estimates per March 22 J.P. Morgan presentation to AR Special Committee. % above Earn-Out Threshold 11% 15% 0% 9% 200,563 178,425184,601 2019 Earn-out Threshold: 161,000 2020 Earn-out Threshold: 200,000 250,921 219,541 186,763 177,892 153,129 153,129 120, 100, 000
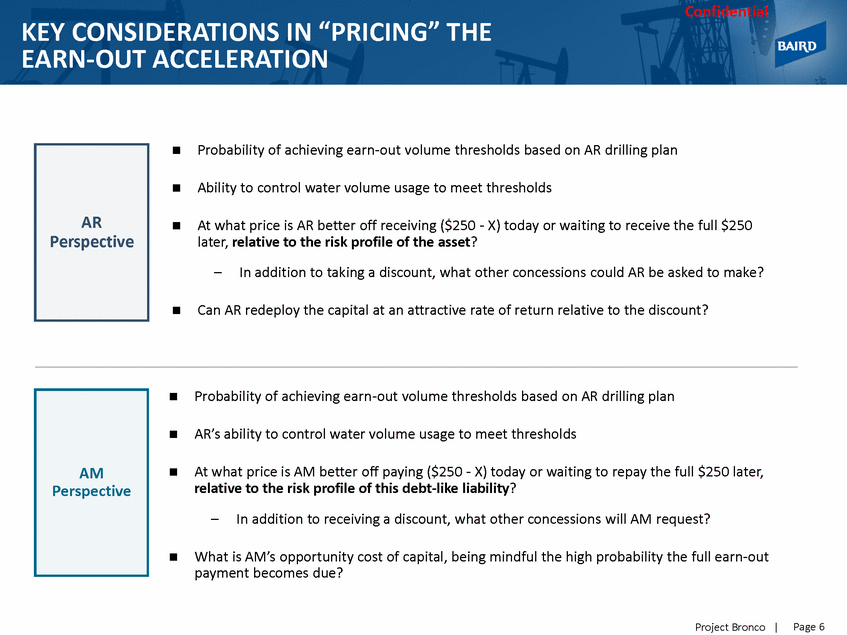
Confidential KEY CONSIDERATIONS IN “PRICING” THE EARN-OUT ACCELERATION Probability of achieving earn-out volume thresholds based on AR drilling plan Ability to control water volume usage to meet thresholds At what price is AR better off receiving ($250 - X) today or waiting to receive the full $250 later, relative to the risk profile of the asset? – In addition to taking a discount, what other concessions could AR be asked to make? Can AR redeploy the capital at an attractive rate of return relative to the discount? Probability of achieving earn-out volume thresholds based on AR drilling plan AR’s ability to control water volume usage to meet thresholds At what price is AM better off paying ($250 - X) today or waiting to repay the full $250 later, relative to the risk profile of this debt-like liability? – In addition to receiving a discount, what other concessions will AM request? What is AM’s opportunity cost of capital, being mindful the high probability the full earn-out payment becomes ? Page 6 Project Bronco | AM Perspective AR Perspective
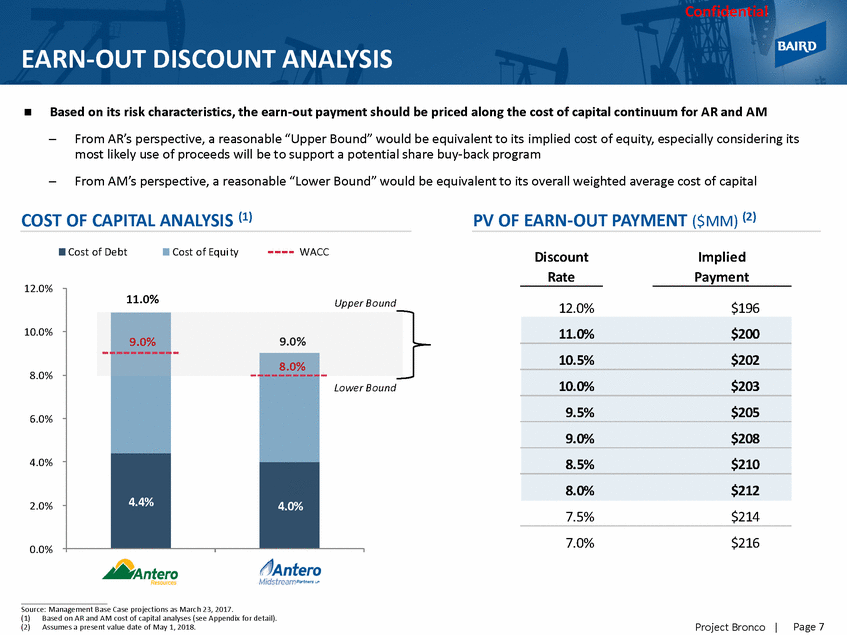
Confiden EARN-OUT DISCOUNT ANALYSIS Based on its risk characteristics, the earn-out payment should be priced along the cost of capital continuum for AR and AM From AR’s perspective, a reasonable “Upper Bound” would be equivalent to its implied cost of equity, especially considering its most likely use of proceeds will be to support a potential share buy-back program From AM’s perspective, a reasonable “Lower Bound” would be equivalent to its overall weighted average cost of capital COST OF CAPITAL ANALYSIS (1) PV OF EARN-OUT PAYMENT ($MM) (2) Cost of Debt Cost of Equi ty WACC Discount Rate Implied Payment 12.0% 12.0% $196 10.0% 8.0% 6.0% 4.0% 2.0% 7.5% $214 7.0% $216 0.0% Source: Management Base Case projections as March 23, 2017. (1)Based on AR and AM cost of capital analyses (see Appendix for detail). (2)Assumes a present value date of May 1, 2018. Page 7 Project Bronco | 11.0% $200 10.5% $202 10.0% $203 9.5% $205 9.0% $208 8.5% $210 8.0% $212 11.0%Upper Bound 9.0%9.0% 8.0% Lower Bound 4.4% 4.0%
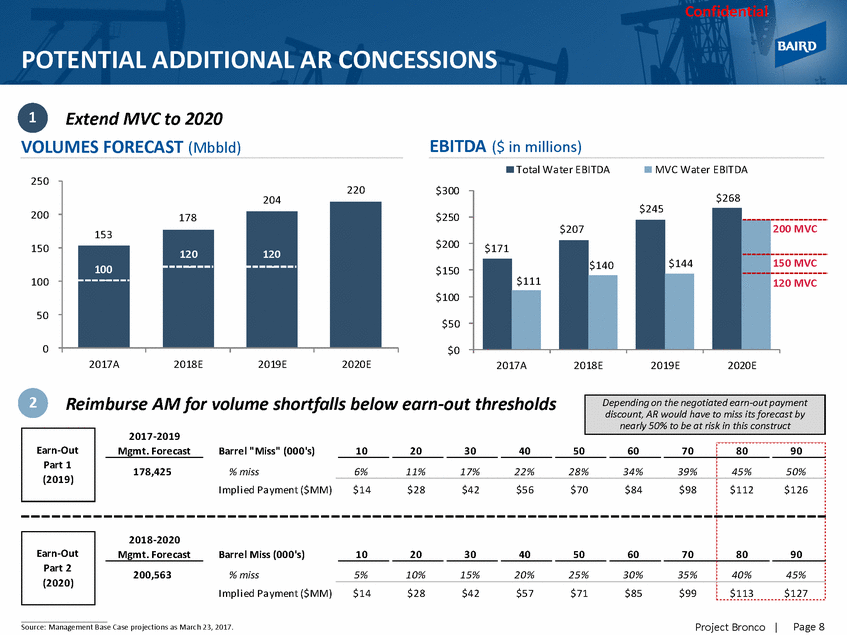
Confidential POTENTIAL ADDITIONAL AR CONCESSIONS 1 Extend MVC to 2020 EBITDA ($ in millions) VOLUMES FORECAST (Mbbld) Total Wa ter EBITDA MVC Water EBITDA 250 $300 204 $245 200 $250 $200 150 $150 100 120 MVC $100 50 $50 0 $0 2017A 2018E 2019E 2020E 2017A 2018E 2019E 2020E 2 Reimburse AM for volume shortfalls below earn-out thresholds 2017-2019 Mgmt. Forecast Barrel "Miss" (000's) % miss Impl i ed Payment ($MM) 10 20 30 40 50 60 70 80 90 178,425 6% 11% 17% 22% 28% 34% 39% 45% 50% $14 $28 $42 $56 $70 $84 $98 $112 $126 2018-2020 Mgmt. Forecast Barrel Miss (000's) % miss Impl i ed Payment ($MM) 10 20 30 40 50 60 70 80 90 200,563 5% 10% 15% 20% 25% 30% 35% 40% 45% $14 $28 $42 $57 $71 $85 $99 $113 $127 Page 8 Project Bronco | Source: Management Base Case projections as March 23, 2017. Earn-Out Part 2 (2020) Earn-Out Part 1 (2019) Depending on the negotiated earn-out payment discount, AR would have to miss its forecast by nearly 50% to be at risk in this construct $268 $207 $144 200 MVC $171 $140 150 MVC $111 220 178 120 153 120 100
Confidential CASE STUDY: TALLGRASS SIMPLIFICATION Project Bronco |
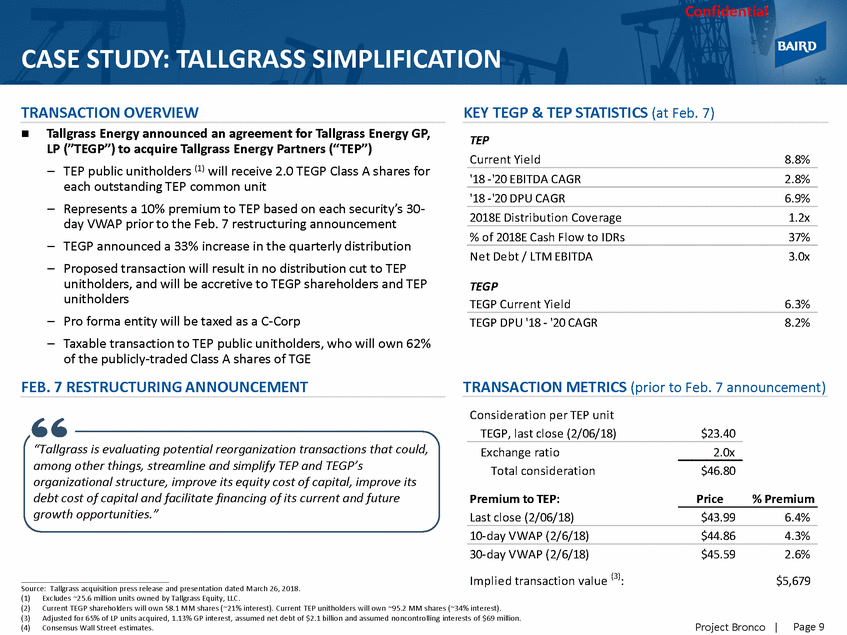
Confidential CASE STUDY: TALLGRASS SIMPLIFICATION TRANSACTION OVERVIEW KEY TEGP & TEP STATISTICS (at Feb. 7) Tallgrass Energy announced an agreement for Tallgrass Energy GP, LP (”TEGP”) to acquire Tallgrass Energy Partners (“TEP”) TEP Current Yield 8.8% – TEP public unitholders (1) will receive 2.0 TEGP Class A shares for each outstanding TEP common unit Represents a 10% premium to TEP based on each security’s 30-day VWAP prior to the Feb. 7 restructuring announcement TEGP announced a 33% increase in the quarterly distribution Proposed transaction will result in no distribution cut to TEP unitholders, and will be accretive to TEGP shareholders and TEP unitholders Pro forma entity will be taxed as a C-Corp Taxable transaction to TEP public unitholders, who will own 62% of the publicly-traded Class A shares of TGE '18 -'20 EBITDA CAGR 2.8% '18 -'20 DPU CAGR 6.9% – 2018E Distribution Coverage 1.2x % of 2018E Cash Flow to IDRs 37% – – Net Debt / LTM EBITDA 3.0x TEGP TEGP Current Yield 6.3% – – TEGP DPU '18 - '20 CAGR 8.2% FEB. 7 RESTRUCTURING ANNOUNCEMENT TRANSACTION METRICS (prior to Feb. 7 announcement) Consideration per TEP unit TEGP, last close (2/06/18) $23.40 “Tallgrass is evaluating potential reorganization transactions that could, among other things, streamline and simplify TEP and TEGP’s organizational structure, improve its equity cost of capital, improve its debt cost of capital and facilitate financing of its current and future growth opportunities.” Exchange ratio Total consideration 2.0x $46.80 Premium to TEP: Last close (2/06/18) Price % Premium $43.99 6.4% 10-day VWAP (2/6/18) $44.86 4.3% 30-day VWAP (2/6/18) Implied transaction value (3): $45.59 2.6% $5,679 Source: Tallgrass acquisition press release and presentation dated March 26, 2018. (1) (2) (3) (4) Excludes ~25.6 million units owned by Tallgrass Equity, LLC. Current TEGP shareholders will own 58.1 MM shares (~21% interest). Current TEP unitholders will own ~95.2 MM shares (~34% interest). Adjusted for 65% of LP units acquired, 1.13% GP interest, assumed net debt of $2.1 billion and assumed noncontrolling interests of $69 million. Consensus Wall Street estimates. Page 9 Project Bronco |
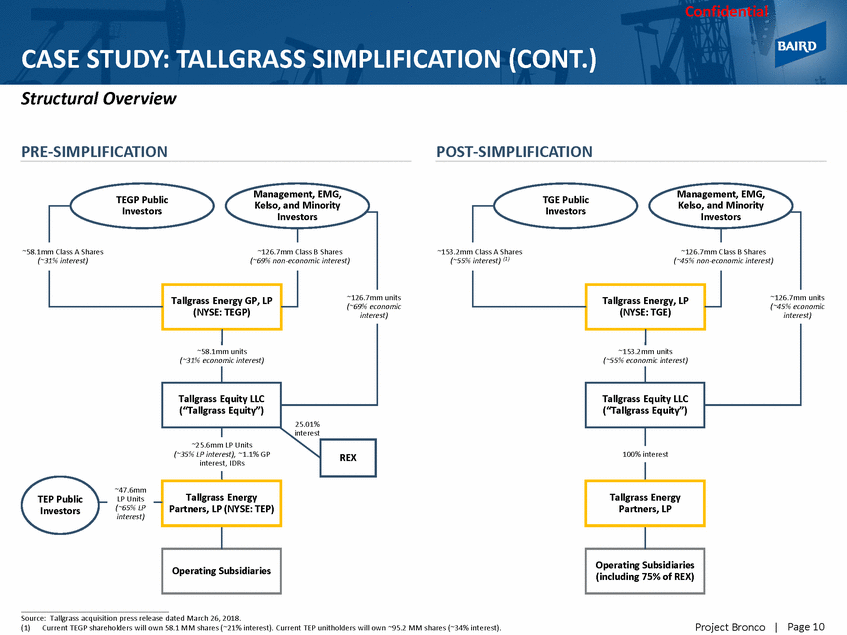
Confidential CASE STUDY: TALLGRASS SIMPLIFICATION (CONT.) Structural Overview PRE-SIMPLIFICATION POST-SIMPLIFICATION Management, EMG, d Minority Management, EMG, d Minority TEGP Public TGE Public ~58.1mm Clas ~153.2mm (~3 erest) (~55% m units conomic rest) m units conomic rest) ~25.6mm LP Units (~35% LP interest), ~1.1% GP interest, IDRs 100% interest ~47.6mm LP Units (~65% LP interest) TEP Public Investors (including 75% of REX) Source: Tallgrass acquisition press release dated March 26, 2018. (1)Current TEGP shareholders will own 58.1 MM shares (~21% interest). Current TEP unitholders will own ~95.2 MM shares (~34% interest). Page 10 Project Bronco | Tallgrass Energy Partners, LP Operating Subsidiaries Tallgrass Energy Partners, LP (NYSE: TEP) Operating Subsidiaries REX stors Class B Shares conomic interest) ~1 (~4 ~153.2mm units (~55% economic interest) 26.7m 5% e inte Tallgrass Equity LLC (“Tallgrass Equity”) stors Class B Shares (~69% non-economic interest) ~1 (~6 ~58.1mm units (~31% economic interest) 26.7m 9% e inte Tallgrass Equity LLC (“Tallgrass Equity”) 25.01% interest Class interes InvestorsKelso, an Inve A Shares~126.7mm t) (1) (~45% non-e Tallgrass Energy, LP (NYSE: TGE) 1% int InvestorsKelso, an Inve s A Shares~126.7mm Tallgrass Energy GP, LP (NYSE: TEGP)
Confidential APPENDIX Project Bronco |
Cost of Capital Analysis
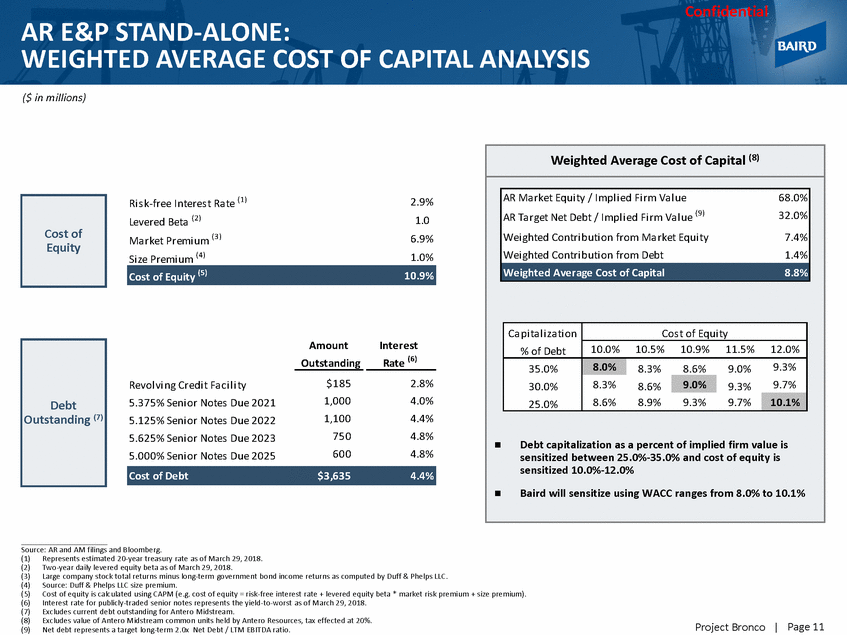
Confidential AR E&P STAND-ALONE: WEIGHTED AVERAGE COST ($ in millions) OF CAPITAL ANALYSIS Ri s k-free Interes t Ra te (1) Levered Beta (2) Ma rket Premi um (3) Si ze Premi um (4) 2.9% 1.0 6.9% 1.0% Amount Interest Outstanding Rate (6) $185 1,000 1,100 750 600 2.8% 4.0% 4.4% 4.8% 4.8% Revol vi ng Credi t Fa ci l i ty 5.375% Seni or Notes Due 2021 5.125% Seni or Notes Due 2022 5.625% Seni or Notes Due 2023 5.000% Seni or Notes Due 2025 Source: AR and AM filings and Bloomberg. (1) (2) (3) (4) (5) (6) (7) (8) (9) Represents estimated 20-year treasury rate as of March 29, 2018. Two-year daily levered equity beta as of March 29, 2018. Large company stock total returns minus long-term government bond income returns as computed by Duff & Phelps LLC. Source: Duff & Phelps LLC size premium. Cost of equity is calculated using CAPM (e.g. cost of equity = risk-free interest rate + levered equity beta * market risk premium + size premium). Interest rate for publicly-traded senior notes represents the yield-to-worst as of March 29, 2018. Excludes current debt outstanding for Antero Midstream. Excludes value of Antero Midstream common units held by Antero Resources, tax effected at 20%. Net debt represents a target long-term 2.0x Net Debt / LTM EBITDA ratio. Page 11 Project Bronco | Cost of Debt $3,635 4.4% Debt Outstanding (7) Cost of Equity (5) 10.9% Cost of Equity Weighted Average Cost of Capital (8) AR Ta rget Net Debt / Impl i ed Fi rm Va l ue Debt capitalization as a percent of implied firm value is sensitized between 25.0%-35.0% and cost of equity is sensitized 10.0%-12.0% Baird will sensitize using WACC ranges from 8.0% to 10.1% Ca pi ta l i za ti on % of Debt Cos t of Equi ty 10.0% 10.5% 10.9% 11.5% 12.0% 35.0% 8.0% 8.3% 8.6% 9.0% 9.3% 30.0% 8.3% 8.6% 9.0% 9.3% 9.7% 25.0% 8.6% 8.9% 9.3% 9.7% 10.1% AR Ma rket Equi ty / Impl i ed Fi rm Va l ue 68.0% (9) 32.0% Wei ghted Contri buti on from Ma rket Equi ty 7.4% Wei ghted Contri buti on from Debt 1.4% Weighted Average Cost of Capital 8.8%
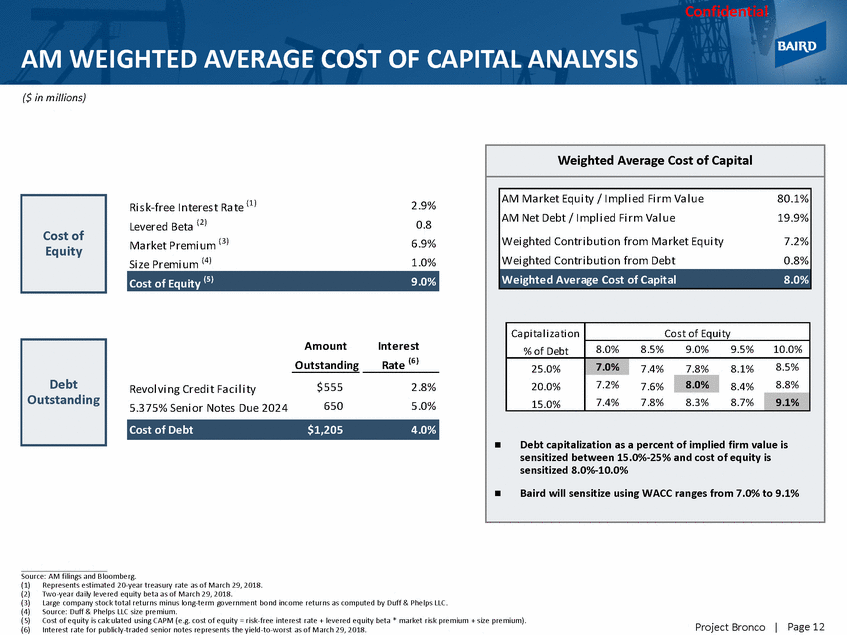
Confidential AM WEIGHTED AVERAGE ($ in millions) COST OF CAPITAL ANALYSIS Ri s k-free Interes t Ra te (1) Levered Beta (2) 2.9% 0.8 6.9% 1.0% (3) Ma rket Premi um Si ze Premi um (4) Amount Interest Outstanding Rate (6) $555 650 2.8% 5.0% Revol vi ng Credi t Fa ci l i ty 5.375% Seni or Notes Due 2024 Source: AM filings and Bloomberg. (1) (2) (3) (4) (5) (6) Represents estimated 20-year treasury rate as of March 29, 2018. Two-year daily levered equity beta as of March 29, 2018. Large company stock total returns minus long-term government bond income returns as computed by Duff & Phelps LLC. Source: Duff & Phelps LLC size premium. Cost of equity is calculated using CAPM (e.g. cost of equity = risk-free interest rate + levered equity beta * market risk premium + size premium). Interest rate for publicly-traded senior notes represents the yield-to-worst as of March 29, 2018. Page 12 Project Bronco | Cost of Debt $1,205 4.0% Debt Outstanding Cost of Equity (5) 9.0% Cost of Equity Weighted Average Cost of Capital Debt capitalization as a percent of implied firm value is sensitized between 15.0%-25% and cost of equity is sensitized 8.0%-10.0% Baird will sensitize using WACC ranges from 7.0% to 9.1% Ca pi ta l i za ti on % of Debt Cos t of Equi ty 8.0% 8.5% 9.0% 9.5% 10.0% 25.0% 7.0% 7.4% 7.8% 8.1% 8.5% 20.0% 7.2% 7.6% 8.0% 8.4% 8.8% 15.0% 7.4% 7.8% 8.3% 8.7% 9.1% AM Ma rket Equi ty / Impl i ed Fi rm Va l ue 80.1% AM Net Debt / Impl i ed Fi rm Va l ue 19.9% Wei ghted Contri buti on from Ma rket Equi ty7.2% Wei ghted Contri buti on from Debt 0.8% Weighted Average Cost of Capital 8.0%