Confidential PROJECT BRONCO CONFIDENTIAL DISCUSSION MATERIALS April 19, 2018 Project Bronco |

Confidential PROJECT BRONCO CONFIDENTIAL DISCUSSION MATERIALS April 19, 2018 Project Bronco |

Confidential TABLE OF CONTENTS CONFIDENTIAL DISCUSSION MATERIALS Process Review AR Market & Valuation Perspectives AM / AMGP Market & Valuation Perspectives Appendix 1 2 3 A. B. Detailed Antero Family Projections AR E&P Comparables Analysis Page 1 Project Bronco |
Confidential PROCESS UPDATE Project Bronco |
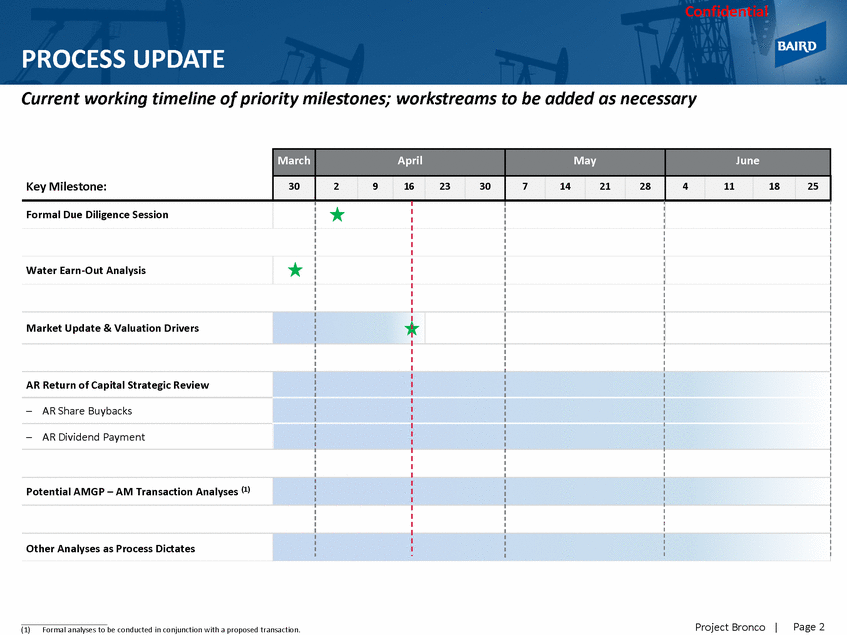
Confidential PROCESS UPDATE Current working timeline of priority milestones; workstreams to be added as necessary Page 2 Project Bronco | (1)Formal analyses to be conducted in conjunction with a proposed transaction. Key Milestone: March April May June 30 2 9 16 23 30 7 14 21 28 4 11 18 25 Formal Due Diligence Session Water Earn-Out Analysis Market Update & Valuation Drivers AR Return of Capital Strategic Review – AR Share Buybacks – AR Dividend Payment Potential AMGP – AM Transaction Analyses (1) Other Analyses as Process Dictates
Confidential AR MARKET & VALUATION PERSPECTIVES Project Bronco |
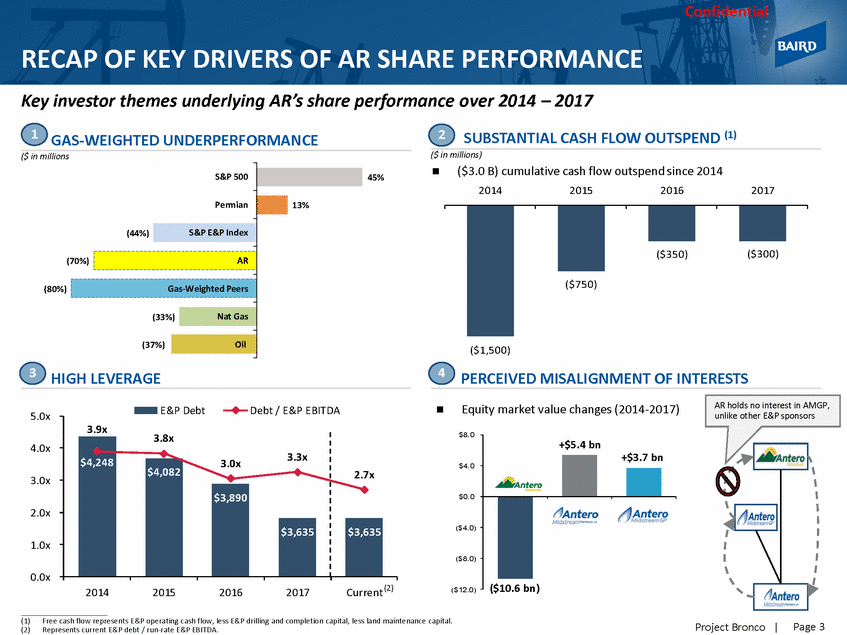
Confidential RECAP OF KEY DRIVERS OF AR SHARE PERFORMANCE Key investor themes underlying AR’s share performance over 2014 – 2017 1 2 SUBSTANTIAL CASH FLOW OUTSPEND (1) GAS-WEIGHTED UNDERPERFORMANCE ($ in millions) ($ in millions ($3.0 B) cumulative cash flow outspend since 2014 S&P 500 45% 2014 2015 2016 2017 Permian (70%) (80%) ($1,500) 3 4 HIGH LEVERAGE PERCEIVED MISALIGNMENT OF INTERESTS AR holds no interest in AMGP, unlike other E&P sponsors Equity market value changes (2014-2017) E&P Debt Debt / E&P EBITDA 5.0x $8.0 4.0x 3.3x 3.0x $4.0 3.0x $0.0 2.0x ($4.0) 1.0x ($8.0) 0.0x ($10.6 bn) Current (2) ($12.0) 2014 2015 2016 2017 (1)Free cash flow represents E&P operating cash flow, less E&P drilling and completion capital, less land maintenance capital. (2)Represents current E&P debt / run-rate E&P EBITDA. Page 3 Project Bronco | +$5.4 bn +$3.7 bn 3.9x 2.7x $4,248 3.8x $4,082 $3,890 $3,635 $3,635 ($350) ($300) ($750) 13% (44%) S&P E&P Index AR Gas-Weighted Peers (33%) Nat Gas (37%) Oil
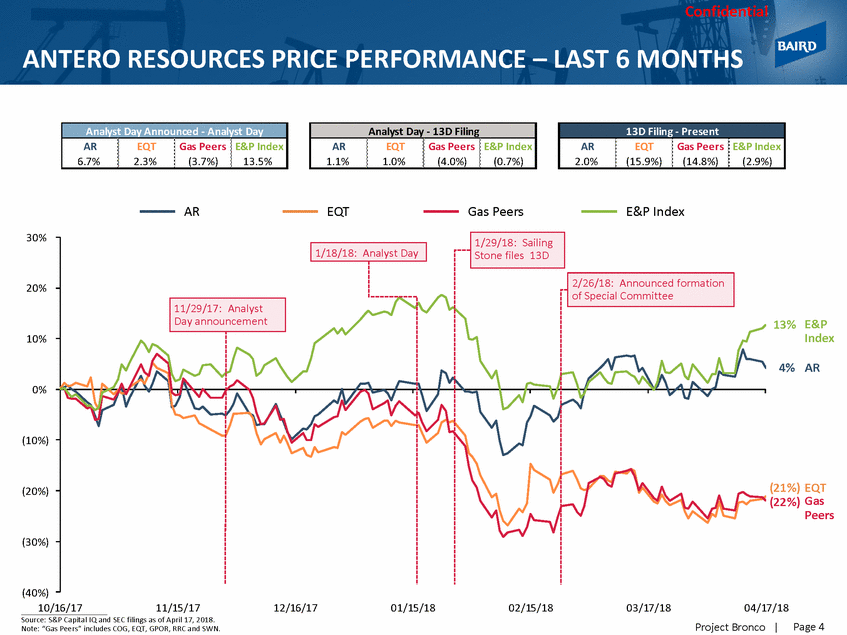
Confidential ANTERO RESOURCES PRICE PERFORMANCE – LAST 6 MONTHS AR EQT Gas Peers E&P Index 30% 20% 13% E&P Index 10% 4% AR 0% (10%) (21%) EQT (22%) Gas Peers (20%) (30%) (40%) 1_0/_1_6_/1_7 11/15/17 12/16/17 01/15/18 02/15/18 03/17/18 04/17/18 Project Bronco | Source: S&P Capital IQ and SEC filings as of April 17, 2018. Note: “Gas Peers” includes COG, EQT, GPOR, RRC and SWN. Page 4 1/29/18: Sailing Stone files 13D 1/18/18: Analyst Day 2/26/18: Announced formation of Special Committee 11/29/17: Analyst Day announcement 13D Filing - Present AR EQT Gas Peers E&P Index 2.0% (15.9%) (14.8%) (2.9%) Analyst Day - 13D Filing AR EQT Gas Peers E&P Index 1.1% 1.0% (4.0%) (0.7%) Analyst Day Announced - Analyst Day AR EQT Gas Peers E&P Index 6.7% 2.3% (3.7%) 13.5%
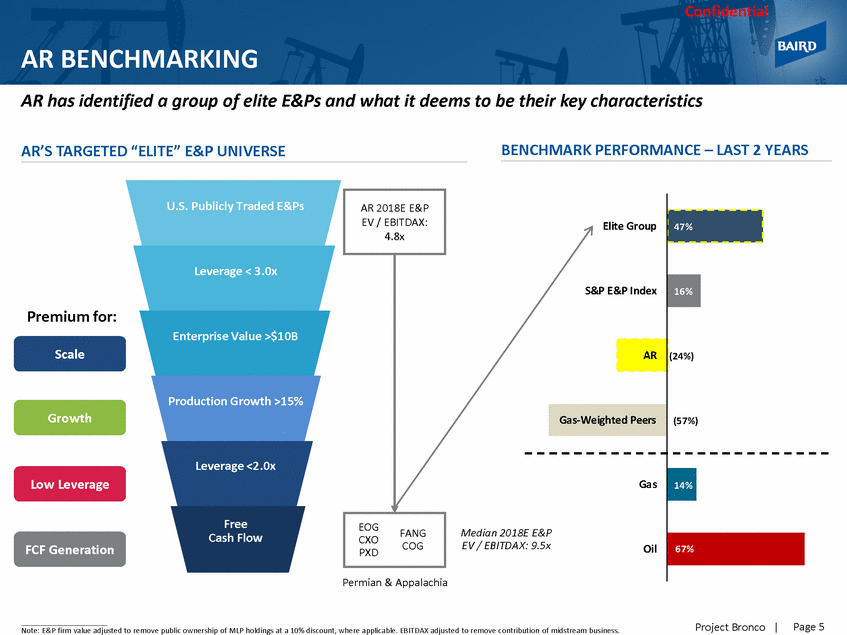
Confidential AR BENCHMARKING AR has identified a group of elite E&Ps and what it deems to be their key characteristics AR’S TARGETED “ELITE” E&P UNIVERSE BENCHMARK PERFORMANCE – LAST 2 YEARS U.S. Publicly Traded E&Ps Leverage < 3.0x Premium for: Enterprise Value >$10B Scale Production Growth >15% Growth Leverage <2.0x Low Leverage Free Cash Flow Median 2018 EV / EBITDAX: 9.5x FCF Generation Oil Permian & Appalachia Page 5 Project Bronco | Note: E&P firm value adjusted to remove public ownership of MLP holdings at a 10% discount, where applicable. EBITDAX adjusted to remove contribution of midstream business. EOG CXOFANG PXDCOG Elite Group S&P E&P Index 47% 16% (24%) (57%) AR Gas-Weighted Peers Gas E E&P 14% 67% AR 2018E E&P EV / EBITDAX: 4.8x
Confidential AR BENCHMARKING AR vs. Gas-Weigted Peers vs. Elite E&Ps across selected operational metrics AVG. FCF YIELD (’18-’21E) AVG. ROCE (‘18-’20E) 10% 9% 8% 7% 6% 5% 4% 3% 2% 1% 0% 14% 12% 10% 8% 6% 4% 2% 0% E lite Ga s Peers E lite Ga s Peers PRODUCTION GROWTH (2018-21) RESERVE LIFE (YRS) TOTAL PROVED (TCFE) % PDP (% of Reserves) 2017 YE Proved / 2018 E Production 70% 20% 20.0 18.0 16.0 14.0 12.0 10.0 8.0 6.0 4.0 2.0 0.0 20.0 18.0 16.0 14.0 12.0 10.0 8.0 6.0 4.0 2.0 0.0 60% 16% 50% 12% 40% 30% 8% 20% 4% 10% 0% 0% E lite Ga s Peers E lite Ga s Peers Elite Ga s Peers Elite Ga s Peers Page 6 Project Bronco | Source: Company filings, S&P Capital IQ and Wall Street research as of April 17, 2018. 19% 17% 11% 17.3 14.8 5.9 17.6 13.9 9.8 64% 54% 49% 9% 4% 1% 11% 6% 4% LTM CASH MARGINS ($/Mcfe) $4.00 $3.00 $2.00 $1.00 $0.00 E lite Ga s Peers $3.87 $1.28 $1.24 % OIL PRODUCTION (2018E) 75% 50% 25% 0% E lite Ga s Peers 60% 2% 2%
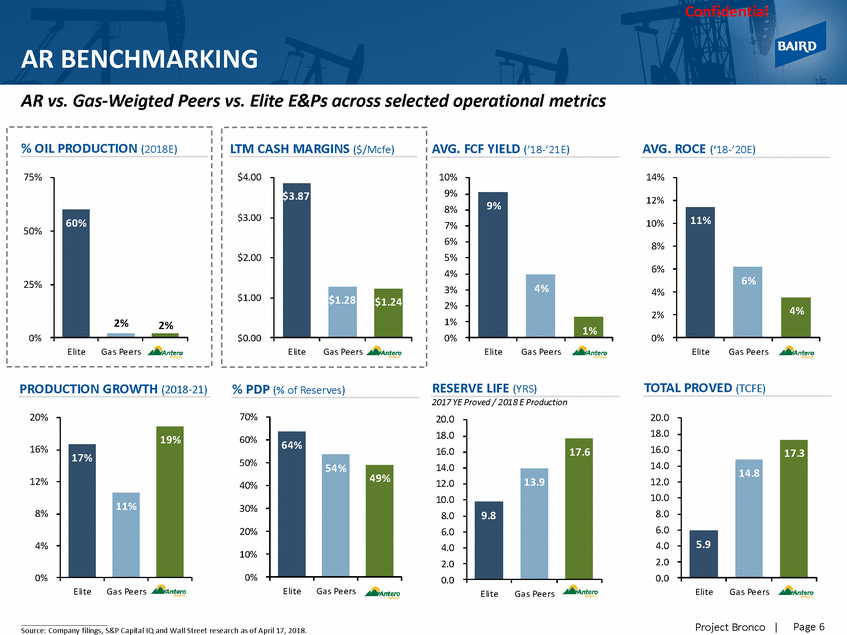
Confidential AR BENCHMARKING AR vs. Peers vs. Elite E&Ps across selected operational metrics E&P EV / 2018E EBITDAX E&P EV / 2018E DACF 10.0x 12.0x 10.0x 8.0x 8.0x 6.0x 6.0x 4.0x 4.0x 2.0x 2.0x 0.0x 0.0x E lite Ga s Peers E lite Ga s Peers PRICE / NAV CASH FLOW GROWTH E&P EV / CURRENT PROD. Per debt adjusted share ($ / Mmcfe/d) $10.0 1.2x 30% 25% $8.0 1.0x 20% $6.0 0.8x 15% $4.0 10% 0.6x $2.0 5% $0.0 0.4x 0% Elite Gas Peers Elite Ga s Peers Elite Ga s Peers Source: Company filings, S&P Capital IQ and Wall Street research as of April 17, 2018. Note: E&P firm value adjusted to remove public ownership of MLP holdings at a 10% discount, where applicable. EBITDAX and DCF adjusted to remove contribution of midstream business. Page 7 Project Bronco | $8.3 $2.9 $2.8 27% 20% 18% 1.0x 0.9x 0.9x E&P EV / PROVED ($ / Mcfe) $2.50 $2.00 $1.50 $1.00 $0.50 $0.00 EliteGas $2.36 $0.58 $0.38 9.7x 5.3x 5.0x 9.5x 5.2x 4.8x E&P ENTERPRISE VALUE ($ in billions) $30.0 $25.0 $20.0 $15.0 $10.0 $5.0 $0.0 E lite Ga s Peers $25.4 $7.6 $7.7 2018E LEVERAGE 3.0x 2.0x 1.0x 0.0x Elite Ga s Peers 2.3x 2.3x 0.8x
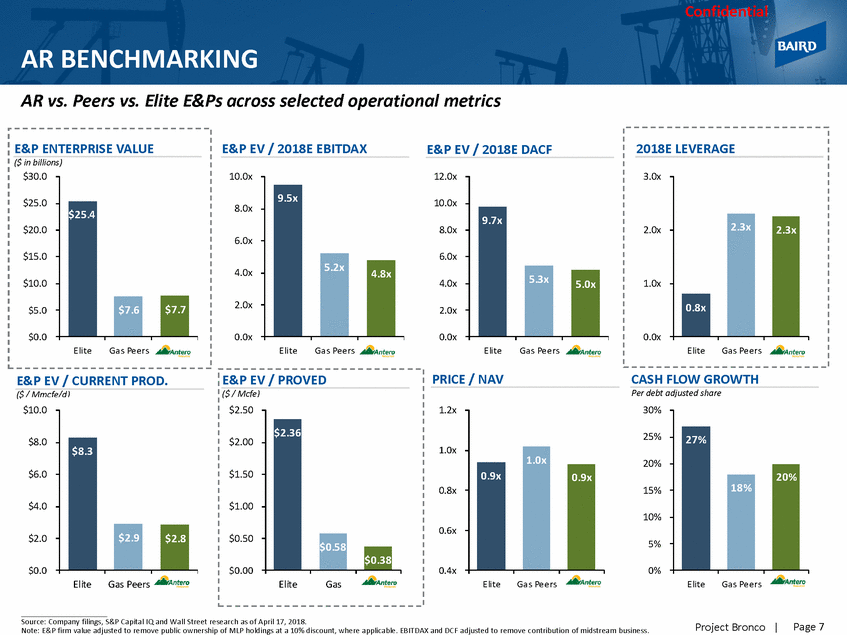
Confidential AR BENCHMARKING Additional relevant data GAS-WEIGHTED PEERS Short Interest Ratios 2018 Hedged Production % Insider Ownership Credit Rating Dividend Yield Buyback Program? Current vs. 1-Year Current (1) S&P Moody's Crude Gas P NA NA 1.0% 2.4 (28%) 0% 0% 1.5% BBB Ba a 3 0.2% 3.2 (35%) 0% 42% 0.6% P BB-B1 NA 3.4 47% NA 80% 8.5% Ba 2 BB+ 0.6% 8.3 81% 17% 57% 0.5% BB-Ba 3 NA 3.2 20% 0% 89% 0.6% ELITE E&P’s P NA NA 1.0% 2.4 (28%) 0% 0% 1.5% BBB-Ba 1 0.4% 1.8 (64%) 59% 33% 1.1% BB Ba 3 0.4% 2.9 (17%) 41% 26% 1.2% BBB+ Ba a 1 0.7% 2.3 (29%) 33% 1% 0.4% P BBB Ba a 2 0.3% 2.7 (12%) 84% 60% 0.9% Current Source: Bloomberg and Wall Street research as of April 17, 2018. (1)Days to cover. Page 8 Project Bronco | BB+Ba20.0%10.325%0%78%23.7%
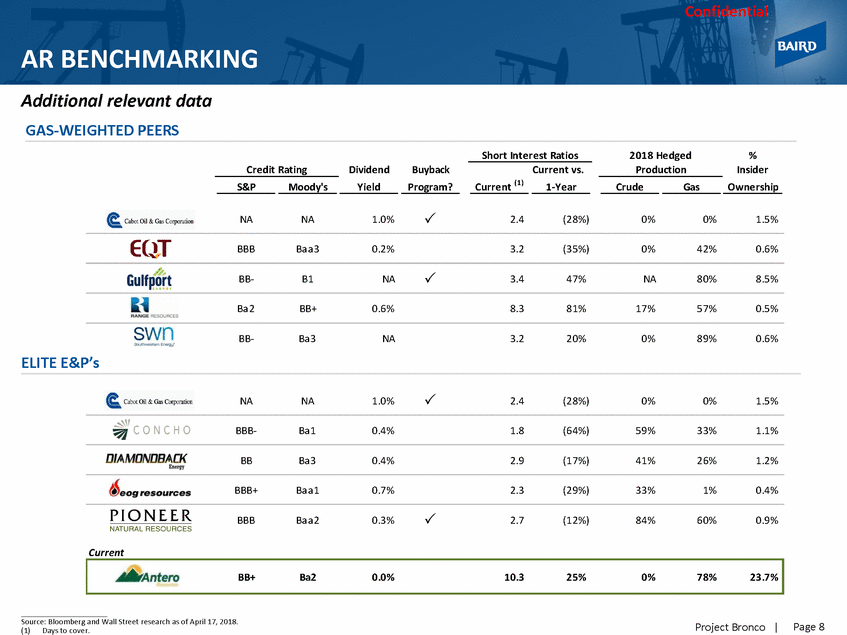
Confidential AR IDENTIFIED STEPS TO IMPROVE VALUATION The market has been receptive to AR’s operational and strategic initiatives to improve its share price (as evidenced by its recent outperformance); however, execution risk remains MARKET PERCEPTION AR’S IDENTIFIED STEPS TO JOIN THE ELITE E&P GROUP “We believe the focus should now shift to execution as the long term outlook has already baked in substantial future efficiency gains and activity high-grading which AR now has to deliver. – Credit Suisse “…five year plan that includes a double-digit production CAGR… should generate solid returns while throwing off $1.6 billion in free cash flow at the strip … a solid profile that with execution should drive multiple expansion over the coming years. – Wells Fargo “While increasing lateral length is a tangible efficiency, and concurrent operations should improve cycle times, it remains unclear how AR will be able to keep D&C spend flat through 2020 while increasing completed lateral feet by 12% in 2019 and 25% in 2020 compared to the 2018 program.– Jefferies FCF Generation: $1.6 Bn cumulative free cash flow growth through 2022 Capital Discipline: – – Reduce leverage to < 2x Debt-adjusted cash flow and production growth per share in the 22 – 23% range (AR management figure) “Operationally and financially, we would agree that AR is reaching the next stage of its life cycle, and at an opportune time.…At the upstream level, the E&P entity is reaching a level of scale, leverage, and capital efficiency (forward FCF generation and growth) matched by few US independents” – Evercore ISI Assess Value Acceleration Initiatives: – – – Return of Capital (repay debt, stock buy-back, dividends Conflict of interest mitigation Segment level reporting to provide clarity on E&P ops “Given the recent push for capital discipline and improved corporate returns, we think the market will view Antero’s newfound capital flexibility in the coming years favorably. – Raymond James Page 9 Project Bronco | Capital Efficiency: $2.9 billion of drilling capex reduction over next 5 years with production growth targets unchanged –Inventory of 3,300 laterals >10,000’ drive efficiencies –18% production CAGR 2018 – 2022 –Grow into FT portfolio by 2020 –Growing NGL exposure
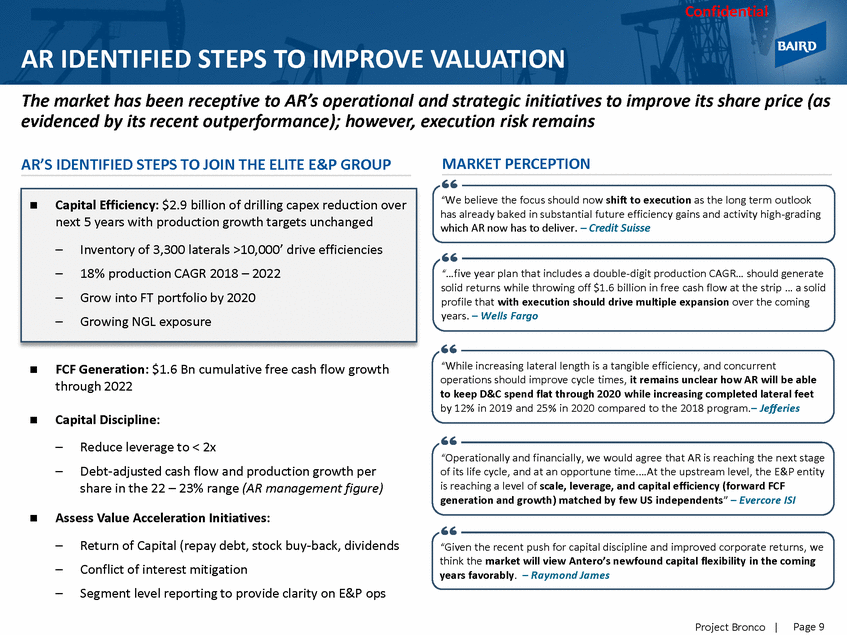
Confidential AR FORECAST SUMMARY ACROSS KEY METRICS PRODUCTION GROWTH (Mmcfe/d) E&P EBITDA and Margins ($ in millions) Ma nagement Consensus % Hedged 6,000 $2,323 $2,500 45% 5,000 $2,000 4,000 40% $1,500 3,000 $1,000 2,000 35% $500 1,000 0 $0 30% 2017A 2018E 2019E 2020E 2021E 2022E 2017A 2018E 2019E 2020E 2021E 2022E E&P FREE CASH FLOW (1) ($ in millions) DEBT & LEVERAGE Total FCF AR E& P $6,184 AM E&P FCF 5.0x AR E& P Distributions f rom AM $5,766 $5,522 $5,354 $500 $400 $300 $200 $100 $0 ($100) ($200) 4.0x 3.0x 2.0x nsolidated verage &P verage 1.0x 0.0x 2018E 2019E 2020E 2021E 2022E 2018E 2019E 2020E 2021E 2022E Source: Antero Management projections. (1)Free cash flow represents E&P operating cash flow, less E&P drilling and completion capital, less land maintenance capital. Page 10 Project Bronco | $170 $219 $405 $282 $282 $338 $108 ($150) ($28) $5,674 2.5x 2.4x 2.2x 1.9x Co Le E Le 2.7x 2.1x 1.6x 1.7x 1.2x 0.8x $19 $500 $287 $310 $513 ($150) $282 $5 ($28) $108 $1,967 $1,868 $1,832 35% 33% $1,604 38% 34% $1,115 40% 38% 5,194 4,545 5,200 3,945 4,536 3,330 3,881 2,702 3,275 2,253 2,682 95% 78%E&P EBIT7D0A% 3E6B%ITDA Mar1g6in% 16%
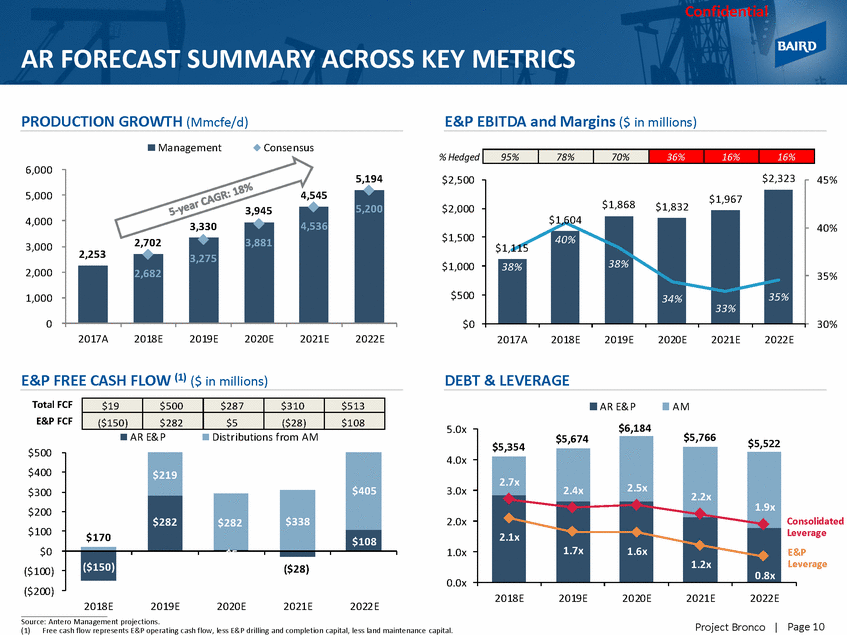
Confidential 2018 – 2022 AR FREE CASH FLOW BRIDGE • • • • • • Cash Flow from E&P Operations Plus: AM Distributions Plus: Water Earn-Out & Lawsuit Recoveries Less: Drilling Capital Expenditures Less: Changes in Working Capital Less: Leasehold Maintenance Expenditures $1,800 $1,600 $1,400 $1,200 $1,000 $800 $600 $400 $200 $0 ($200) ($400) AR Reported FCF Generation AM Distributions Water Earn-Out Lawsuit Damage Recoveries Isolated E&P FCF Page 11 Project Bronco | Source: Antero Management projections. $1,629 ($250) ($169) ($135) ($1,413) AR Free Cash Flow Definition
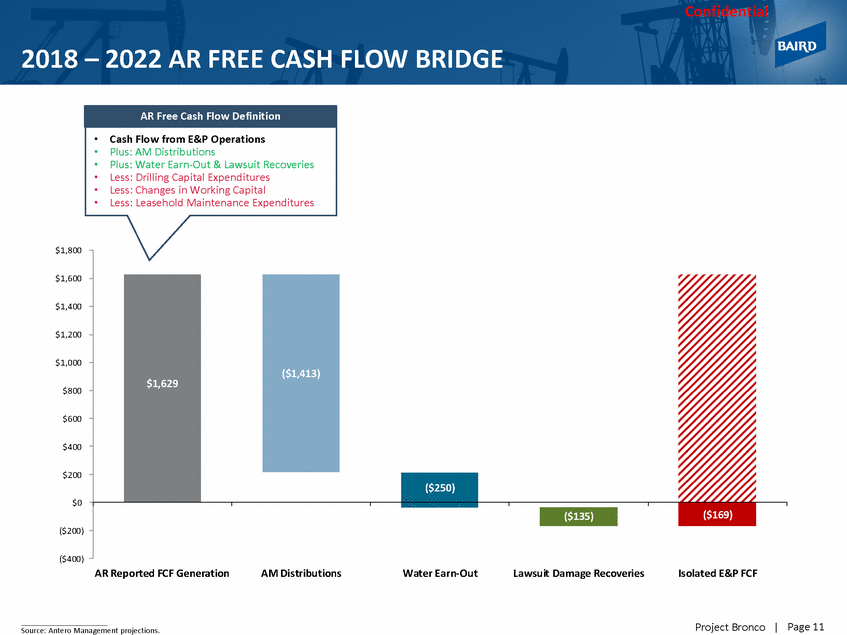
Confidential RETURN OF CAPITAL INITIATIVES POTENTIAL SHARE REPURCHASE ECONOMICS Drilling ROR (+29%) (+19%) Mgmt. SELECTED STOCK BUY-BACK ANNOUNCEMENTS & MARKET REACTION Announcement Date Buyback % of Company Value ($MM) Shares O/S 1-day 5-days 30-days 1-day 5-days 30-days 1-day 5-days 30-days 03/08/18 Hes s Corpora ti on $1,000 6.8% 0.5% 4.5% - (0.4%) 0.4% - 0.8% 4.1% - 03/07/18 Devon Energy 1,000 6.1% 4.7% 5.4% 16.6% (0.4%) 0.4% 12.0% 5.0% 5.0% 4.6% 02/28/18 QEP Res ources 1,250 60.2% 10.8% 4.5% 25.4% (0.1%) 0.8% 9.3% 10.9% 3.8% 16.1% 02/23/18 Ca bot Oi l 720 6.5% 2.4% 4.4% (3.0%) 2.9% (2.2%) 0.3% (0.4%) 6.6% (3.2%) 02/15/18 Nobl e Energy 750 5.8% (0.3%) 11.1% 14.5% (0.3%) (1.6%) 0.9% (0.0%) 12.7% 13.6% 02/15/18 Enca na Corpora ti on 400 3.7% (1.2%) (2.5%) 1.1% (0.3%) (1.6%) 0.9% (0.9%) (0.9%) 0.2% 02/14/18 La redo Petrol eum 200 10.4% 5.0% 6.7% 9.8% (0.3%) (1.6%) 0.9% 5.3% 8.3% 8.9% 02/06/18 Pi oneer 100 0.3% 1.3% (1.0%) 0.8% (1.8%) (5.2%) (0.5%) 3.1% 4.2% 1.4% 01/29/18 Gul fport Energy Corporati on 100 4.5% (8.9%) (24.3%) (11.0%) (2.6%) (8.6%) (12.0%) (6.3%) (15.8%) 1.1% Source: FactSet and S&P Capital IQ as of April 13, 2018. (1)Market reaction defined as one day post-announcement. (2)Relative performance based on S&P E&P 500 Index. Page 12 Project Bronco | Mean$61311.6%1.6%1.0%6.8%(0.4%)(2.2%)1.5%1.9%3.1%5.3% Median$7206.1%1.3%4.5%5.5%(0.3%)(1.6%)0.9%0.8%4.2%3.0% Market Reaction (1) Benchmark PerformanceRelative Performance (2) $51.60 $55.68 (+153%)(+173%) AR Full-Cycle 33% $20.39 $26.26 $24.21 59% 40% 28% 9% 9% AR Today AR 2020AR 2021 No Multiple Expansion AR 2020AR 2021 Elite Multiples Group Per AR Implied Share PriceAnnualized Returns
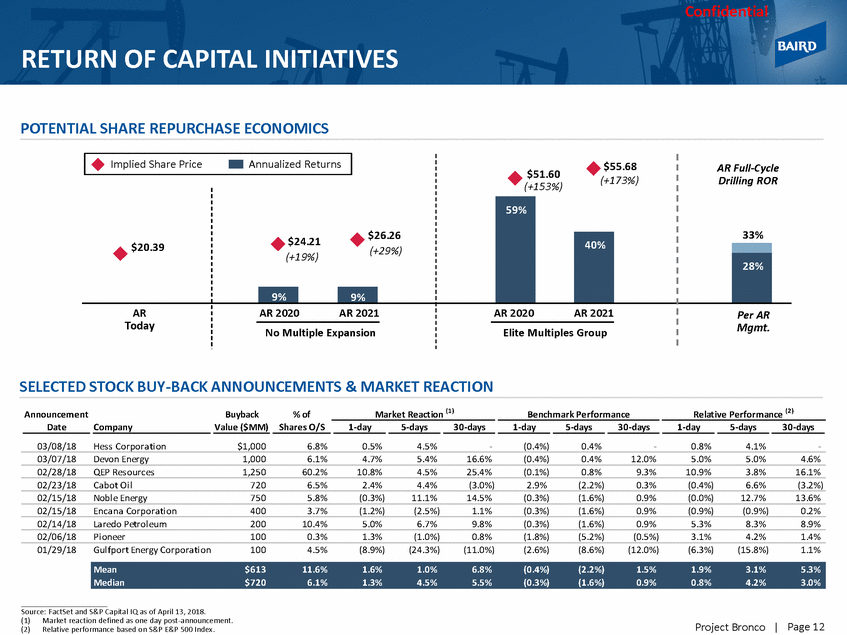
Confidential AR RESEARCH COVERAGE Firm Pre-13D Filing Post-13D Filing % Change Credi t Sui s s e $23.00 $24.00 4.3% Wol fe Res ea rch 25.00 24.00 (4.0%) BMO Ca pi ta l 24.00 23.00 (4.2%) Evercore 23.00 24.00 4.3% Tudor Pi ckeri ng 30.00 25.00 (16.7%) Keyba nc 29.00 29.00 0.0% Jefferi es 22.00 23.00 4.5% Guggenhei m 27.00 27.00 0.0% Ra ymond Ja mes 24.00 24.00 0.0% Sus queha nna Fi na nci a l 24.00 24.00 0.0% Suntrus t Robi ns on 23.00 23.00 0.0% Morga n Sta nl ey 20.00 20.00 0.0% Page 13 Project Bronco | Source: Bloomberg. Target Price Increases 3 Target Price Decreases 8 Unchanged Targets 12 High $34.00 $24.00 4.5% Median 25.00 24.00 0.0% Low 20.00 20.00 (18.8%) Al embi c Gl oba l 34.00 34.00 0.0% MUFG Securi ti es 29.00 28.00 (3.4%) Wel l s Fa rgo 20.00 20.00 0.0% J.P. Morga n 25.00 24.00 (4.0%) Stephens Inc 32.00 26.00 (18.8%) Cowen 22.00 22.00 0.0% KLR Group 29.00 29.00 0.0% Ba i rd 28.00 28.00 0.0% Scoti a Howa rd Wei l 26.00 24.00 (7.7%) Gol dma n Sa chs 22.00 22.00 0.0% Ca pi ta l One 31.00 29.00 (6.5%)
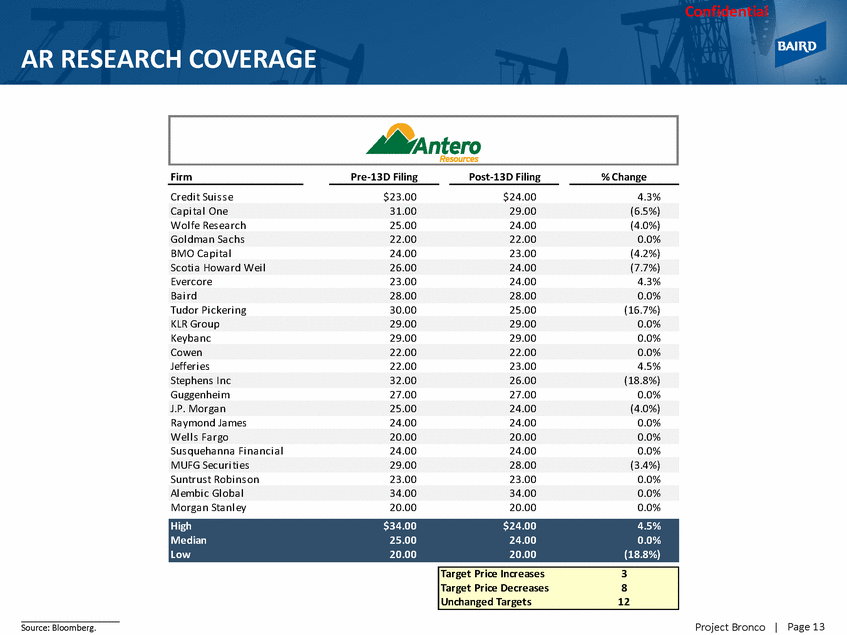
Confidential RETURN OF CAPITAL INITIATIVES (CONT.) Debt reduction to achieve investment grade status is a worthy use of capital for AR: Investment grade E&P’s increasingly outperform the broader group over time INVESTMENT GRADE E&P PERFORMANCE VS. OVERALL INDEX 60% 30% 0% (30%) (60%) 60% 30% 0% (30%) (60%) 60% 30% 0% (30%) (60%) Page 14 Project Bronco | 3-Year +6,193 bps +2,790 bps +1,244 bps Investment Grade E&P Index S&P E&P Index
Confidential AM / AMGP MARKET & VALUATION PERSPECTIVES Project Bronco |
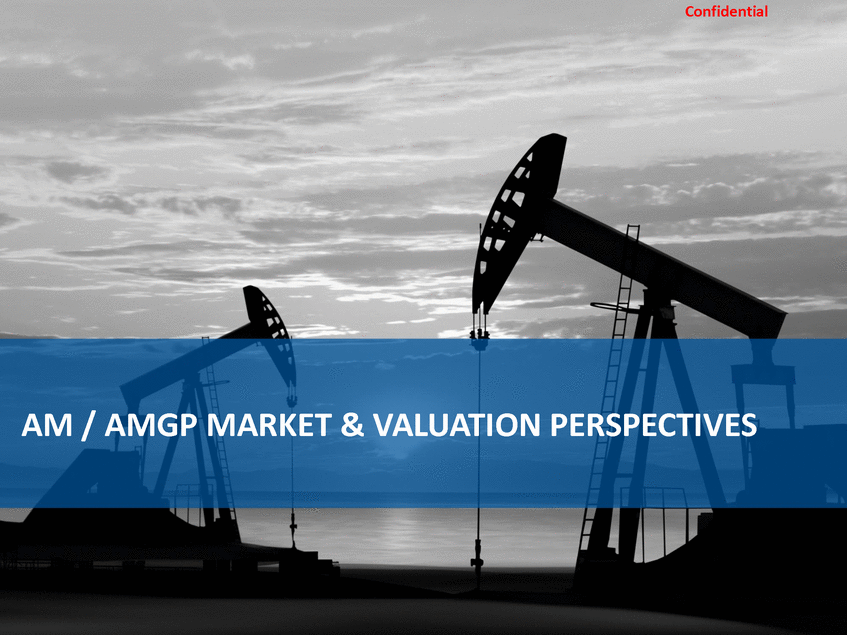
Confidential ANTERO FAMILY PRICE PERFORMANCE – LAST 6 MONTHS AR AM AMGP Alerian Index 15% 10% 5% 4% AR 0% (5%) (7%) AMZ (10%) (12%) AM (13%) AMGP (15%) (20%) (25%) 10/16/17 11/15/17 12/16/17 01/15/18 02/15/18 03/17/18 04/17/18 Page 15 Project Bronco | Source: S&P Capital IQ and SEC filings as of April 17, 2018. 1/29/18: Sailing Stone files 13D 1/18/18: Analyst Day 2/26/18: Announced formation of Special Committee 11/29/17: Analyst Day announcement 13D Filing - Present AR AM AMGP AMZ 2.0% (18.7%) (22.1%) (13.6%) Analyst Day - 13D Filing AR AM AMGP AMZ 1.1% 7.0% 5.4% 1.9% Analyst Day Announced - Analyst Day AR AM AMGP AMZ 6.7% 18.8% 20.2% 16.7%
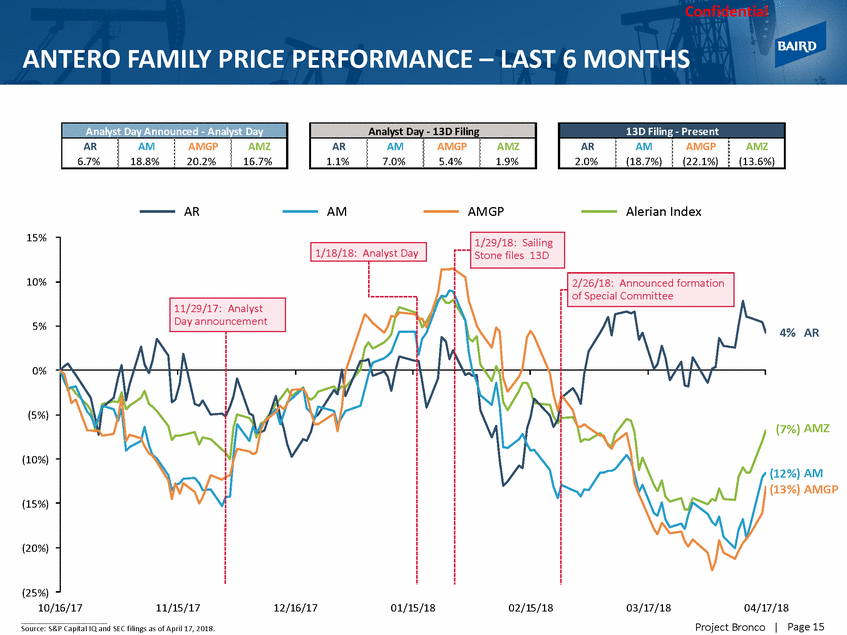
Confidential AM MARKET AND VALUATION DATA PRICE PERFORMANCE SINCE 01/01/18 AM MARKET AND VALUATION METRICS (in millions, except per unit data) AM AMZ AMG P Pre-Sailing Stone 13-D 01/26/18 20% Current 15% 04/17/18 Uni t Pri ce $33.13 $26.92 10% Equi ty Ma rket Ca p. $6,193 $5,032 5% Enterpri s e Va l ue $7,381 $6,220 0% (5%) (7%) (5%) (10%) (13%) (15%) (20%) Net Debt / 2018E EBITDA 1.65x 1.65x (25%) 2018E DCF / Current Di s t. (2) 1.64x 1.58x 01/01/18 01/22/18 02/12/18 03/05/18 03/26/18 04/17/18 2018E Adj . EBITDA (2)(3) $624 $624 2018 KEY EVENTS 2019E Adj . EBITDA (2)(3) $835 $835 01/18/18 Antero hos ts Anal ys t Day Distribution CAGR 2017A - 2020E 01/29/18 Sai l i ng Stone Fi l es 13-D 27.5% 27.9% 2018E - 2021E 21.7% 21.8% 02/13/18 Antero Fami l y reports 4Q a nd ful l year 2017 res ul ts 02/26/18 Announced formati on of Speci al Commi ttees Source: S&P Capital IQ, Bloomberg and Wall Street Research as of April 17, 2018. (1) (2) (3) Defined as Distributable Cash Flow, per Wall Street consensus estimates, divided by Equity Market Cap. Wall Street consensus estimates. EBITDA less IDR distributions to sponsor. Page 16 Project Bronco | 2018E DCF Yi el d (1) 9.8% 11.6% 2019E DCF Yi el d (1) 11.8% 14.9% EV / 2018E Adj . EBITDA 11.8x 10.0x EV / 2019E Adj . EBITDA 8.8x 7.4x Current Yi el d 4.4% 5.4% Sailing Stone 13-D: 01/29/18
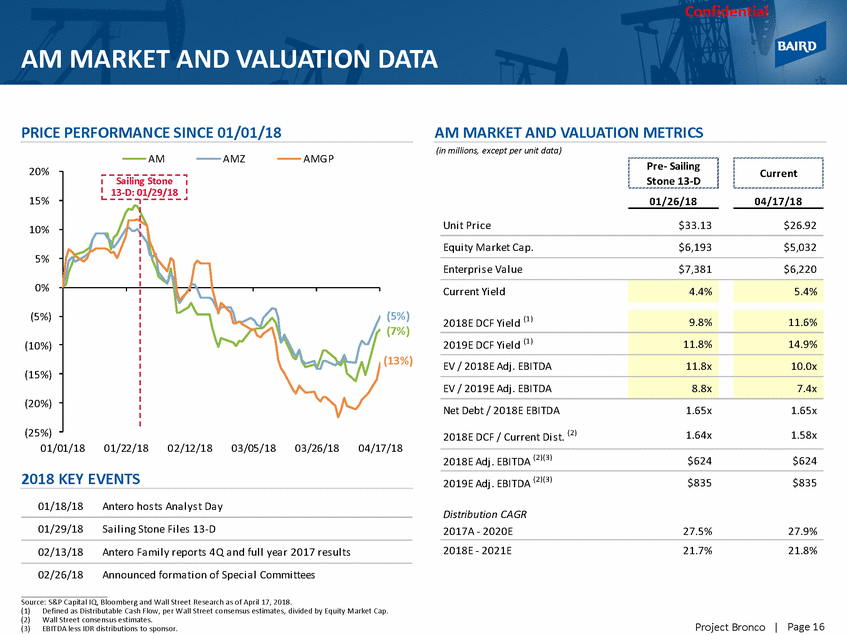
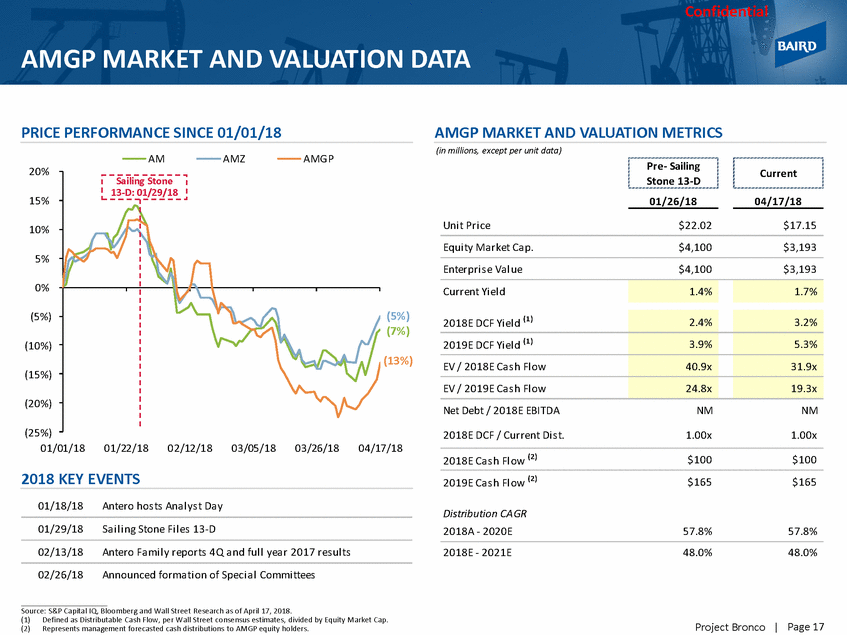
Confidential AMGP MARKET AND VALUATION DATA PRICE PERFORMANCE SINCE 01/01/18 AMGP MARKET AND VALUATION METRICS (in millions, except per unit data) AM AMZ AMG P Pre-Sailing Stone 13-D 01/26/18 20% Current 15% 04/17/18 Uni t Pri ce $22.02 $17.15 10% Equi ty Ma rket Ca p. $4,100 $3,193 5% Enterpri s e Va l ue $4,100 $3,193 0% (5%) (7%) (5%) (10%) (13%) (15%) (20%) Net Debt / 2018E EBITDA NM NM (25%) 2018E DCF / Current Di s t. 1.00x 1.00x 01/01/18 01/22/18 02/12/18 03/05/18 03/26/18 04/17/18 2018E Ca s h Fl ow (2) $100 $100 2018 KEY EVENTS 2019E Ca s h Fl ow (2) $165 $165 01/18/18 Antero hos ts Anal ys t Day Distribution CAGR 2018A - 2020E 01/29/18 Sai l i ng Stone Fi l es 13-D 57.8% 57.8% 02/13/18 Antero Fami l y reports 4Q a nd ful l year 2017 res ul ts 2018E - 2021E 48.0% 48.0% 02/26/18 Announced formati on of Speci al Commi ttees Source: S&P Capital IQ, Bloomberg and Wall Street Research as of April 17, 2018. (1)Defined as Distributable Cash Flow, per Wall Street consensus estimates, divided by Equity Market Cap. (2)Represents management forecasted cash distributions to AMGP equity holders. Page 17 Project Bronco | 2018E DCF Yi el d (1) 2.4% 3.2% 2019E DCF Yi el d (1) 3.9% 5.3% EV / 2018E Ca s h Fl ow 40.9x 31.9x EV / 2019E Ca s h Fl ow 24.8x 19.3x Current Yi el d 1.4% 1.7% Sailing Stone 13-D: 01/29/18
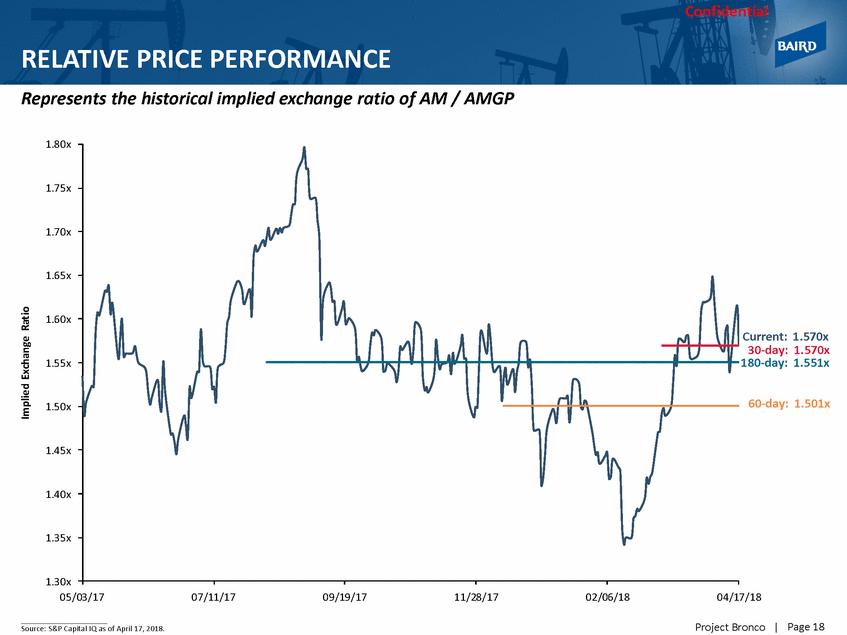
Confidential RELATIVE PRICE PERFORMANCE Represents the historical implied exchange ratio of AM / AMGP 1.80x 1.75x 1.70x 1.65x 1.60x Current: 1.570x 30-day: 1.570x 180-day: 1.551x 1.55x 60-day: 1.501x 1.50x 1.45x 1.40x 1.35x 1.30x 05/03/17 07/11/17 09/19/17 11/28/17 02/06/18 04/17/18 Page 18 Project Bronco | Source: S&P Capital IQ as of April 17, 2018. Implied Exchange Ratio
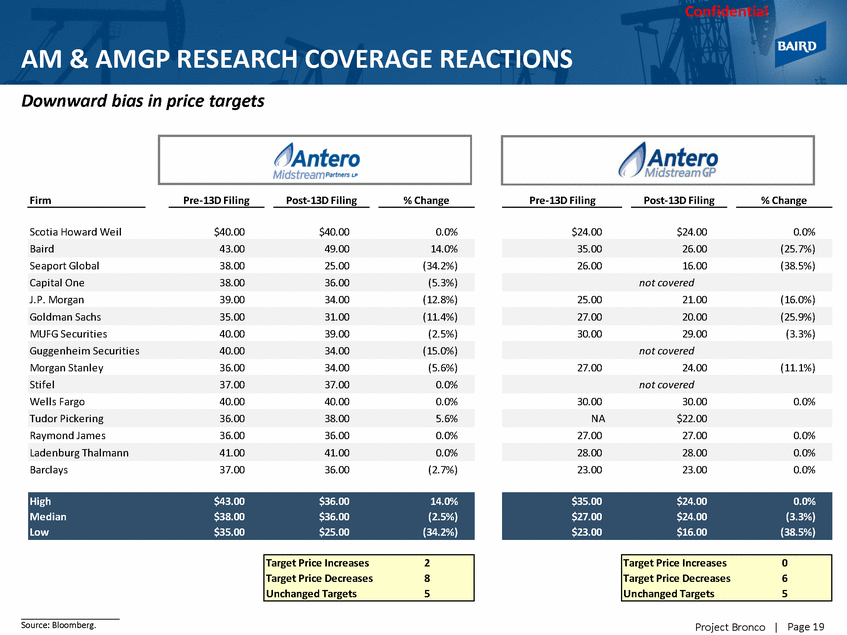
Confidential AM & AMGP RESEARCH COVERAGE REACTIONS Downward bias in price targets Firm Pre-13D Filing Post-13D Filing % Change Pre-13D Filing Post-13D Filing % Change Scotia Howard Weil $40.00 $40.00 0.0% $24.00 $24.00 0.0% Seaport Global 38.00 25.00 (34.2%) 26.00 16.00 (38.5%) J.P. Morgan 39.00 34.00 (12.8%) 25.00 21.00 (16.0%) MUFG Securities 40.00 39.00 (2.5%) 30.00 29.00 (3.3%) Morgan Stanley 36.00 34.00 (5.6%) 27.00 24.00 (11.1%) Wells Fargo 40.00 40.00 0.0% 30.00 30.00 0.0% Raymond James 36.00 36.00 0.0% 27.00 27.00 0.0% Barclays 37.00 36.00 (2.7%) 23.00 23.00 0.0% Source: Bloomberg. Page 19 Project Bronco | Target Price Increases 0 Target Price Decreases 6 Unchanged Targets 5 Target Price Increases 2 Target Price Decreases 8 Unchanged Targets 5 $35.00 $24.00 0.0% $27.00 $24.00 (3.3%) $23.00 $16.00 (38.5%) High $43.00 $36.00 14.0% Median $38.00 $36.00 (2.5%) Low $35.00 $25.00 (34.2%) 28.00 28.00 0.0% Ladenburg Thalmann 41.00 41.00 0.0% NA $22.00 Tudor Pickering 36.00 38.00 5.6% not covered Stifel 37.00 37.00 0.0% not covered Guggenheim Securities 40.00 34.00 (15.0%) 27.00 20.00 (25.9%) Goldman Sachs 35.00 31.00 (11.4%) not covered Capital One 38.00 36.00 (5.3%) 35.00 26.00 (25.7%) Baird 43.00 49.00 14.0%
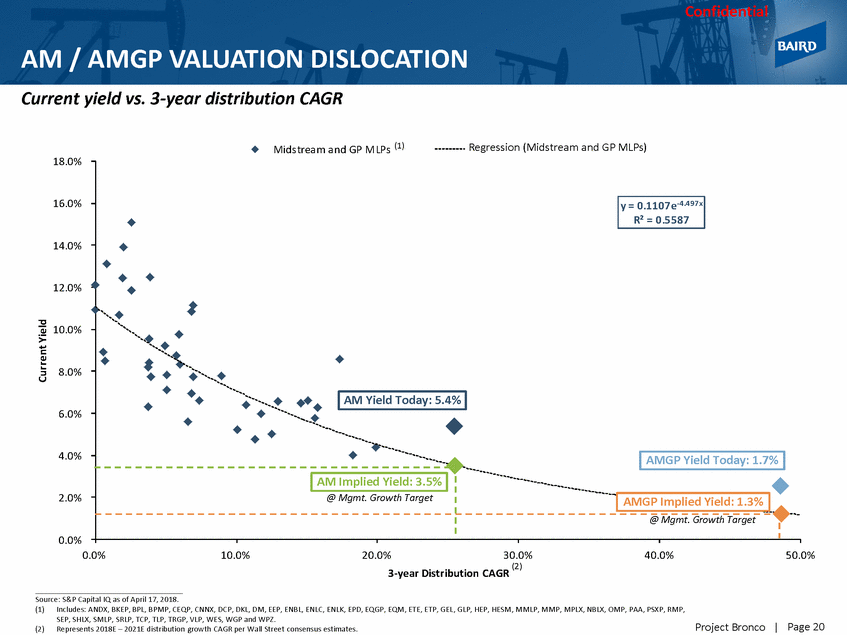
Confidential AM / AMGP VALUATION DISLOCATION Current yield vs. 3-year distribution CAGR Mids trea m a nd GP M LPs (1) RExepgorens.s(iMonid(sMtrideastmreaanmdaGnPdMGPLPMs)LPs) 18.0% 16.0% 14.0% 12.0% 10.0% 8.0% 6.0% 4.0% 2.0% 0.0% 0.0% 10.0% 20.0% 30.0% 40.0% 50.0% (2) 3-year Distribution CAGR Source: S&P Capital IQ as of April 17, 2018. (1)Includes: ANDX, BKEP, BPL, BPMP, CEQP, CNNX, DCP, DKL, DM, EEP, ENBL, ENLC, ENLK, EPD, EQGP, EQM, ETE, ETP, GEL, GLP, HEP, HESM, MMLP, MMP, MPLX, NBLX, OMP, PAA, PSXP, RMP, SEP, SHLX, SMLP, SRLP, TCP, TLP, TRGP, VLP, WES, WGP and WPZ. (2)Represents 2018E – 2021E distribution growth CAGR per Wall Street consensus estimates. Page 20 Project Bronco | Current Yield @ Mgmt. Growth Target @ Mgmt. Growth Target AMGP Implied Yield: 1.3% AM Implied Yield: 3.5% AMGP Yield Today: 1.7% AM Yield Today: 5.4% y = 0.1107e-4.497x R² = 0.5587
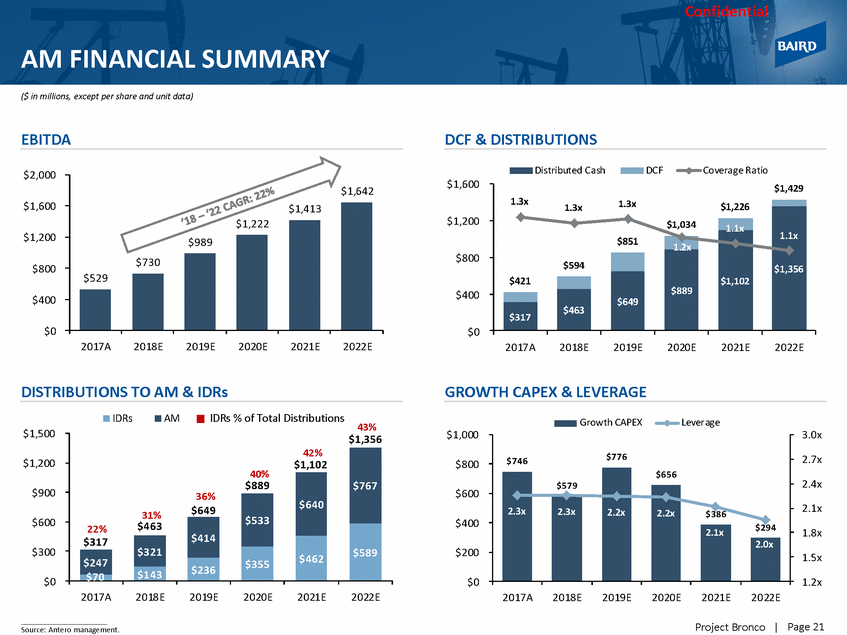
Confidential AM FINANCIAL SUMMARY ($ in millions, except per share and unit data) EBITDA DCF & DISTRIBUTIONS Distributed Cash DCF Coverage Ratio $2,000 $1,600 1.3x 1.3x $1,600 $1,226 1.3x $1,200 $1,200 $800 $800 $400 $400 $0 $0 2017A 2018E 2019E 2020E 2021E 2022E 2017A 2018E 2019E 2020E 2021E 2022E DISTRIBUTIONS TO AM & IDRs GROWTH CAPEX & LEVERAGE IDRs % of Total Distributions IDRs AM Growth CAPEX Lever age 43% $1,500 $1,000 3.0x 2.7x $746 $1,200 $800 2.4x $889 $900 $600 2.1x $600 $400 1.8x $300 $200 1.5x $0 $0 1.2x 2017A 2018E 2019E 2020E 2021E 2022E 2017A 2018E 2019E 2020E 2021E 2022E Page 21 Project Bronco | Source: Antero management. $776 2.2x $656 2.3x $579 2.2x $386 2.3x 2.1x $294 2.0x $1,356 42% $1,102 $767 40% $640 36% 31%$649 $533 22%$463 $414 $589 $462 $317 $321 $355 $236 $143 $247 $1,429 1.1x $1,356 $1,034 $1,102 $851 $594 $889 $649 $421 $463 $317 $1,642 $1,413 $1,222 $989 $730 $529
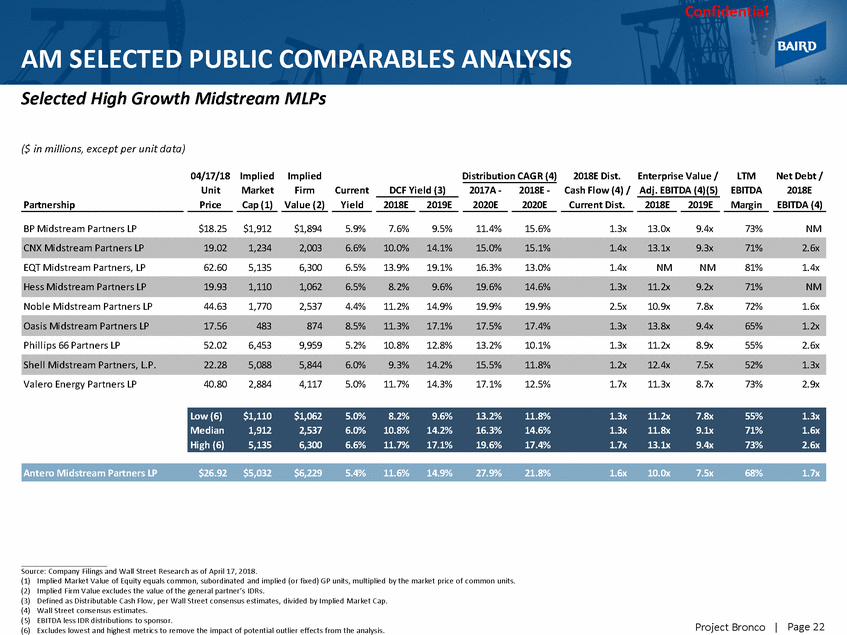
Confidential AM SELECTED PUBLIC COMPARABLES Selected High Growth Midstream MLPs ANALYSIS ($ in millions, except per unit data) 04/17/18 Implied Implied Distribution CAGR (4) 2018E Dist. Enterprise Value / LTM Net Debt / Unit Market Firm Current DCF Yield (3) 2017A - 2018E - Cash Flow (4) / Adj. EBITDA (4)(5) EBITDA 2018E Partnership Price Cap (1) Value (2) Yield 2018E 2019E 2020E 2020E Current Dist. 2018E 2019E Margin EBITDA (4) BP Midstream Partners LP $18.25 $1,912 $1,894 5.9% 7.6% 9.5% 11.4% 15.6% 1.3x 13.0x 9.4x 73% NM EQT Midstream Partners, LP 62.60 5,135 6,300 6.5% 13.9% 19.1% 16.3% 13.0% 1.4x NM NM 81% 1.4x Noble Midstream Partners LP 44.63 1,770 2,537 4.4% 11.2% 14.9% 19.9% 19.9% 2.5x 10.9x 7.8x 72% 1.6x Phillips 66 Partners LP 52.02 6,453 9,959 5.2% 10.8% 12.8% 13.2% 10.1% 1.3x 11.2x 8.9x 55% 2.6x Valero Energy Partners LP 40.80 2,884 4,117 5.0% 11.7% 14.3% 17.1% 12.5% 1.7x 11.3x 8.7x 73% 2.9x Source: Company Filings and Wall Street Research as of April 17, 2018. (1) (2) (3) (4) (5) (6) Implied Market Value of Equity equals common, subordinated and implied (or fixed) GP units, multiplied by the market price of common units. Implied Firm Value excludes the value of the general partner’s IDRs. Defined as Distributable Cash Flow, per Wall Street consensus estimates, divided by Implied Market Cap. Wall Street consensus estimates. EBITDA less IDR distributions to sponsor. Excludes lowest and highest metrics to remove the impact of potential outlier effects from the analysis. Page 22 Project Bronco | Antero Midstream Partners LP $26.92 $5,032 $6,229 5.4% 11.6% 14.9% 27.9% 21.8% 1.6x 10.0x 7.5x 68% 1.7x Low (6) $1,110 $1,062 5.0% 8.2% 9.6% 13.2% 11.8% 1.3x 11.2x 7.8x 55% 1.3x Median 1,912 2,537 6.0% 10.8% 14.2% 16.3% 14.6% 1.3x 11.8x 9.1x 71% 1.6x High (6) 5,135 6,300 6.6% 11.7% 17.1% 19.6% 17.4% 1.7x 13.1x 9.4x 73% 2.6x Shell Midstream Partners, L.P. 22.28 5,088 5,844 6.0% 9.3% 14.2% 15.5% 11.8% 1.2x 12.4x 7.5x 52% 1.3x Oasis Midstream Partners LP 17.56 483 874 8.5% 11.3% 17.1% 17.5% 17.4% 1.3x 13.8x 9.4x 65% 1.2x Hess Midstream Partners LP 19.93 1,110 1,062 6.5% 8.2% 9.6% 19.6% 14.6% 1.3x 11.2x 9.2x 71% NM CNX Midstream Partners LP 19.02 1,234 2,003 6.6% 10.0% 14.1% 15.0% 15.1% 1.4x 13.1x 9.3x 71% 2.6x
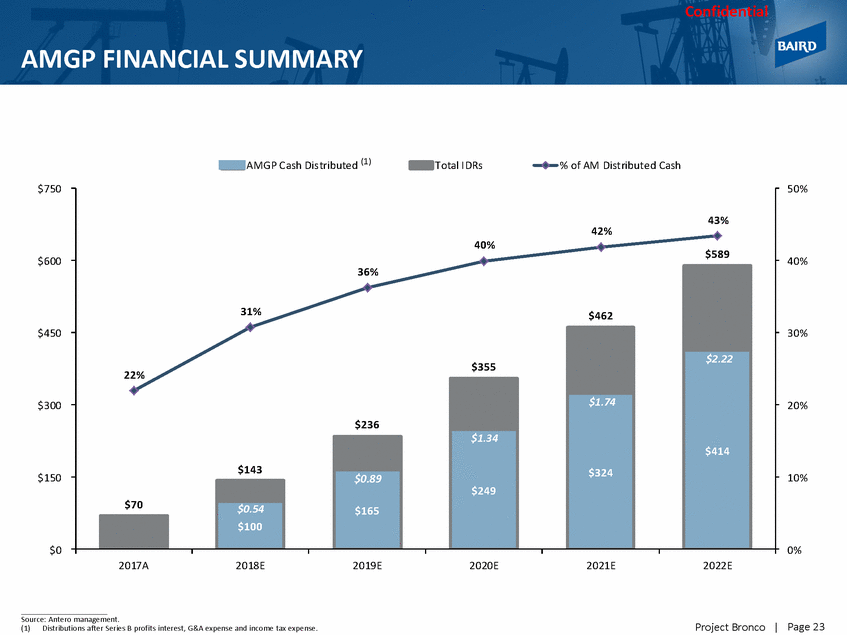
Confidential AMGP FINANCIAL SUMMARY AMG P C ash Dis tributed (1) Total IDRs % of AM Distributed Cash $750 50% 42% $600 40% $450 30% 22% $300 20% $150 10% $0 0% 2017A 2018E 2019E 2020E 2021E 2022E Source: Antero management. (1)Distributions after Series B profits interest, G&A expense and income tax expense. Page 23 Project Bronco | 43% 40% $589 36% 31% $462 $355 $2.22 $414 $236 $1.74 $324 $1.34 $249 $143 $0.89 $165 $70 $0.54 $100
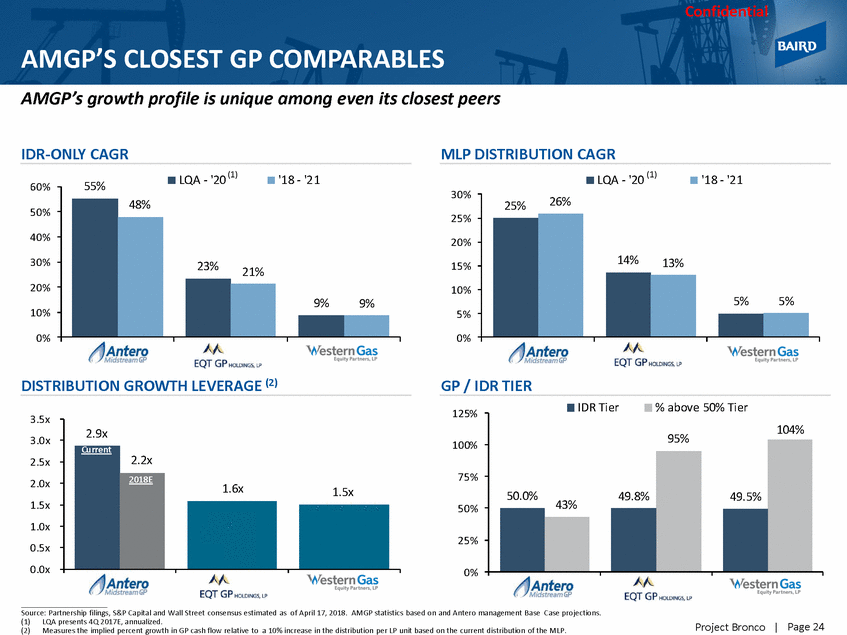
Confidential AMGP’S CLOSEST GP COMPARABLES AMGP’s growth profile is unique among even its closest peers IDR-ONLY CAGR MLP DISTRIBUTION CAGR (1) (1) LQA - '20 '18 - '21 LQA - '20 '18 - '21 55% 60% 30% 50% 25% 40% 20% 30% 15% 20% 10% 10% 5% 0% 0% AMG P EQG P WGP AMG P EQG P WGP DISTRIBUTION GROWTH LEVERAGE (2) GP / IDR TIER IDR Tier % above 50% Tier 125% 3.5x 3.0x 2.5x 2.0x 1.5x 1.0x 0.5x 0.0x 100% 75% 49.8% 50% 25% 0% AMG P EQG P WGP AMG P EQG P WGP Source: Partnership filings, S&P Capital and Wall Street consensus estimated as of April 17, 2018. AMGP statistics based on and Antero management Base Case projections. (1)LQA presents 4Q 2017E, annualized. (2)Measures the implied percent growth in GP cash flow relative to a 10% increase in the distribution per LP unit based on the current distribution of the MLP. Page 24 Project Bronco | 2.9x Current 2.2x 2018E 1.6x 1.5x 95% 104% 50.0% 43% 49.5% 25% 26% 14% 13% 5% 5% 48% 23% 21% 9% 9%
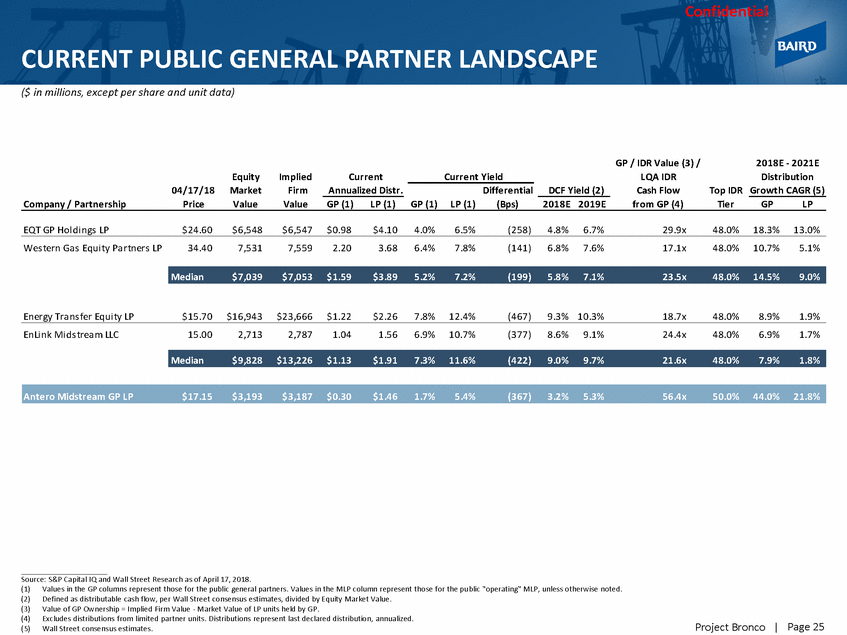
Confidential CURRENT PUBLIC GENERAL PARTNER LANDSCAPE ($ in millions, except per share and unit data) GP / IDR Value (3) / LQA IDR Cash Flow 2018E - 2021E Distribution Top IDR Growth CAGR (5) Equity Market Implied Firm Current Annualized Distr. Current Yield 04/17/18 Differential DCF Yield (2) Company / Partnership Price Value Value GP (1) LP (1) GP (1) LP (1) (Bps) 2018E 2019E from GP (4) Tier GP LP EQT GP Hol di ngs LP $24.60 $6,548 $6,547 $0.98 $4.10 4.0% 6.5% (258) 4.8% 6.7% 29.9x 48.0% 18.3% 13.0% Wes tern Ga s Equi ty Pa rtners LP 34.40 7,531 7,559 2.20 3.68 6.4% 7.8% (141) 6.8% 7.6% 17.1x 48.0%10.7% 5.1% Energy Tra ns fer Equi ty LP $15.70 $16,943 $23,666 $1.22 $2.26 7.8% 12.4% (467) 9.3% 10.3% 18.7x 48.0% 8.9% 1.9% EnLi nk Mi ds trea m LLC 15.00 2,713 2,787 1.04 1.56 6.9% 10.7% (377) 8.6% 9.1% 24.4x 48.0% 6.9% 1.7% Source: S&P Capital IQ and Wall Street Research as of April 17, 2018. (1) (2) (3) (4) (5) Values in the GP columns represent those for the public general partners. Values in the MLP column represent those for the public "operating" MLP, unless otherwise noted. Defined as distributable cash flow, per Wall Street consensus estimates, divided by Equity Market Value. Value of GP Ownership = Implied Firm Value - Market Value of LP units held by GP. Excludes distributions from limited partner units. Distributions represent last declared distribution, annualized. Wall Street consensus estimates. Page 25 Project Bronco | Antero Midstream GP LP$17.15$3,193$3,187$0.30$1.461.7%5.4%(367)3.2%5.3%56.4x50.0%44.0%21.8% Median$9,828$13,226$1.13$1.917.3%11.6%(422)9.0%9.7%21.6x48.0%7.9%1.8% Median$7,039$7,053$1.59$3.895.2%7.2%(199)5.8%7.1%23.5x48.0%14.5%9.0%
Confidential APPENDIX Project Bronco |
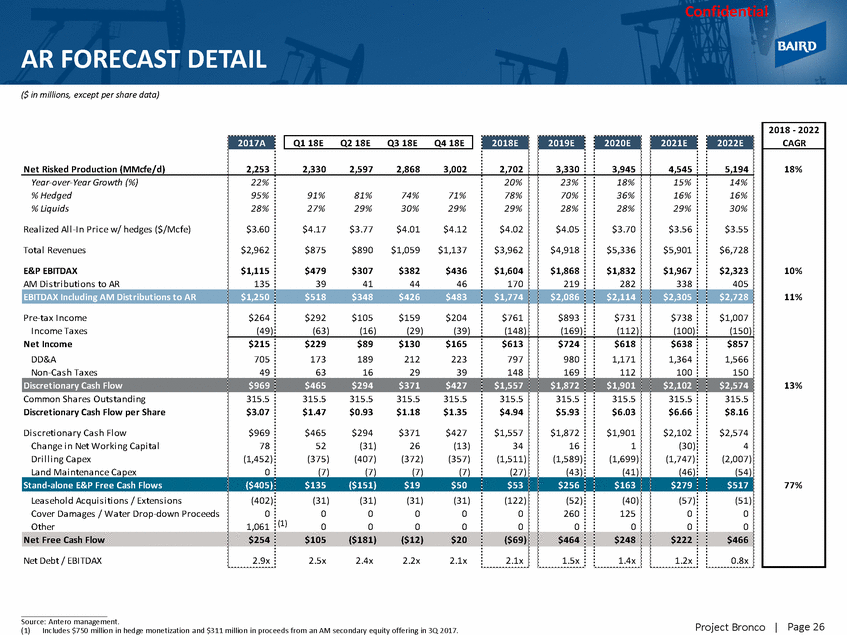
Confidential AR FORECAST DETAIL ($ in millions, except per share data) Net Risked Production (MMcfe/d) 2,253 2,330 2,597 2,868 3,002 2,702 3,330 3,945 4,545 5,194 Year-over-Year Growth (%) % Hedged % Liquids Rea l i zed Al l -In Pri ce w/ hedges ($/Mcfe) 22% 95% 28% $3.60 20% 78% 29% $4.02 23% 70% 28% $4.05 18% 36% 28% $3.70 15% 16% 29% $3.56 14% 16% 30% $3.55 91% 27% $4.17 81% 29% $3.77 74% 30% $4.01 71% 29% $4.12 Tota l Revenues $2,962 $875 $890 $1,059 $1,137 $3,962 $4,918 $5,336 $5,901 $6,728 E&P EBITDAX AM Di s tri buti ons to AR $1,115 135 $479 39 $307 41 $382 44 $436 46 $1,604 170 $1,868 219 $1,832 282 $1,967 338 $2,323 405 Pre-ta x Income Income Ta xes Net Income DD&A Non-Ca s h Ta xes $264 $292 $105 $159 $204 $761 $893 $731 $738 $1,007 (49) (63) (16) (29) (39) (148) (169) (112) (100) (150) $215 705 49 $229 173 63 $89 189 16 $130 212 29 $165 223 39 $613 797 148 $724 980 169 $618 1,171 112 $638 1,364 100 $857 1,566 150 Discretionary Cash Flow $969 $465 $294 $371 $427 $1,557 $1,872 $1,901 $2,102 $2,574 Common Sha res Outs ta ndi ng Discretionary Cash Flow per Share Di s creti ona ry Ca s h Fl ow Cha nge i n Net Worki ng Ca pi ta l Dri l l i ng Ca pex La nd Ma i ntena nce Ca pex 315.5 $3.07 $969 78 (1,452) 0 315.5 $1.47 $465 52 (375) (7) 315.5 $0.93 $294 (31) (407) (7) 315.5 $1.18 $371 26 (372) (7) 315.5 $1.35 $427 (13) (357) (7) 315.5 $4.94 $1,557 34 (1,511) (27) 315.5 $5.93 $1,872 16 (1,589) (43) 315.5 $6.03 $1,901 1 (1,699) (41) 315.5 $6.66 $2,102 (30) (1,747) (46) 315.5 $8.16 $2,574 4 (2,007) (54) Stand-alone E&P Free Cash Flows ($405) $135 ($151) $19 $50 $53 $256 $163 $279 $517 Lea s ehol d Acqui s i ti ons / Extens i ons Cover Dama ges / Wa ter Drop-down Proceeds Other (402) 0 1,061 (31) 0 0 (31) 0 0 (31) 0 0 (31) 0 0 (122) 0 0 (52) 260 0 (40) 125 0 (57) 0 0 (51) 0 0 (1) Net Free Cash Flow $254 $105 ($181) ($12) $20 ($69) $464 $248 $222 $466 Net Debt / EBITDAX 2.9x 2.5x 2.4x 2.2x 2.1x 2.1x 1.5x 1.4x 1.2x 0.8x Source: Antero management. (1)Includes $750 million in hedge monetization and $311 million in proceeds from an AM secondary equity offering in 3Q 2017. Page 26 Project Bronco | EBITDAX Including AM Distributions to AR$1,250$518$348$426$483$1,774$2,086$2,114$2,305$2,728 2022E 2021E 2020E 2019E 2018E 2017A Q1 18EQ2 18EQ3 18EQ4 18E 2018 - 2022 CAGR 18% 10% 11% 13% 77%
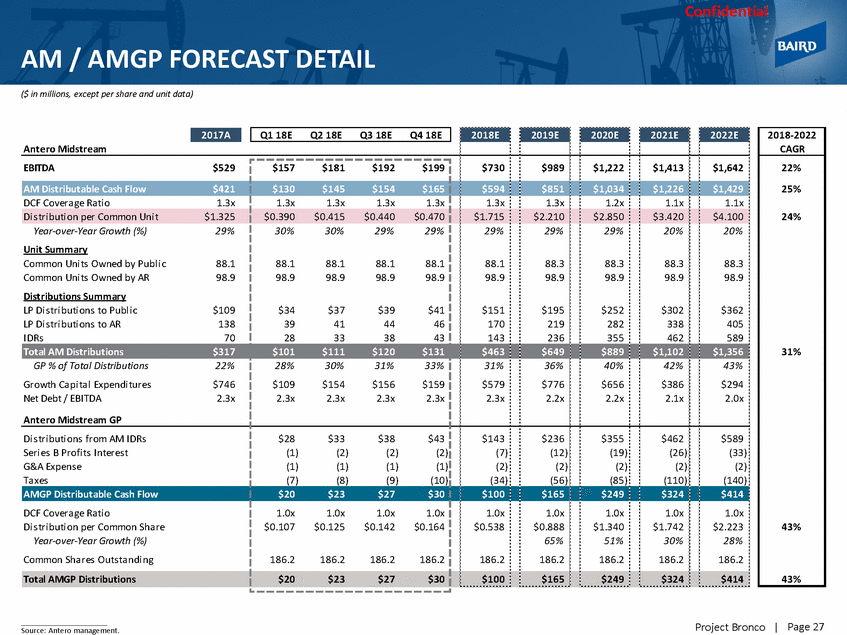
Confidential AM / AMGP FORECAST DETAIL ($ in millions, except per share and unit data) Antero Midstream Page 27 Project Bronco | Source: Antero management. EBITDA$529 $157$181$192$199 $730$989$1,222$1,413$1,642 AM Distributable Cash Flow$421 $130$145$154$165 $594$851$1,034$1,226$1,429 DCF Covera ge Ra ti o1.3x 1.3x1.3x1.3x1.3x 1.3x1.3x1.2x1.1x1.1x Di s tri buti on per Common Uni t$1.325 $0.390$0.415$0.440$0.470 $1.715$2.210$2.850$3.420$4.100 Year-over-Year Growth (%)29% Unit Summary Common Uni ts Owned by Publ i c88.1 Common Uni ts Owned by AR98.9 Distributions Summary LP Di s tri buti ons to Publ i c$109 LP Di s tri buti ons to AR138 IDRs70 30%30%29%29% 88.188.188.188.1 98.998.998.998.9 $34$37$39$41 39414446 28333843 29%29%29%20%20% 88.188.388.388.388.3 98.998.998.998.998.9 $151$195$252$302$362 170219282338405 143236355462589 Total AM Distributions$317$101$111$120$131$463$649$889$1,102$1,356 GP % of Total Distributions22% Growth Ca pi ta l Expendi tures$746 Net Debt / EBITDA2.3x Antero Midstream GP 28%30%31%33% $109$154$156$159 2.3x2.3x2.3x2.3x 31%36%40%42%43% $579$776$656$386$294 2.3x2.2x2.2x2.1x2.0x Di s tri buti ons from AM IDRs Seri es B Profi ts Interes t G&A Expens e Ta xes $28$33 $38 $43 (1) (2) (2) (2) (1) (1) (1) (1) (7) (8) (9) (10) $143$236$355$462$589 (7) (12) (19) (26)(33) (2)(2)(2)(2) (2) (34)(56)(85) (110)(140) AMGP Distributable Cash Flow $20$23$27$30 $100$165$249$324$414 DCF Covera ge Ra ti o Di s tri buti on per Common Sha re Year-over-Year Growth (%) Common Sha res Outs ta ndi ng 1.0x1.0x1.0x1.0x $0.107$0.125$0.142$0.164 186.2186.2186.2186.2 1.0x1.0x1.0x1.0x1.0x $0.538$0.888$1.340$1.742$2.223 65%51%30%28% 186.2186.2186.2186.2186.2 Total AMGP Distributions $20$23$27$30 $100$165$249$324$414 2022E 2021E 2020E 2019E 2018E 2017A 2018-2022 CAGR 22% 25% 24% 31% 43% 43% Q1 18EQ2 18EQ3 18EQ4 18E
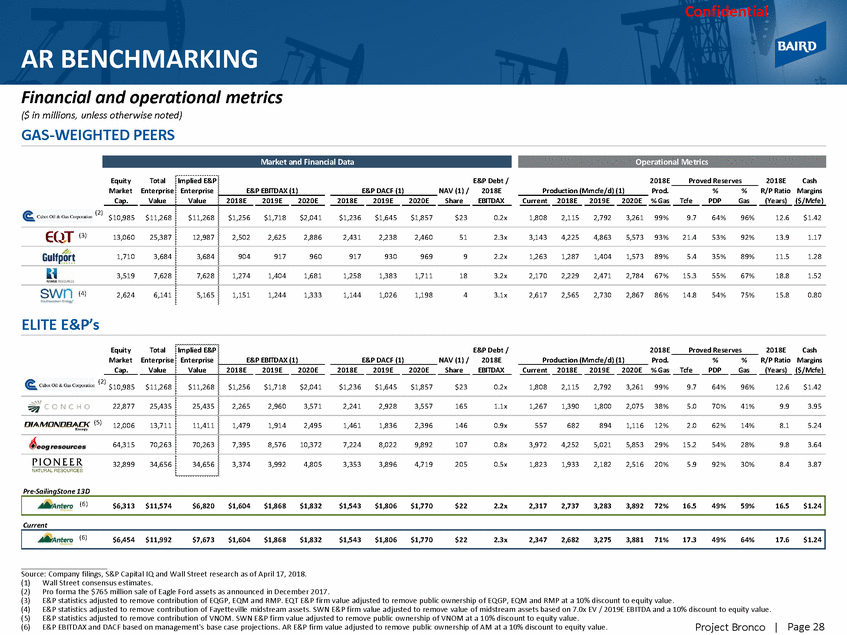
Confidential AR BENCHMARKING Financial and operational metrics ($ in millions, unless otherwise noted) GAS-WEIGHTED PEERS Operational Metrics EquityTotalImplied E&P E&P Debt / 2018E Proved Reserves 2018ECash Market Enterprise Enterprise E&P EBITDAX (1) E&P DACF (1) NAV (1) /2018E Production (Mmcfe/d) (1) Prod. % %R/P Ratio Margins Cap. Value Value 2018E 2019E 2020E 2018E 2019E 2020E Share EBITDAX Current 2018E 2019E 2020E % Gas Tcfe PDP Gas (Years) ($/Mcfe) (2) $10,985 $11,268 $11,268 $1,256 $1,718 $2,041 $1,236 $1,645 $1,857 $23 0.2x 1,808 2,115 2,792 3,261 99% 9.7 64% 96% 12.6 $1.42 (3) 13,060 25,387 12,987 2,502 2,625 2,886 2,431 2,238 2,460 51 2.3x 3,143 4,225 4,863 5,573 93% 21.4 53% 92% 13.9 1.17 1,710 3,684 3,684 904 917 960 917 930 969 9 2.2x 1,263 1,287 1,404 1,573 89% 5.4 35% 89% 11.5 1.28 3,519 7,628 7,628 1,274 1,404 1,681 1,258 1,383 1,711 18 3.2x 2,170 2,229 2,471 2,784 67% 15.3 55% 67% 18.8 1.52 (4) 2,624 6,141 5,165 1,151 1,244 1,333 1,144 1,026 1,198 4 3.1x 2,617 2,565 2,730 2,867 86% 14.8 54% 75% 15.8 0.80 ELITE E&P’s Equity Market Total Enterprise Implied E&P E&P Debt / 2018E Proved Reserves 2018E Cash Margins Enterprise E&P EBITDAX (1) E&P DACF (1) NAV (1) /2018E Production (Mmcfe/d) (1) Prod. % %R/P Ratio Cap. Value Value 2018E 2019E 2020E 2018E 2019E 2020E Share EBITDAX Current 2018E 2019E 2020E % Gas Tcfe PDP Gas (Years) ($/Mcfe) (2) $10,985 $11,268 $11,268 $1,256 $1,718 $2,041 $1,236 $1,645 $1,857 $23 0.2x 1,808 2,115 2,792 3,261 99% 9.7 64% 96% 12.6 $1.42 22,877 25,435 25,435 2,265 2,960 3,571 2,241 2,928 3,557 165 1.1x 1,267 1,390 1,800 2,075 38% 5.0 70% 41% 9.9 3.95 (5) 12,006 13,711 11,411 1,479 1,914 2,495 1,461 1,836 2,396 146 0.9x 557 682 894 1,116 12% 2.0 62% 14% 8.1 5.24 64,315 70,263 70,263 7,395 8,576 10,372 7,224 8,022 9,892 107 0.8x 3,972 4,252 5,021 5,853 29% 15.2 54% 28% 9.8 3.64 32,899 34,656 34,656 3,374 3,992 4,805 3,353 3,896 4,719 205 0.5x 1,823 1,933 2,182 2,516 20% 5.9 92% 30% 8.4 3.87 Pre-SailingStone 13D Current Source: Company filings, S&P Capital IQ and Wall Street research as of April 17, 2018. (1) (2) (3) (4) (5) (6) Wall Street consensus estimates. Pro forma the $765 million sale of Eagle Ford assets as announced in December 2017. E&P statistics adjusted to remove contribution of EQGP, EQM and RMP. EQT E&P firm value adjusted to remove public ownership o f EQGP, EQM and RMP at a 10% discount to equity value. E&P statistics adjusted to remove contribution of Fayetteville midstream assets. SWN E&P firm value adjusted to remove value of midstream assets based on 7.0x EV / 2019E EBITDA and a 10% discount to equity value. E&P statistics adjusted to remove contribution of VNOM. SWN E&P firm value adjusted to remove public ownership of VNOM at a 10% discount to equity value. E&P EBITDAX and DACF based on management's base case projections. AR E&P firm value adjusted to remove public ownership of AM at a 10% discount to equity value. Page 28 Project Bronco | (6)$6,454 $11,992$7,673$1,604$1,868$1,832$1,543$1,806$1,770$222.3x2,3472,6823,2753,881 71%17.349%64%17.6$1.24 (6)$6,313 $11,574$6,820$1,604$1,868$1,832$1,543$1,806$1,770$222.2x2,3172,7373,2833,892 72%16.549%59%16.5$1.24 Market and Financial Data
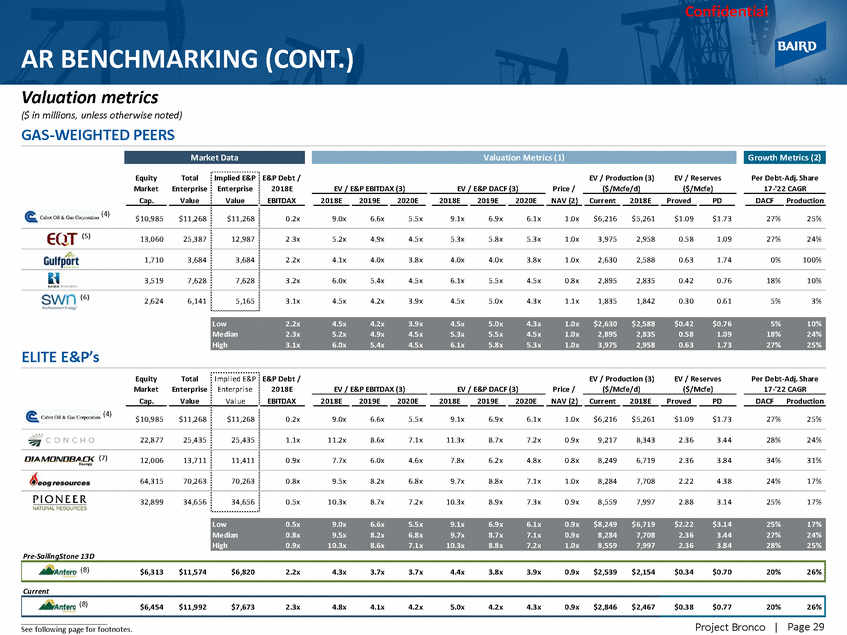
Confidential AR BENCHMARKING (CONT.) Valuation metrics ($ in millions, unless otherwise noted) GAS-WEIGHTED PEERS Growth Metrics (2) EquityTotalImplied E&P E&P Debt / EV / Production (3) EV / Reserves Per Debt-Adj. Share 17-'22 CAGR MarketEnterprise Enterprise 2018E EV / E&P EBITDAX (3) EV / E&P DACF (3) Price / ($/Mcfe/d) ($/Mcfe) Cap. Value Value EBITDAX 2018E 2019E 2020E 2018E 2019E 2020E NAV (2) Current 2018E Proved PD DACF Production (4) $10,985 $11,268 $11,268 0.2x 9.0x 6.6x 5.5x 9.1x 6.9x 6.1x 1.0x $6,216 $5,261 $1.09 $1.73 27% 25% (5) 13,060 25,387 12,987 2.3x 5.2x 4.9x 4.5x 5.3x 5.8x 5.3x 1.0x 3,975 2,958 0.58 1.09 27% 24% 1,710 3,684 3,684 2.2x 4.1x 4.0x 3.8x 4.0x 4.0x 3.8x 1.0x 2,630 2,588 0.63 1.74 0% 100% 3,519 7,628 7,628 3.2x 6.0x 5.4x 4.5x 6.1x 5.5x 4.5x 0.8x 2,895 2,835 0.42 0.76 18% 10% (6) 2,624 6,141 5,165 3.1x 4.5x 4.2x 3.9x 4.5x 5.0x 4.3x 1.1x 1,835 1,842 0.30 0.61 5% 3% ELITE E&P’s Equity Market Total Enterprise Impl i ed E&P Enterpri s e E&P Debt / 2018E EV / Production (3) EV / Reserves Per Debt-Adj. Share 17-'22 CAGR EV / E&P EBITDAX (3) EV / E&P DACF (3) Price / ($/Mcfe/d) ($/Mcfe) Cap. Value Va l ue EBITDAX 2018E 2019E 2020E 2018E 2019E 2020E NAV (2) Current 2018E Proved PD DACF Production (4) $10,985 $11,268 $11,268 0.2x 9.0x 6.6x 5.5x 9.1x 6.9x 6.1x 1.0x $6,216 $5,261 $1.09 $1.73 27% 25% 22,877 25,435 25,435 1.1x 11.2x 8.6x 7.1x 11.3x 8.7x 7.2x 0.9x 9,217 8,343 2.36 3.44 28% 24% (7) 12,006 13,711 11,411 0.9x 7.7x 6.0x 4.6x 7.8x 6.2x 4.8x 0.8x 8,249 6,719 2.36 3.84 34% 31% 64,315 70,263 70,263 0.8x 9.5x 8.2x 6.8x 9.7x 8.8x 7.1x 1.0x 8,284 7,708 2.22 4.38 24% 17% 32,899 34,656 34,656 0.5x 10.3x 8.7x 7.2x 10.3x 8.9x 7.3x 0.9x 8,559 7,997 2.88 3.14 25% 17% Pre-SailingStone 13D Current Page 29 Project Bronco | See following page for footnotes. (8) $6,454$11,992$7,6732.3x4.8x4.1x4.2x5.0x4.2x4.3x0.9x$2,846$2,467$0.38$0.7720%26% (8) $6,313$11,574$6,8202.2x4.3x3.7x3.7x4.4x3.8x3.9x0.9x$2,539$2,154$0.34$0.7020%26% Low 0.5x 9.0x 6.6x 5.5x 9.1x 6.9x 6.1x 0.9x $8,249 $6,719 $2.22 $3.14 25% 17% Median 0.8x 9.5x 8.2x 6.8x 9.7x 8.7x 7.1x 0.9x 8,284 7,708 2.36 3.44 27% 24% High 0.9x 10.3x 8.6x 7.1x 10.3x 8.8x 7.2x 1.0x 8,559 7,997 2.36 3.84 28% 25% Low 2.2x 4.5x 4.2x 3.9x 4.5x 5.0x 4.3x 1.0x $2,630 $2,588 $0.42 $0.76 5% 10% Median 2.3x 5.2x 4.9x 4.5x 5.3x 5.5x 4.5x 1.0x 2,895 2,835 0.58 1.09 18% 24% High 3.1x 6.0x 5.4x 4.5x 6.1x 5.8x 5.3x 1.0x 3,975 2,958 0.63 1.73 27% 25% Valuation Metrics (1) Market Data
Confidential AR BENCHMARKING Footnotes Source: Company filings, S&P Capital IQ and Wall Street research as of April 17, 2018. (1) (2) (3) (4) (5) Where applicable, Baird utilizes the following conversion ratios for oil and NGLs, respectively: 17.5 to 1.0 and 8.75 to 1.0. Wall Street research. Wall Street consensus estimates. Pro forma the $765 million sale of Eagle Ford assets as announced in December 2017. E&P statistics adjusted to remove contribution of EQGP, EQM and RMP. EQT E&P firm value adjusted to remove public ownership of EQGP, EQM and RMP at a 10% discount to equity value. E&P statistics adjusted to remove contribution of Fayetteville midstream assets. SWN E&P firm value adjusted to remove value of midstream assets based on 7.0x EV / 2019E EBITDA and a 10% discount to equity value. E&P statistics adjusted to remove contribution of VNOM. SWN E&P firm value adjusted to remove public ownership of VNOM at a 10% discount to equity value. E&P EBITDAX and DACF based on management's base case projections. AR E&P firm value adjusted to remove public ownership of AM at a 10% discount to equity value. (6) (7) (8) Page 30 Project Bronco |
