Confidential – Preliminary Draft PROJECT BRONCO CONFIDENTIAL DISCUSSION MATERIALS June 21, 2018 Project Bronco | Note, all analyses presented herein are preliminary and subject to change.

Confidential – Preliminary Draft PROJECT BRONCO CONFIDENTIAL DISCUSSION MATERIALS June 21, 2018 Project Bronco | Note, all analyses presented herein are preliminary and subject to change.

Confidential – Preliminary Draft TABLE OF CONTENTS CONFIDENTIAL DISCUSSION MATERIALS Review of Key Focus Areas & Objectives Proposal Summary & Initial Takeaways Detailed Proposal Analysis A. Exchange Ratio Analysis B. Pro Forma Impact Analysis (AM, AMGP, AR) C. Series B Analysis D. Deal Points Analysis 1 2 3 Page 1 Project Bronco |
Confidential – Preliminary Draft REVIEW OF KEY FOCUS AREAS & OBJECTIVES Project Bronco |

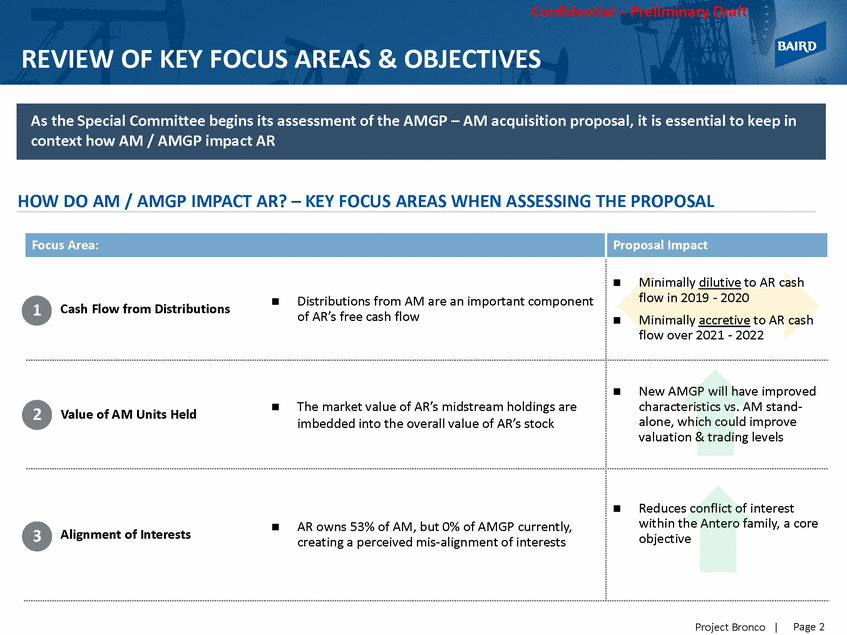
Confidential – Preliminary Draft REVIEW OF KEY FOCUS AREAS & OBJECTIVES HOW DO AM / AMGP IMPACT AR? – KEY FOCUS AREAS WHEN ASSESSING THE PROPOSAL Minimally accretive to AR cash alone, which could improve objective Page 2 Project Bronco | Focus Area: Proposal Impact 1Cash Flow from Distributions Distributions from AM are an important component of AR’s free cash flow Minimally dilutive to AR cash flow in 2019 - 2020 flow over 2021 - 2022 2Value of AM Units Held The market value of AR’s midstream holdings are imbedded into the overall value of AR’s stock New AMGP will have improved characteristics vs. AM stand-valuation & trading levels 3Alignment of Interests AR owns 53% of AM, but 0% of AMGP currently, creating a perceived mis-alignment of interests Reduces conflict of interest within the Antero family, a core As the Special Committee begins its assessment of the AMGP – AM acquisition proposal, it is essential to keep in context how AM / AMGP impact AR
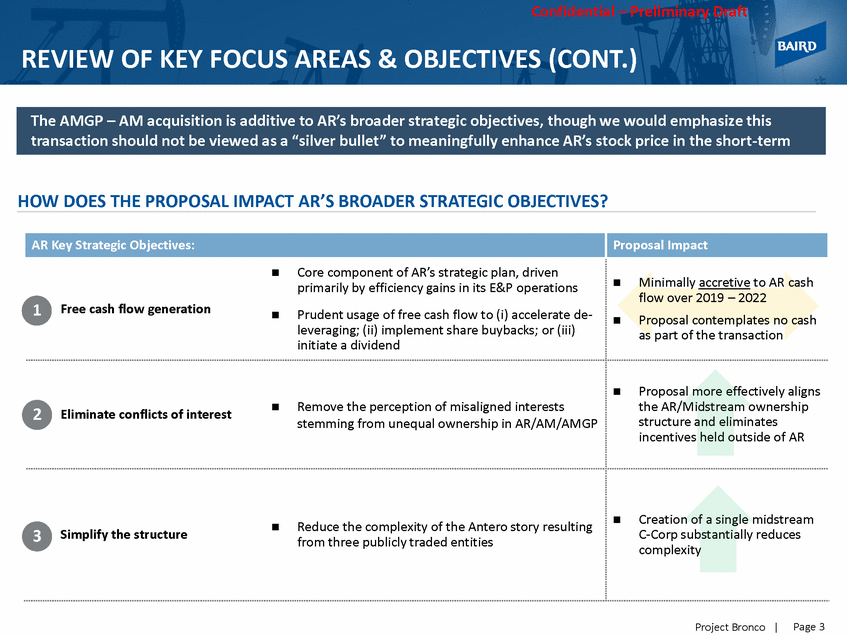
Confidential – Preliminary Draft REVIEW OF KEY FOCUS AREAS & OBJECTIVES (CONT.) HOW DOES THE PROPOSAL IMPAC T AR’S BROADER STRATEGIC OBJEC TIVES? flow over 2019 – 2022 as part of the transaction structure and eliminates C-Corp substantially reduces Page 3 Project Bronco | AR Key Strategic Objectives: Proposal Impact 1Free cash flow generation Core component of AR’s strategic plan, driven primarily by efficiency gains in its E&P operations Prudent usage of free cash flow to (i) accelerate de-leveraging; (ii) implement share buybacks; or (iii) initiate a dividend Minimally accretive to AR cash Proposal contemplates no cash 2Eliminate conflicts of interest Remove the perception of misaligned interests stemming from unequal ownership in AR/AM/AMGP Proposal more effectively aligns the AR/Midstream ownership incentives held outside of AR 3Simplify the structure Reduce the complexity of the Antero story resulting from three publicly traded entities Creation of a single midstream complexity The AMGP – AM acquisition is additive to AR’s broader strategic objectives, though we would emphasize this transaction should not be viewed as a “silver bullet” to meaningfully enhance AR’s stock price in the short-term
Confidential – Preliminary Draft PROPOSAL SUMMARY & INITIAL TAKEAWAYS Project Bronco |
Confidential – Preliminary Draft AMGP – AM ACQUISITION PROPOSAL SUMMARY Proposal provided to the AR Special Committee on June 8, 2018 AMGP acquires all of the outstanding common units of AM in an all equity exchange Each outstanding AM common unit to be exchanged for 1.600 AMGP shares Taxable transaction for holders of AM common units "Step-up" in tax basis to AMGP i. AMGP will be reorganized as a Delaware corporation with typical C-corp corporate governance Each share representing a limited partner interest in AMGP will be converted to one share of common stock of the resulting corporation IDRs in AM held by Antero IDR Holdings, LLC, a partially-owned subsidiary of AMGP ("IDR Holdings"), will be cancelled All of the Series B Units of IDR Holdings will be exchanged in a taxable transaction for an aggregate of 18.5 million AMGP shares (outlined on the following page) — ii. iii. Page 4 Project Bronco | Ancillary Transactions Tax Considerations Exchange Ratio Overview
Confidential – Preliminary Draft SERIES B EXCHANGE PROPOSAL SUMMARY Series B Exchange Proposal Summary Series B Units, as defined in the LLC Agreement of IDR Holdings 98,600 Series B Units Fixed at 18.5 million AMGP common shares in a taxable transaction Date of the closing of a merger of AMGP and AM Same as other holders of AMGP common shares Immediate payment in cash upon vesting to holders of the Series B Units of the unvested reallocated distribution amount (note, needs further clarification) Same as other holders of AMGP common shares Fully vested with customary registration rights No transfer restrictions (excluding standard trading restrictions for insiders) None Exchange of Series B Units into AMGP common shares conditioned on closing of a merger of AMGP and AM All Series B Units exchanged Page 5 Project Bronco | Conditions Subordination Vesting & Transferability Voting Rights Arrearages Distribution Rights Effective Date Exchange Consideration Current Issued Existing Security
Confidential – Preliminary Draft PROPOSAL MECHANICS ($ in millions, unless otherwise noted) AM Uni ts Outs ta ndi ng Propos ed Excha nge Ra ti o AMGP Sha res Is s ued Current AMGP Pri ce @ 2/23/18 (1) 187.0 1.600x Public Public 299.3 $18.95 231.4 mm shares 73% Interest 85.6 mm shares 27% Interest 124.8 mm shares 25% Interest 202.5 mm shares 40% Interest Equity Value Debt Ca s h $5,671 1,310 (9) 158.2 mm shares 31% Interest 2018E Adj . EBITDA (2) Implied EV / 2018E Adj. EBITDA 591 11.8x 4% Interest AM Equity Value % Debt Funded As s umed Net Debt New Debt Is s ua nce (ca s h) AMGP Shares Issued to AM AMGP Shares Issued to AM Public (47%) AMGP Shares Issued to AR (53%) $5,671 0.0% 1,301 0 299.3 141.1 158.2 Source: AR, AM and AMGP SEC filings, June 8th Proposal and Antero management. (1)Represents last close prior to special committee formation. (2)EBITDA less projected IDR distributions. Page 6 Project Bronco | Transaction Mechanics Antero Midstream Corp. Series B Holders 18.5 mm shares Enterprise Value $6,972 AM Valuation AM Common Equity Purchase Price $5,671 Sponsors / Management AM Equity Take-Out Pro Forma Org. Structure Purchase Price
Confidential – Preliminary Draft RESULTING FROM CURRENT AND PRO FORMA PROPOSAL TERMS OWNERSHIP otherwise noted) Partners LP GP 28% interest 12% interest 31% interest 25% interest 4% interest Page 7 Project Bronco | Source: AR, AM and AMGP SEC filings, June 8th Proposal and Antero management. 27% Interest ($ in millions, unless Antero MidstreamAntero Midstream 88.2 million units 47% interest– $2,674 141.1 million shares $2,589 61.4 million shares –33% interest $1,127 61.4 million shares $1,127 98.9 million units 53% interest– $2,999 158.2 million shares $2,903 124.8 million shares –67% interest $2,290 Ownership in AR 124.8 million shares85.6 million $2,290$1,669 –98,600 Series B Units 18.5 million shares $338 Series B Holders senior members of Antero Midstream management Sponsors / Management AR Public – AMGP Public – AM Antero Midstream “New AMGP” Corporation Pro Forma Current
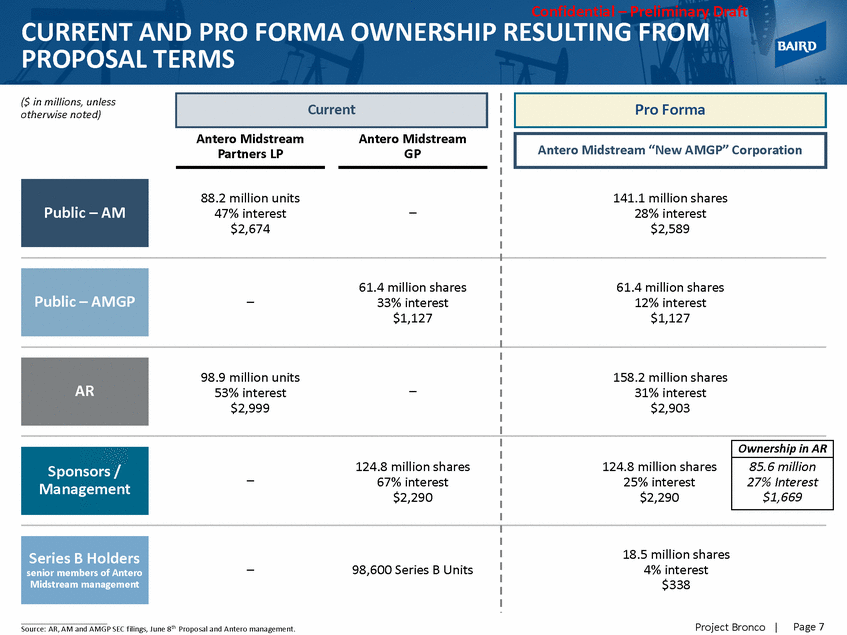
Confidential – Preliminary Draft KEY PROPOSAL FOCUS AREAS unitholders neutral (i.e. no cut) through different remaining conflict of interest overhang (inclusive of water earn-out acceleration payments) Page 8 Project Bronco | Focus Area Reactionary / Headline Risk Considerations 1Exchange Ratio 1.600x proposed exchange Ratio implies: –3.2% discount to AM’s current price (as of June 15) –10.8% premium to AM’s “clean” price (as of Feb. 23) Investors are likely anticipating a modest premium, based on historical MLP buy-in precedents Need to establish the “clean” unaffected date for the transaction – likely 2/23/18 (date prior to Spec. Cmte. announcement) 2Near-Term Dilution AM unitholders (and AR shareholders, by extension) likely to be disappointed with a distribution cut Free cash flow generation is integral to the AR investment story Target keeping pro forma distributions to AM variables (distr. coverage ratio, exchange ratio, etc). 3Series B Value Investors may be surprised by the implied value of the Series B Units Negative perception of management’s incentives in this transaction Series B needs to be removed to eliminate any Series B could realize substantial value if left in place 4No Cash Component Including a cash component or option in the deal may be a positive surprise to AR investors, particularly if cash proceeds are earmarked for share buybacks at AR Aggregate cash proceeds in excess of $500 mm will likely be required to “move the needle” May reduce potential “overhang” on new AMGP shares post-deal Based on our initial assessment, Baird views the AMGP – AM acquisition as a modest net positive to AR, however, the Committee should consider pursuing certain enhancements to the initial terms of the proposal
Confidential – Preliminary Draft DETAILED PROPOSAL ANALYSIS Project Bronco |
Exchange Ratio Analysis
Confidential – Preliminary Draft ANTERO FAMILY RELATIVE TRADING Performance Since: Sailing Stone 13D (1/29/18) Special Committee Formation (2/26/18) AR (2.5%) 2.9% 20.0% AMGP acquisition of AM, including multiple Wall 15.0% 10.0% 5.0% 3.8% 0.0% (1.4%) (5.0%) (10.0%) (11.4%) (15.0%) (20.0%) (25.0%) (30.0%) 01/01/18 01/28/18 02/25/18 03/24/18 04/21/18 05/18/18 06/15/18 Page 9 Project Bronco | Source: S&P Capital IQ as of June 15, 2018. 1/29/18: SailingStone files 13D In our view, market speculation surrounding an Street research analyst reports on the topic, has 2/26/18: Announcement of Special Committees significantly impacted trading levels Note, AMZ traded (1.2%) during this time AM (8.5%) 14.5% AMGP (16.7%) (4.4%)
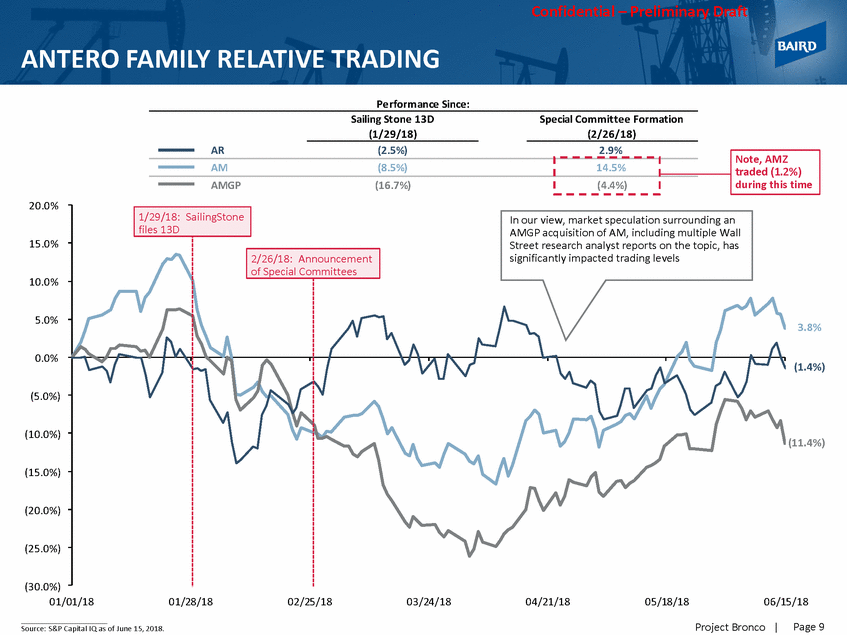
Confidential – Preliminary Draft AM / AMGP HISTORICAL EXCHANGE RATIO 1.80x 1.70x Current: 1.652x 1.60x Average since AMGP IPO: 1.557x SailingStone 13D: 1.505x 1.50x 1.40x Special Committee: 1.380x 1.30x 05/03/17 07/23/17 10/13/17 01/02/18 03/25/18 06/15/18 Page 10 Project Bronco | Source: S&P Capital IQ as of June 15, 2018. Unaffected Exchange Ratio Date 1-Day 10-Day VWAP Current 06/15/18 1.652x 1.633x Premium / (Discount) @ 1.600x 1-Day 10-Day VWAP (3.2%) (2.0%) Implied Exhange Ratio to Achieve Premium to 10-Day VWAP 5% 10% 15% 1.715x 1.796x 1.878x Special Committee Announcement 02/23/18 1.380x 1.379x 15.9% 16.1% 1.448x 1.517x 1.585x Sailing Stone 13D 01/26/18 1.505x 1.513x 6.3% 5.7% 1.589x 1.665x 1.740x
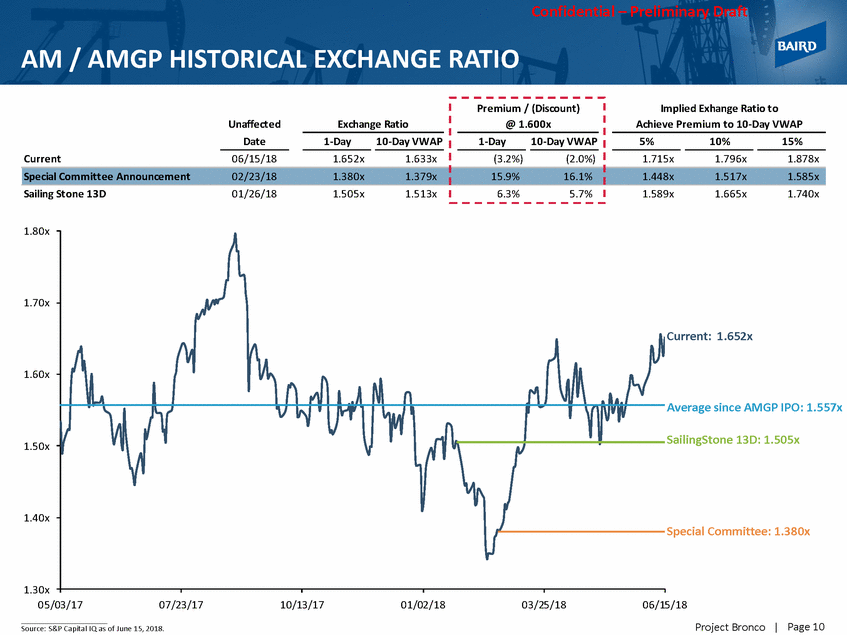
Confidential – Preliminary Draft RELATIVE CONTRIBUTION ANALYSIS APPROACH Relative contribution based on proportionate cash flows IMPLIED AM / AMGP EXCHANGE RATIO Source: management projections. (1) (2) (3) See Supplemental Valuation materials for terminal yield assumptions. Assumed to be equal to AMGP common shares terminal yield. AMGP includes only Series A cash flow. Page 11 Project Bronco | Key Observations In the near term, AM contributes proportionately more to total distributions than AMGP, implying exchange ratios above 2.00x However, as AMGP grows into its IDR tiers, the implied exchange ratio steadily declines and ultimately falls below the proposed ratio of 1.600x in the terminal year Distributions Implied by Relative Contribution vs. Proposal ($ in million, except per share data)Terminal 2019E 2020E 2021E 2022E Value Di s tri buti ons to AM Common Uni ts $414 $533 $640 $767 $10,230 Terminal Yield (1) 7.5% PV 10% $8,898 55.6% 59.4% Di s tri buti ons to AMGP Common Sha res 165 249 324 414 8,275 Terminal Yield (1) 5.0% 6,578 41.1% 36.9% Di s tri buti ons to Seri es B Uni ts 12 19 26 33 662 Terminal Yield (2) 5.0% 524 3.3% 3.7% Total $591 $802 $990 $1,214 $19,167 $16,000 100.0% 100.0% Implied AM / AMGP Exchange Ratio (3) 2.491x 2.129x 1.964x 1.846x 1.231x 1.347x 1.347x 1.600x Pro Forma Share Ownership (mm shares) AM Uni thol der Implied by Relative Contribution Proposal 251.9 299.3 AMGP Sha rehol ders 186.2 186.2 Seri es B Uni ts 14.8 18.5
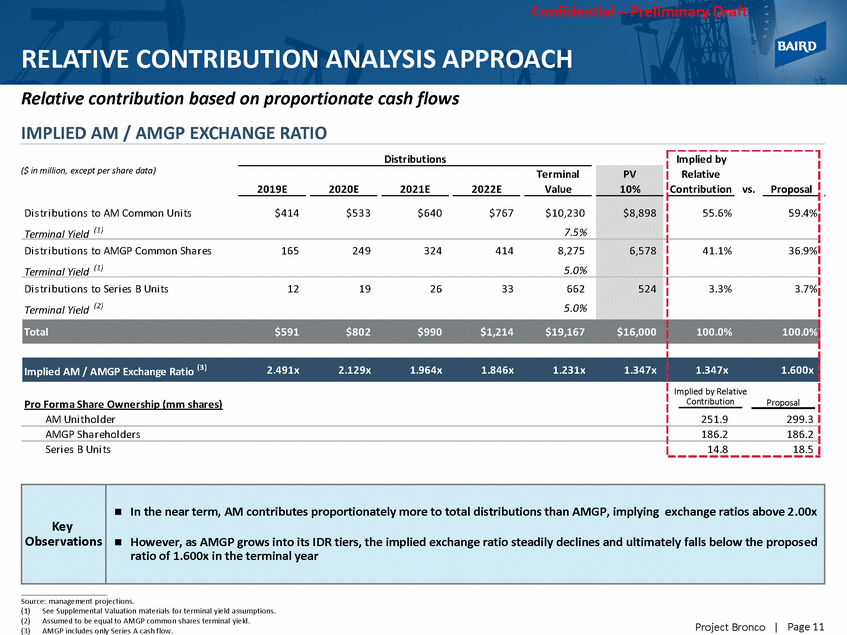
Confidential – Preliminary Draft RELATIVE CONTRIBUTION ANALYSIS APPROACH Relative contribution based on historical market valuations (CONT.) LT Avg. Exchange Ratio 1.8x Baird utilized the long term average exchange ratios of AM / AMGP under two scenarios: 1.7x 1AM / AMGP (inclusive of only Series A) 1.6x 2 AM / AMGP (assuming full redemption of Series B) 1.5x 1.4x Under each scenario, the resulting market value contribution of each entity was compared against the pro forma ownership implicit in the June 8th Proposal 1.3x 05/03/17 07/23/17 10/13/17 01/02/18 03/25/18 06/15/18 IMPLIED MARKET VALUE CONTRIBUTION vs. PROPOSED OWNERSHIP LT Avg. Pro Forma Ownership % Implied by Relative Contribution Analysis Ownership % Implied by Proposal AM 57.8% 59.4% Seri es A AMGP 37.9% 36.9% Seri es B AMGP 4.3% 3.7% 1.52x Page 12 Project Bronco | (1)Utilizes AMGP share price of $18.35 as of June 15, 2018. Shares Exchange AMGP Market Entity O/S Ratio Shares Value (1) Relative Contribution vs. Proposal Ownership Exclusive of Series B AM 187 291 $5,342 1.56x Seri es A AMGP 186 186 3,417 Seri es B AMGP - - - 61.0% 59.4% 39.0% 36.9% 0.0% 3.7% Total 477 $8,759 100.0% 100.0% Inclusive of Series B AM 187 284 $5,207 Seri es A AMGP 186 186 3,417 Seri es B AMGP - 21 392 57.8% 59.4% 37.9% 36.9% 4.3% 3.7% Total 491 $9,016 100.0% 100.0% AM/AMG P (Series A) 1.56x AM/AMG P (Series A+B ) 1.52x
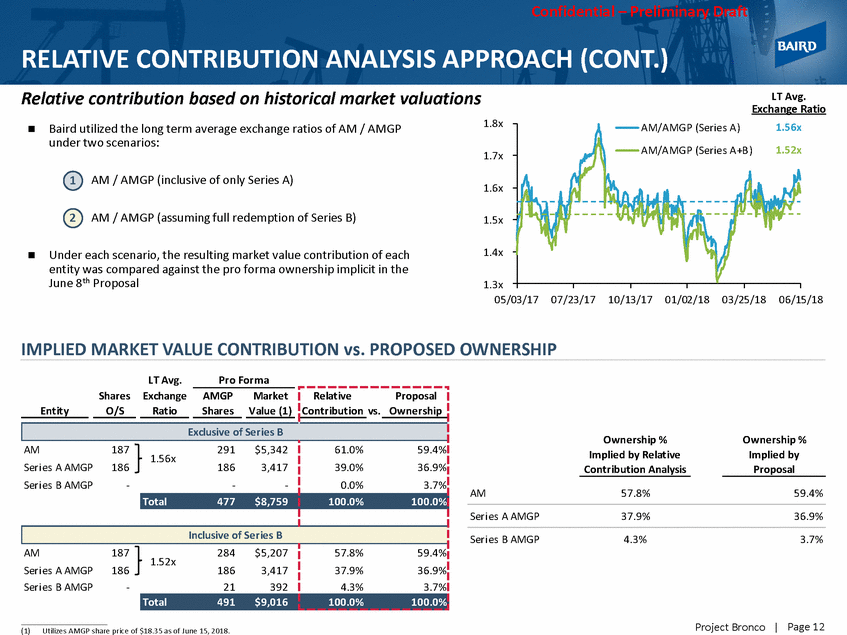
Confidential – Preliminary Draft PRECEDENT MLP BUY-IN PREMIUMS OVER THE LAST 5 YEARS Premium / (Discount) ( 1) Announced Date Acquiror Target Buyer 1-Day 10-Day 30-Day 05/16/18 Enbri dge I nc. Enbri dge Ene rgy Pa rtne rs , L.P. GP 0.0% 9.6% 0.9% 02/07/18 NuSta r Ene rgy Pa rtne rs LP NuSta r GP Hol di ngs , LLC MLP 1.7% (7.3%) 9.8% 05/16/18 Wi l l i a ms , I nc. Wi l l i a ms Pa rtne rs L.P. GP 6.4% 12.6% 19.5% 01/02/18 Archrock, I nc. Archrock Pa rtne rs , L.P. GP 23.4% 22.3% 25.6% 04/03/17 Worl d Poi nt Te rmi na l s I nc. Worl d Poi nt Te rmi na l s , LP GP 5.8% 6.5% (1.1%) 02/01/17 ONEOK I nc. ONEOK Pa rtne rs LP GP 25.8% 21.8% 19.2% 11/21/16 Sunoco Logi s ti cs Pa rtne rs LP Ene rgy Tra ns fe r Pa rtne rs LP MLP (0.2%) 17.4% 6.8% 05/31/16 Se mGroup Corpora ti on Ros e Rock Mi ds tre a m LP GP 0.0% 16.9% 60.0% 05/06/15 Cre s twood Equi ty Pa rtne rs LP Cre s twood Mi ds tre a m Pa rtne rs LP MLP 17.2% 20.1% 27.6% 10/01/14 Ente rpri s e Products Pa rtne rs LP Oi l ta nki ng Pa rtne rs LP MLP 5.6% 1.9% 5.1% 08/10/14 Ki nde r Morga n I nc. Ki nde r Morga n Ene rgy Pa rtne rs LP GP 12.0% 6.9% 10.7% 08/27/13 Pl a i ns Al l Ame ri ca n Pi pe l i ne LP PAA Na tura l Ga s Stora ge LP MLP 6.6% 10.0% (0.3%) Source: Company and partnership filings, Bloomberg and S&P Capital IQ. (1)Represents premium / (discount) at announcement. 1-day, 10-day and 30-day prices based on business days from last "unaffected" date, excluding holidays. Page 13 Project Bronco | Median6.5%10.0%9.8% Average8.5%11.0%12.8% 06/15/14Acce s s Mi ds tre a m Pa rtne rs LPWi l l i a ms Pa rtne rs LPMLP6.5%5.4%8.1% 08/10/14Ki nde r Morga n I nc.El Pa s o Pi pe l i ne Pa rtne rsGP15.4%8.9%7.3% 01/26/15Ene rgy Tra ns fe r Pa rtne rs LPRe ge ncy Ene rgy Pa rtne rs LPMLP13.2%23.2%15.8% 11/03/15Ta rga Re s ource s Corp.Ta rga Re s ource s Pa rtne rs LPGP18.4%11.0%8.6% 09/26/16Col umbi a Pi pe l i ne Group, I nc.Col umbi a Pi pe l i ne Pa rtne rs LPGP11.8%20.2%26.3% 01/27/17Enbri dge I nc.Mi dcoa s t Ene rgy Pa rtne rs LPGP(8.6%)5.3%10.3% 03/02/17VTTI B.V.VTTI Ene rgy Pa rtne rs LPGP5.7%4.3%15.0% 05/18/17Ene rgy Tra ns fe r Pa rtne rs , LPPe nnTe x Mi ds tre a m Pa rtne rs , LPMLP20.1%22.5%16.3% 03/26/18Ta l l gra s s Ene rgy GPTa l l gra s s Ene rgy Pa rtne rs , L.P.GP8.1%10.0%3.4% 05/16/18Che ni e re Ene rgy, I nc.Che ni e re Ene rgy Pa rtne rs LP Hol di ngs , LLCGP(0.0%)(1.8%)0.5% 05/16/18Enbri dge I nc.Spe ctra Ene rgy Pa rtne rs , LPGP0.0%5.7%(0.9%)
Pro Forma Impact Analysis (AM, AMGP, AR)
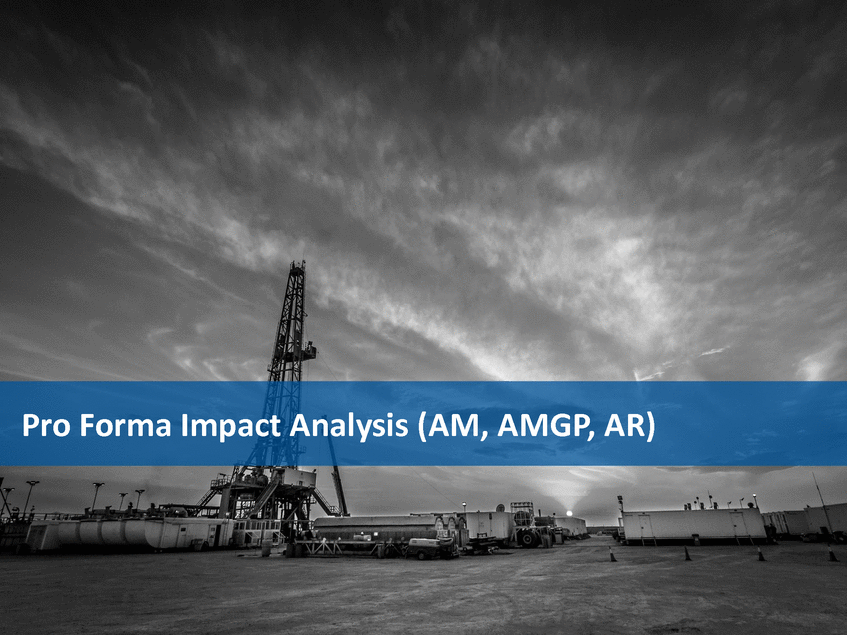
Confidential – Preliminary Draft PRO FORMA IMPACT TO AM UNITHOLDERS DCF per LP Unit Distribution per LP Unit $5.00 $5.00 $4.29 $4.00 $3.75 $4.00 $4.00 $3.39 $3.00 $3.00 $2.00 $2.00 $1.00 $1.00 $0.00 $0.00 2019E 2020E 2021E 2022E 2019E 2020E 2021E 2022E Total Coverage (2) DPU CAGR vs. 2019 2.00x 50.0% 40.0% 1.50x 30.0% 22.9% 1.00x 20.0% 0.50x 10.0% 0.0% 0.00x 2020E 2021E 2022E 2_0_ 19E 2020E 2021E 2022E Note: Assumes AMGP purchases 100% of AM public units with 100% equity at a 1.600x exchange ratio; AMGP issues 299.3 million shares to current AM unitholders. Also assumes that AMGP issues 18.5 million shares in exchange for 100% of the Series B units. (1)Measures the impact of 18.5 million shares versus 4.6 million shares issued. (2)Assumes that AMGP maintains AM status quo coverage ratio. Page 14 Project Bronco | 37.4% 29.0% 30.3% 26.9% 24.4% 1.31x 1.31x 1.16x 1.16x 1.11x 1.11x 1.05x 1.05x $4.56 $4.43 $3.89 $3.24 $2.75 $2.78 $3.29 $2.70 $4.10 $4.33 $3.42 $3.60 $4.21 $2.85 $2.91 $3.50 $2.21 $2.12 $2.83 $2.06 Accretion / (Dilution) ($0.15) ($0.02) $0.08 $0.11 (6.7%) (0.6%) 2.3% 2.6% Accretion / (Dilution) ($0.05) $0.05 $0.14 $0.14 (1.8%) 1.7% 3.7% 3.1% StandalonePro FormaDilutive Impact of Series B Conversion (1)
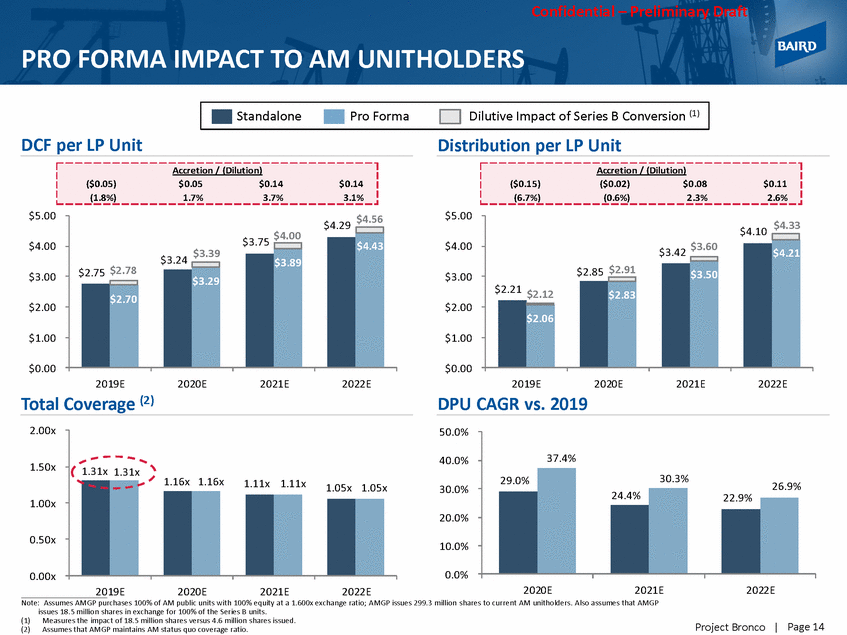
Confidential – Preliminary Draft PRO FORMA IMPACT TO AMGP SHAREHOLDERS DCF per LP Unit Distribution per LP Unit $3.00 $2.85 $3.00 $2.00 $2.00 $1.00 $1.00 $0.00 $0.00 2019E 2020E 2021E 2022E 2019E 2020E 2021E 2022E Total Coverage (2) DPU CAGR vs. 2019 2.00x 60.0% 50.0% 40.0% 30.0% 1.50x 1.31x 37.4% 35.8% 1.16x 1.11x 1.05x 1.00x 1.00x 1.00x 1.00x 20.0% 0.50x 10.0% 0.0% 0.00x 2020E 2021E 2022E 2_0_ 19E 2020E 2021E 2022E Note: Assumes AMGP purchases 100% of AM public units with 100% equity at a 1.600x exchange ratio; AMGP issues 299.3 million shares to current AM unitholders. Also assumes that AMGP issues 18.5 million shares in exchange for 100% of the Series B units. (1)Measures the impact of 18.5 million shares versus 4.6 million shares issued. (2)Assumes that AMGP maintains AM status quo coverage ratio. Page 15 Project Bronco | 50.9% 40.1% 30.3% 26.9% 1.00x $2.71 $2.25$2.22 $2.63 $1.82$1.74 $2.19 $1.32$1.34 $1.77 $0.89 $1.29 $2.50 $2.77 $2.12 $2.43 $2.22 $1.74 $2.06 $1.74 $0.89 $1.69 $1.34 Accretion / (Dilution) $0.40 $0.43 $0.44 $0.41 45.1% 32.1% 25.5% 18.3% Accretion / (Dilution) $0.80 $0.72 $0.69 $0.55 90.0% 53.6% 39.6% 24.5% StandalonePro FormaDilutive Impact of Series B Conversion (1)
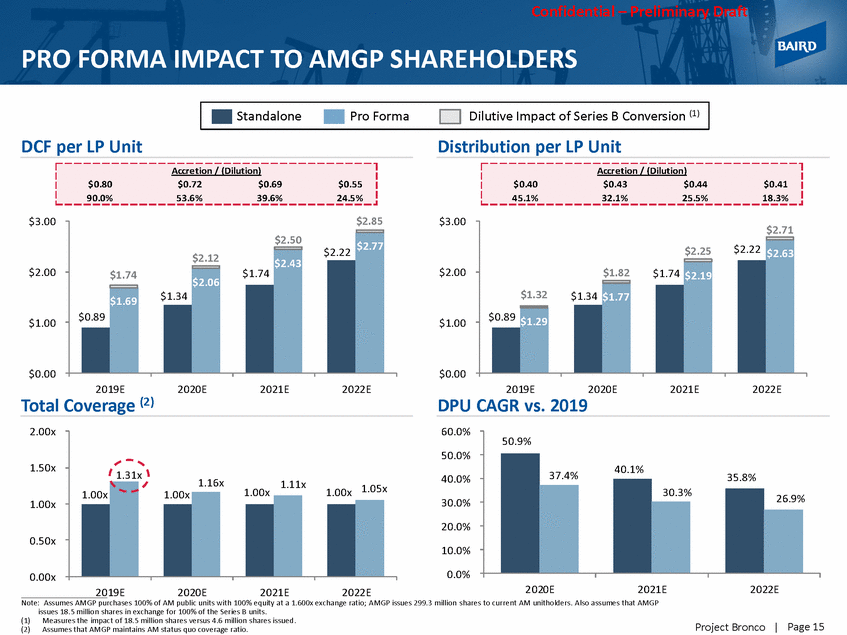
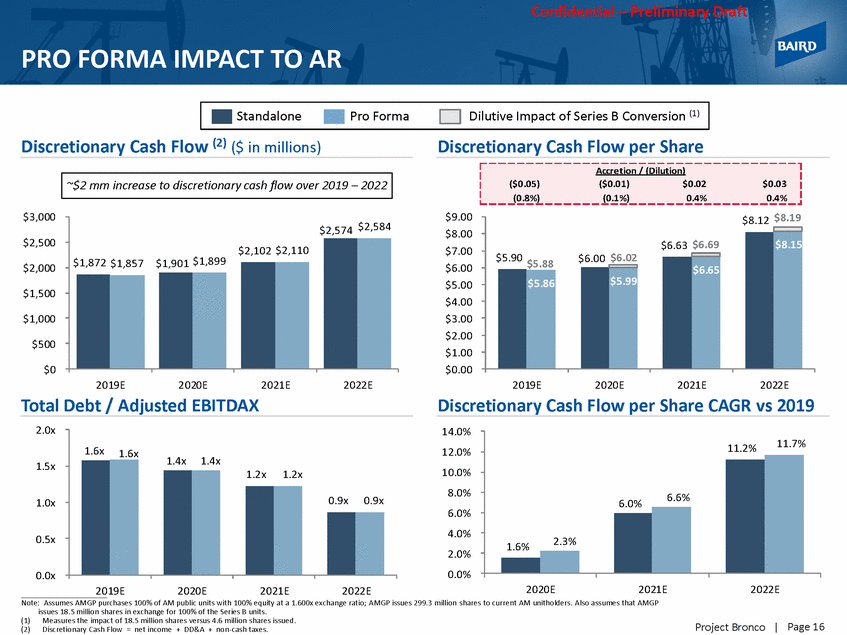
Confidential – Preliminary Draft PRO FORMA IMPACT TO AR Discretionary Cash Flow (2) ($ in millions) Discretionary Cash Flow per Share $3,000 $9.00 $8.00 $7.00 $6.00 $5.00 $4.00 $3.00 $2.00 $1.00 $0.00 $2,500 $5.90 $5.88 $6.00 $6.02 $1,901 $1,899 $1,872 $1,857 $2,000 $5.86 $1,500 $1,000 $500 $0 2019E 2020E 2021E 2022E 2019E 2020E 2021E 2022E Total Debt / Adjusted EBITDAX Discretionary Cash Flow per Share CAGR vs 2019 2.0x 14.0% 12.0% 10.0% 8.0% 6.0% 4.0% 2.0% 0.0% 1.4x 1.4x 1.5x 1.0x 0.5x 0.0x 2020E 2021E 2022E 2_0_ 19E 2020E 2021E 2022E Note: Assumes AMGP purchases 100% of AM public units with 100% equity at a 1.600x exchange ratio; AMGP issues 299.3 million shares to current AM unitholders. Also assumes that AMGP issues 18.5 million shares in exchange for 100% of the Series B units. (1)Measures the impact of 18.5 million shares versus 4.6 million shares issued. (2)Discretionary Cash Flow = net income + DD&A + non-cash taxes. Page 16 Project Bronco | 11.2%11.7% 6.0% 6.6% 1.6% 2.3% 1.6x 1.6x 1.2x 1.2x 0.9x 0.9x $2,574 $2,584 $2,102 $2,110 $8.12 $8.19 $6.63 $6.69 $8.15 $6.65 $5.99 ~$2 mm increase to discretionary cash flow over 2019 – 2022 Accretion / (Dilution) ($0.05) ($0.01) $0.02 $0.03 (0.8%) (0.1%) 0.4% 0.4% StandalonePro FormaDilutive Impact of Series B Conversion (1)
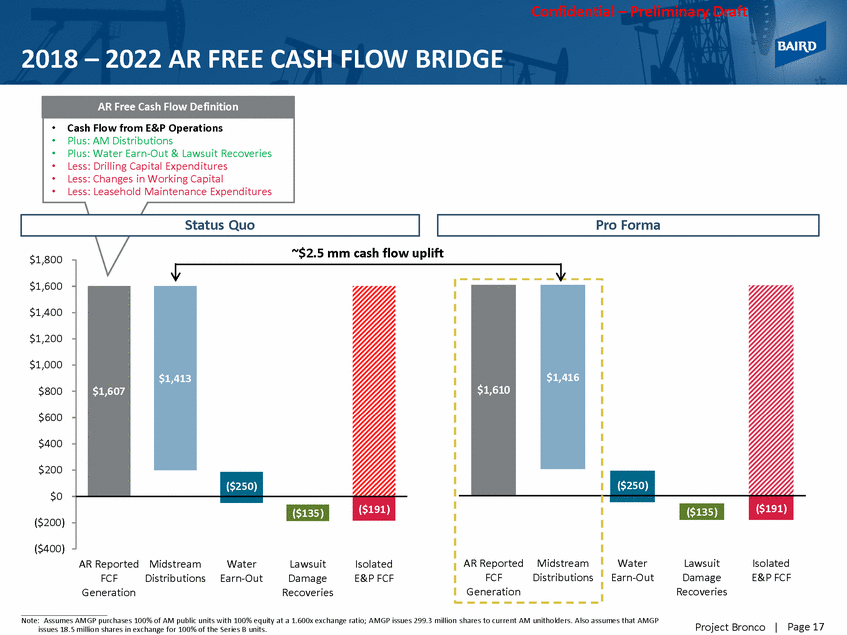
Confidential – Preliminary Draft 2018 – 2022 AR FREE CASH FLOW BRIDGE • • • • • • Cash Flow from E&P Operations Plus: AM Distributions Plus: Water Earn-Out & Lawsuit Recoveries Less: Drilling Capital Expenditures Less: Changes in Working Capital Less: Leasehold Maintenance Expenditures ~$2.5 mm cash flow uplift $1,800 $1,600 $1,400 $1,200 $1,000 $800 $600 $400 $200 $0 ($200) ($400) AR Reported Midstream FCFDistributions Generation Water Earn-Out Lawsuit Damage Recoveries Isolated E&P FCF Note: Assumes AMGP purchases 100% of AM public units with 100% equity at a 1.600x exchange ratio; AMGP issues 299.3 million shares to current AM unitholders. Also assumes that AMGP issues 18.5 million shares in exchange for 100% of the Series B units. Page 17 Project Bronco | $1,610 ($250) AR ReportedMidstream FCFDistributions Generation ($191) WaterLawsuitIsolated Earn-OutDamage E&P FCF Recoveries ($135) $1,416 $1,607 ($250) ($191) ($135) $1,413 Status Quo Pro Forma AR Free Cash Flow Definition
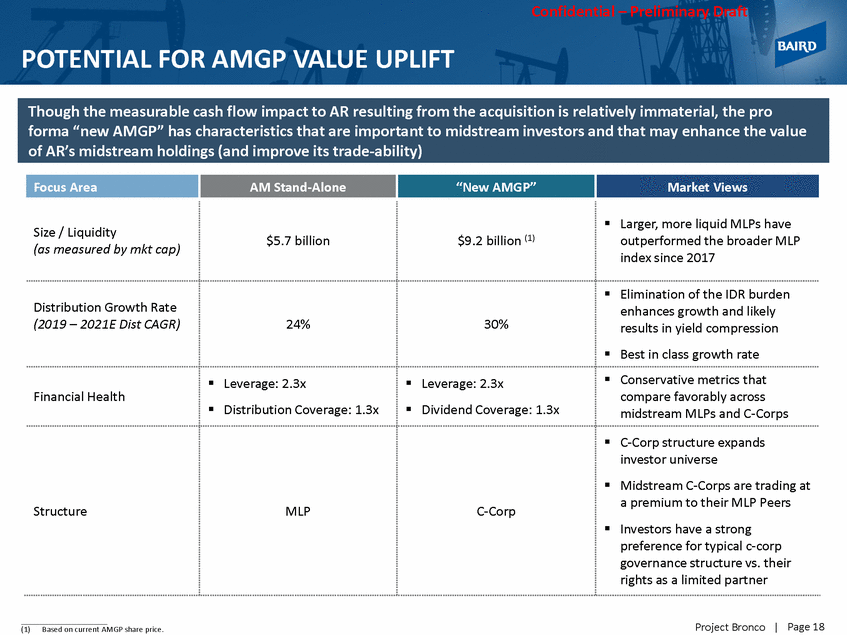
Confidential – Preliminary Draft POTENTIAL FOR AMGP VALUE UPLIFT outperformed the broader MLP enhances growth and likely compare favorably across Page 18 Project Bronco | (1)Based on current AMGP share price. Focus Area AM Stand-Alone “New AMGP” Market Views Size / Liquidity (as measured by mkt cap) $5.7 billion $9.2 billion (1) Larger, more liquid MLPs have index since 2017 Distribution Growth Rate (2019 – 2021E Dist CAGR) 24% 30% Elimination of the IDR burden results in yield compression Best in class growth rate Financial Health Leverage: 2.3x Distribution Coverage: 1.3x Leverage: 2.3x Dividend Coverage: 1.3x Conservative metrics that midstream MLPs and C-Corps Structure MLP C-Corp C-Corp structure expands investor universe Midstream C-Corps are trading at a premium to their MLP Peers Investors have a strong preference for typical c-corp governance structure vs. their rights as a limited partner Though the measurable cash flow impact to AR resulting from the acquisition is relatively immaterial, the pro forma “new AMGP” has characteristics that are important to midstream investors and that may enhance the value of AR’s midstream holdings (and improve its trade-ability)
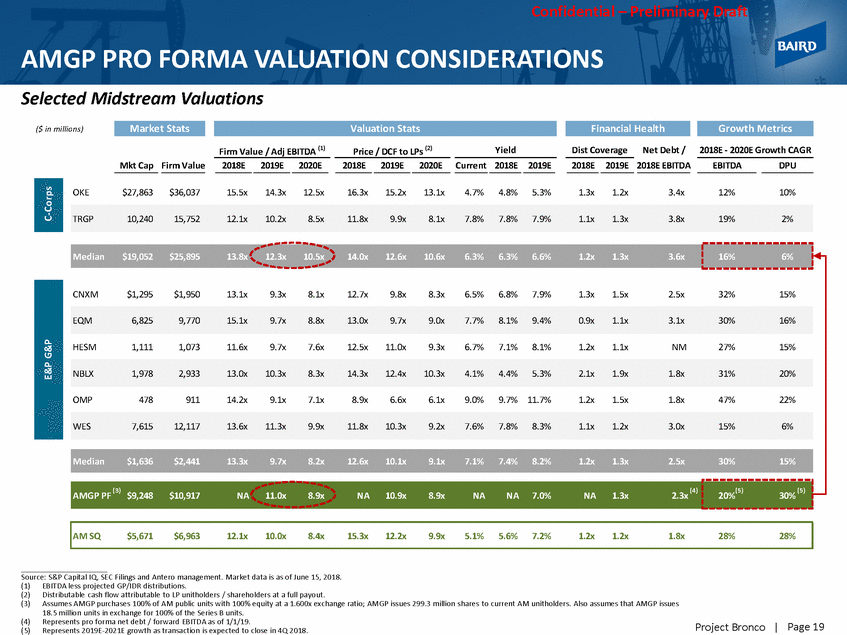
Confidential – Preliminary Draft AMGP PRO FORMA VALUATION CONSIDERATIONS Selected Midstream Valuations ($ in millions) Firm Value / Adj EBITDA (1) Price / DCF to LPs (2) Yield Dist Coverage Net Debt / 2018E EBITDA 2018E - 2020E Growth CAGR Mkt Cap Firm Value 2018E 2019E 2020E 2018E 2019E 2020E Current 2018E 2019E 2018E 2019E EBITDA DPU OKE $27,863 $36,037 15.5x 14.3x 12.5x 16.3x 15.2x 13.1x 4.7% 4.8% 5.3% 1.3x 1.2x 3.4x 12% 10% CNXM $1,295 $1,950 13.1x 9.3x 8.1x 12.7x 9.8x 8.3x 6.5% 6.8% 7.9% 1.3x 1.5x 2.5x 32% 15% HESM 1,111 1,073 11.6x 9.7x 7.6x 12.5x 11.0x 9.3x 6.7% 7.1% 8.1% 1.2x 1.1x NM 27% 15% OMP 478 911 14.2x 9.1x 7.1x 8.9x 6.6x 6.1x 9.0% 9.7% 11.7% 1.2x 1.5x 1.8x 47% 22% 20% 30% Source: S&P Capital IQ, SEC Filings and Antero management. Market data is as of June 15, 2018. (1) (2) (3) EBITDA less projected GP/IDR distributions. Distributable cash flow attributable to LP unitholders / shareholders at a full payout. Assumes AMGP purchases 100% of AM public units with 100% equity at a 1.600x exchange ratio; AMGP issues 299.3 million shares to current AM unitholders. Also assumes that AMGP issues 18.5 million units in exchange for 100% of the Series B units. Represents pro forma net debt / forward EBITDA as of 1/1/19. Represents 2019E-2021E growth as transaction is expected to close in 4Q 2018. (4) (5) Page 19 Project Bronco | E&P G&P C-Corps AM SQ$5,671$6,96312.1x10.0x8.4x15.3x12.2x9.9x5.1%5.6%7.2%1.2x1.2x1.8x28%28% (3)(4) AMGP PF$9,248$10,917NA11.0x8.9xNA10.9x8.9xNANA7.0%NA1.3x2.3x (5)(5) Median$1,636$2,44113.3x9.7x8.2x12.6x10.1x9.1x7.1%7.4%8.2%1.2x1.3x2.5x30%15% WES7,61512,11713.6x11.3x9.9x11.8x10.3x9.2x7.6%7.8%8.3%1.1x1.2x3.0x15%6% NBLX1,9782,93313.0x10.3x8.3x14.3x12.4x10.3x4.1%4.4%5.3%2.1x1.9x1.8x31%20% EQM6,8259,77015.1x9.7x8.8x13.0x9.7x9.0x7.7%8.1%9.4%0.9x1.1x3.1x30%16% Median$19,052$25,89513.8x12.3x10.5x14.0x12.6x10.6x6.3%6.3%6.6%1.2x1.3x3.6x 16%6% TRGP10,24015,75212.1x10.2x8.5x11.8x9.9x8.1x7.8%7.8%7.9%1.1x1.3x3.8x19%2% Growth Metrics Financial Health Valuation Stats Market Stats
Confidential – Preliminary Draft AMGP PRO FORMA VALUATION 2018E yield vs 3-year distribution CAGR CONSIDERATIONS (CONT.) 20.0% Midstream MLP Peers Midstream C-Corp Peers 18.0% 16.0% 14.0% 12.0% growth CAGRs for publicly-traded 10.0% 8.0% 6.0% 4.0% 2.0% 0.0% 0.0% 15.0% 30.0% 3-year Distribution CAGR (2) 45.0% 60.0% Source: S&P Capital IQ as of June 15, 2018. Note: Includes: ANDX, BKEP, BPL, BPMP, CEQP, CNXM, DCP, DKL, DM, EEP, ENBL, ENLK, EPD, EQM, ETP, GEL, GLP, HEP, HESM, MMLP, M MP, MPLX, NBLX, OKE, OMP, PAA, PBFX, PSXP, RMP, SEP, SHLX, SMLP, SRLP, TCP, TLP, TRGP, VLP, WES and WPZ. (1)Based on pro forma AMGP 2019E-2022E distribution growth CAGR. (2)Represents 2018E-2021E distribution growth CAGR per Wall Street consensus estimates. Page 20 Project Bronco | 2018E Yield Key Observations Baird regressed current yields vs. distribution partnerships and companies Based on a pro forma AMGP 2019E-2022E distribution growth CAGR of 27.0% using management projections, the regression implies a yield of approximately 3.8% PF AMGP Yield Based on Regression: 3.8% (1) Implied PF AMGP Yield Based on Current Price: 7.0% y = 0.1067e-3.805x R² = 0.48
Series B Analysis
Confidential – Preliminary Draft SERIES B UNITS – SUMMARY OF KEY TERMS Series B Units entitle the holders to receive up to 5.92% of the amount of each quarterly distribution in excess of $7.5 million in respect of the IDRs of Antero Midstream AM’s quarterly IDR cash flow is distributed as follows: 1) 100% to Series A, up to $7.5 million 2) [(IDR Cash Flow less $7.5 million) x 5.92%] to Series B 3) Remaining cash flow to Series A Series B units are reserved for issuance to officers and employees of Antero Resources – Currently held mostly by senior management (Paul, Glen, etc.; exact amounts not yet disclosed) As of December 31, 2016, the Series B units were scheduled to vest ratably over a three-year period Each Series B unit holder has the right to redeem all or a portion of its vested Series B units in exchange for newly-issued AMGP common shares with a value equal to: – Pro rata share of up to 5.92% of any increase in AMGP’s equity value in excess of $2.0 billion (equity value calculated using 20-day VWAP of AMGP shares) AMGP will have the right to cause each Series B unit to be exchanged for common shares in AMGP upon the earliest of: – – – December 31, 2026 Change of control transaction Liquidation of IDR LLC The Series B units will vest upon a change of control, occurring at AMGP or IDR Holdings (the entity holding the IDRs) Upon a change of control, the Series B units are exchanged for AMGP shares as follows; – Pro rata share of up to 5.92% of any increase in AMGP’s equity value in excess of $2.0 billion (equity value calculated using 20-day VWAP of AMGP shares) Note: An AMGP acquisition of AM is not contemplated in the change of control language Page 21 Project Bronco | Change of Control Mandatory Exchange Redemption Right / Optional Exchange Holders Profits Interest
Confidential – Preliminary Draft SERIES B UNIT CASH FLOW COMPARISON ($ in millions, except per unit data) Current Run-rate 2019E 2020E 2021E 2022E Tota l IDR Pa yments Les s : Pri ori ty Ca s h Fl ow to Seri es A ($7.5 mm /q) Rema i ni ng Ca s h Fl ow Ava i l a bl e % Attributable to Series A $113.8 $235.5 $355.3 $462.0 $589.2 (30.0) (30.0) (30.0) (30.0) (30.0) $83.8 94% $205.5 94% $325.3 94% $432.0 94% $559.2 94% % Attributable to Series B 5.92% 5.92% 5.92% 5.92% 5.92% Ca s h Fl ow to Seri es A (**pre G&A a nd ta xes ) $108.8 $223.4 $336.0 $436.4 $556.1 2019E 2020E 2021E 2022E AMGP Shares Is s ued to Seri es B Pro Forma AMGP Di vi dend 18.5 $1.29 18.5 $1.77 18.5 $2.19 18.5 $2.63 Status Quo Pro Forma $49 $19 2019 2020 2021 2022 Page 22 Project Bronco | Source: Antero management projections. Pro Forma Comparison Status Quo $41 $33 $33 $24 $26 $12 Cash Flow to Series B $23.8 $32.8 $40.5 $48.7 Impl i ed "Cas h Fl ow Neutral " Shares 9.5 10.9 11.7 12.6 Cash Flow to Series B $5.0 $12.2 $19.3 $25.6 $33.1
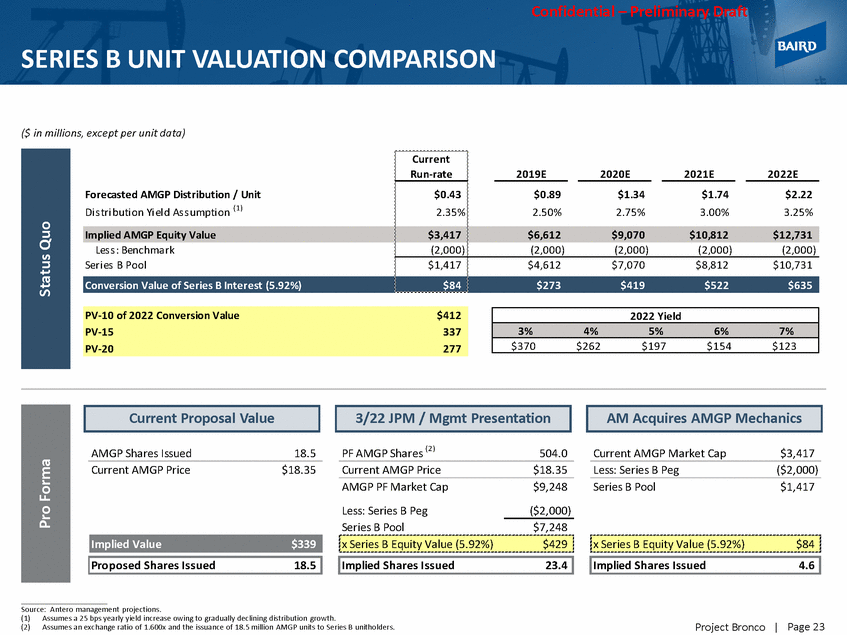
Confidential – Preliminary Draft SERIES B UNIT VALUATION COMPARISON ($ in millions, except per unit data) Current Run-rate 2019E 2020E 2021E 2022E Forecasted AMGP Distribution / Unit Di s tri buti on Yi el d As s umpti on (1) $0.43 2.35% $0.89 2.50% $1.34 2.75% $1.74 3.00% $2.22 3.25% Implied AMGP Equity Value $3,417 $6,612 $9,070 $10,812 $12,731 Les s : Benchma rk Seri es B Pool (2,000) (2,000) (2,000) (2,000) (2,000) $1,417 $4,612 $7,070 $8,812 $10,731 PF AMGP Shares (2) AMGP Shares Issued 18.5 504.0 Current AMGP Market Cap $3,417 Current AMGP Price $18.35 Current AMGP Price $18.35 Less: Series B Peg ($2,000) AMGP PF Market Cap Less: Series B Peg Series B Pool $9,248 ($2,000) Series B Pool $1,417 $7,248 Source: Antero management projections. (1)Assumes a 25 bps yearly yield increase owing to gradually declining distribution growth. (2)Assumes an exchange ratio of 1.600x and the issuance of 18.5 million AMGP units to Series B unitholders. Page 23 Project Bronco | Pro Forma Status Quo x Series B Equity Value (5.92%)$84 Implied Shares Issued4.6 x Series B Equity Value (5.92%)$429 Implied Shares Issued23.4 Implied Value$339 Proposed Shares Issued18.5 Current Proposal Value 3/22 JPM / Mgmt Presentation AM Acquires AMGP Mechanics PV-10 of 2022 Conversion Value $412 PV-15 337 PV-20 277 2022 Yield 3% 4% 5% 6% 7% $370 $262 $197 $154 $123 Conversion Value of Series B Interest (5.92%) $84 $273 $419 $522 $635
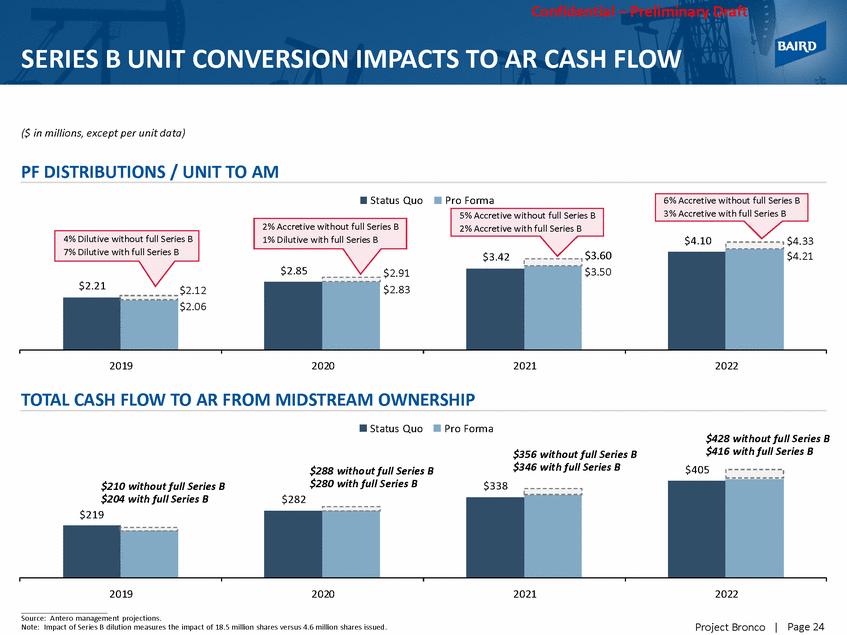
Confidential – Preliminary Draft SERIES B UNIT CONVERSION IMPACTS TO AR CASH FLOW ($ in millions, except per unit data) PF DISTRIBUTIONS / UNIT TO AM Status Quo Pro Forma 5% Accretive without full Series B 2% Accretive with full Series B 6% Accretive without full Series B 3% Accretive with full Series B 2% Accretive without full Series B 1% Dilutive with full Series B 4% Dilutive without full Series B $4.10 $4.33 2019 2020 2021 2022 TOTAL CASH FLOW TO AR FROM MIDSTREAM OWNERSHIP Status Quo Pro Forma $428 without full Series B $416 with full Series B $356 without full Series B $346 with full Series B $405 $288 without full Series B 2019 2020 2021 2022 Source: Antero management projections. Note: Impact of Series B dilution measures the impact of 18.5 million shares versus 4.6 million shares issued. Page 24 Project Bronco | $210 without full Series B$280 with full Series B$338 $204 with full Series B$282 $219 7% Dilutive with full Series B$3.42 $3.60 $4.21 $2.85 $2.91 $3.50 $2.21 $2.12 $2.83 $2.06
Deal Points Analysis
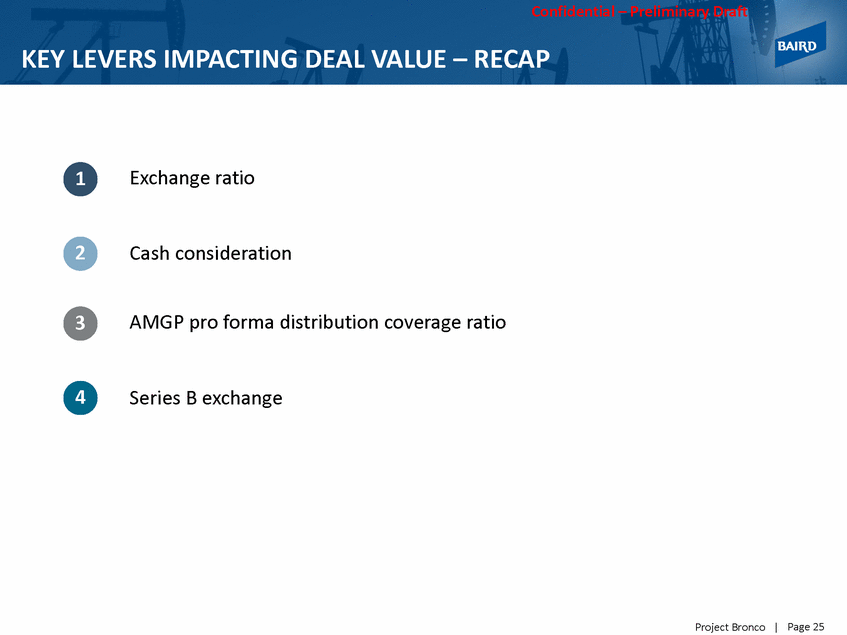
Confidential – Preliminary Draft KEY LEVERS IMPACTING DEAL VALUE – RECAP Exchange ratio 1 2 Cash consideration AMGP pro forma distribution coverage ratio 3 4 Series B exchange Page 25 Project Bronco |
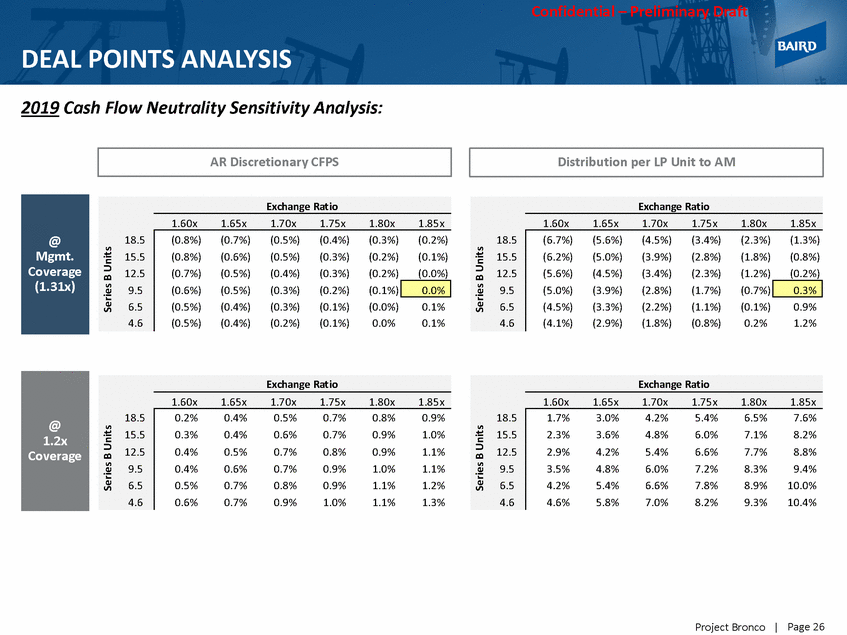
Confidential – Preliminary Draft DEAL POINTS ANALYSIS 2019 Cash Flow Neutrality Sensitivity Analysis: 2.3% 3.6% 4.8% 6.0% 7.1% 8.2% 3.5% 4.8% 6.0% 7.2% 8.3% 9.4% Page 26 Project Bronco | Series B Units Series B Units Series B Units Series B Units 0% Exchange Ratio 1.60x 1.65x 1.70x 1.75x 1.80x 1.85x 18.5 15.5 12.5 9.5 6.5 4.6 1.7% 3.0% 4.2% 5.4% 6.5% 7.6% 2.9% 4.2% 5.4% 6.6% 7.7% 8.8% 4.2% 5.4% 6.6% 7.8% 8.9% 10.0% 4.6% 5.8% 7.0% 8.2% 9.3% 10.4% 0% Exchange Ratio 1.60x 1.65x 1.70x 1.75x 1.80x 1.85x 18.5 15.5 12.5 9.5 6.5 4.6 0.2% 0.4% 0.5% 0.7% 0.8% 0.9% 0.3% 0.4% 0.6% 0.7% 0.9% 1.0% 0.4% 0.5% 0.7% 0.8% 0.9% 1.1% 0.4% 0.6% 0.7% 0.9% 1.0% 1.1% 0.5% 0.7% 0.8% 0.9% 1.1% 1.2% 0.6% 0.7% 0.9% 1.0% 1.1% 1.3% @ 1.2x Coverage @ Mgmt. Coverage (1.31x) (7%) Exchange Ratio 1.60x 1.65x 1.70x 1.75x 1.80x 1.85x 18.5 15.5 12.5 9.5 6.5 4.6 (6.7%) (5.6%) (4.5%) (3.4%) (2.3%) (1.3%) (6.2%) (5.0%) (3.9%) (2.8%) (1.8%) (0.8%) (5.6%) (4.5%) (3.4%) (2.3%) (1.2%) (0.2%) (5.0%) (3.9%) (2.8%) (1.7%) (0.7%) (4.5%) (3.3%) (2.2%) (1.1%) (0.1%) 0.9% (4.1%) (2.9%) (1.8%) (0.8%) 0.2% 1.2% 0.3% (1%) Exchange Ratio 1.60x 1.65x 1.70x 1.75x 1.80x 1.85x 18.5 15.5 12.5 9.5 6.5 4.6 (0.8%) (0.7%) (0.5%) (0.4%) (0.3%) (0.2%) (0.8%) (0.6%) (0.5%) (0.3%) (0.2%) (0.1%) (0.7%) (0.5%) (0.4%) (0.3%) (0.2%) (0.0%) (0.6%) (0.5%) (0.3%) (0.2%) (0.1%) (0.5%) (0.4%) (0.3%) (0.1%) (0.0%) 0.1% (0.5%) (0.4%) (0.2%) (0.1%) 0.0% 0.1% 0.0% AR Discretionary CFPS Distribution per LP Unit to AM
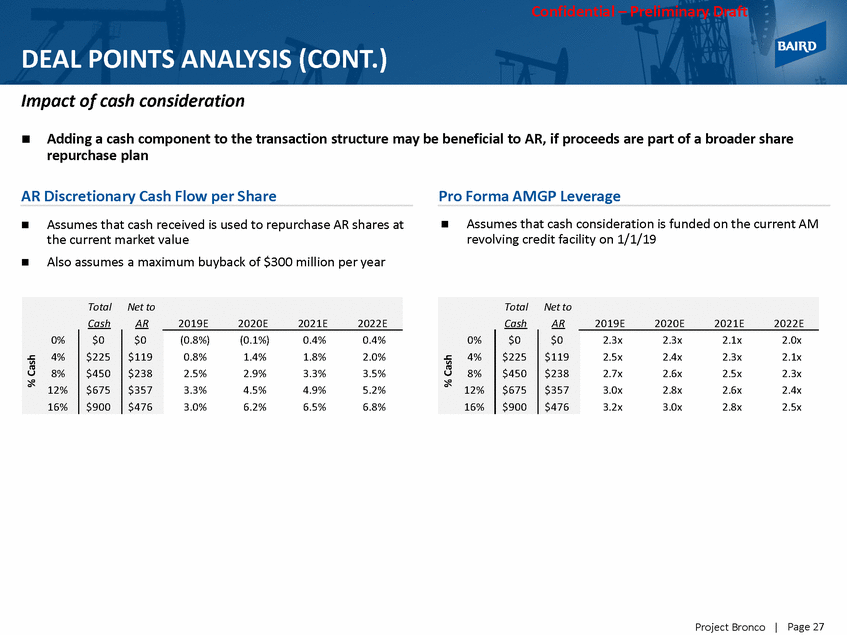
Confidential – Preliminary Draft DEAL POINTS ANALYSIS (CONT.) Impact of cash consideration Adding a cash component to the transaction structure may be beneficial to AR, if proceeds are part of a broader share repurchase plan AR Discretionary Cash Flow per Share Pro Forma AMGP Leverage Assumes that cash consideration is funded on the current AM revolving credit facility on 1/1/19 Assumes that cash received is used to repurchase AR shares at the current market value Also assumes a maximum buyback of $300 million per year Page 27 Project Bronco | % Cash % Cash Total Net to Cash AR 2019E 2020E 2021E 2022E 0% 4% 8% 12% 16% $0 $225 $450 $675 $900 $0 $119 $238 $357 $476 2.3x 2.3x 2.1x 2.0x 2.5x 2.4x 2.3x 2.1x 2.7x 2.6x 2.5x 2.3x 3.0x 2.8x 2.6x 2.4x 3.2x 3.0x 2.8x 2.5x Total Net to Cash AR 2019E 2020E 2021E 2022E 0% 4% 8% 12% 16% $0 $225 $450 $675 $900 $0 $119 $238 $357 $476 (0.8%) (0.1%) 0.4% 0.4% 0.8% 1.4% 1.8% 2.0% 2.5% 2.9% 3.3% 3.5% 3.3% 4.5% 4.9% 5.2% 3.0% 6.2% 6.5% 6.8%
