Confidential – Preliminary Draft PROJECT BRONCO FOLLOW-UP DISCUSSION TOPICS July 6, 2018 Project Bronco |

Confidential – Preliminary Draft PROJECT BRONCO FOLLOW-UP DISCUSSION TOPICS July 6, 2018 Project Bronco |

Confidential – Preliminary Draft DISCUSSION TOPICS 1 Recap of July 3 Meeting Tax Update 2 Follow-up Requests from July 3 Meeting 3 Page 1 Project Bronco |
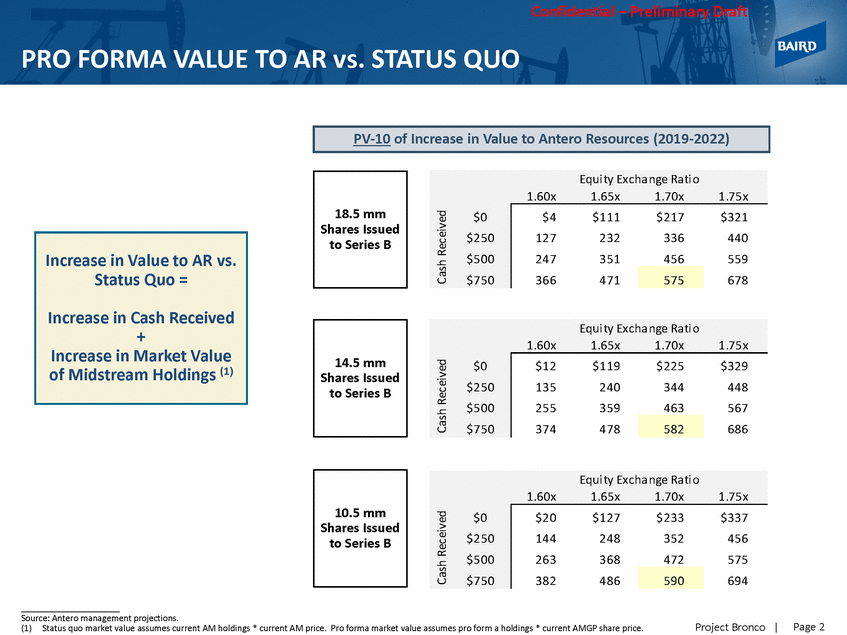
Confidential – Preliminary Draft PRO FORMA VALUE TO AR vs. STATUS QUO 1.60x 1.65x 1.70x 1.75x Shares Issued Source: Antero management projections. (1) Status quo market value assumes current AM holdings * current AM price. Pro forma market value assumes pro form a holdings * current AMGP share price. Page 2 Project Bronco | Cash Received Cash Received Cash Received Equi ty Excha nge Ra ti o 1.60x 1.65x 1.70x 1.75x $0 $250 $500 $750 $20$127$233$337 144248352456 263368472575 382486694 590 10.5 mm Shares Issued to Series B Equi ty Excha nge Ra ti o $0 $250 $500 $750 $12$119$225$329 135240344448 255359463567 374478686 582 14.5 mm to Series B Increase in Value to AR vs. Status Quo = Increase in Cash Received + Increase in Market Value of Midstream Holdings (1) Equi ty Excha nge Ra ti o 1.60x 1.65x 1.70x 1.75x $0 $250 $500 $750 $4$111$217$321 127232336440 247351456559 366471678 575 18.5 mm Shares Issued to Series B PV-10 of Increase in Value to Antero Resources (2019-2022)
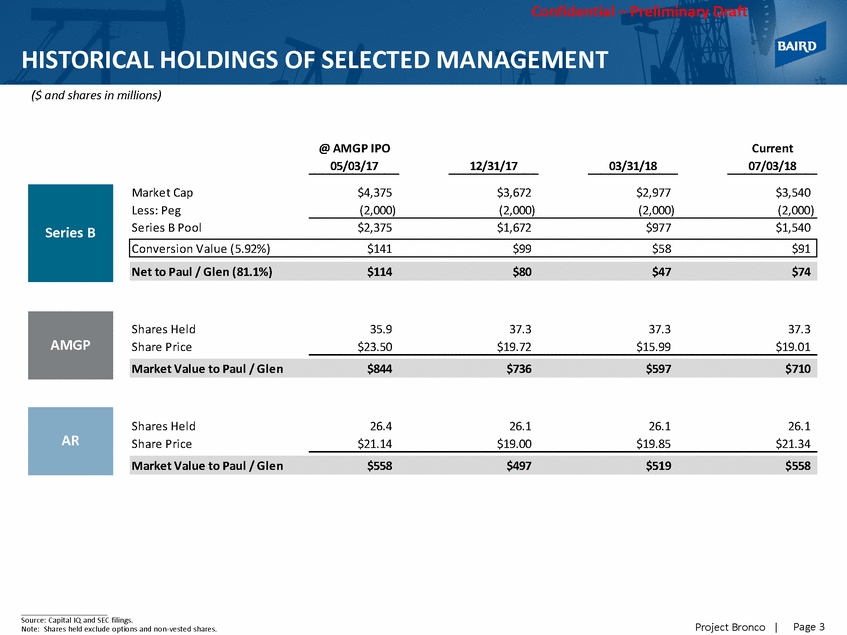
Confidential – Preliminary Draft HISTORICAL HOLDINGS ($ and shares in millions) OF SELECTED MANAGEMENT @ AMGP IPO 05/03/17 Current 07/03/18 12/31/17 03/31/18 Market Cap Less: Peg Series B Pool $4,375 $3,672 $2,977 $3,540 (2,000) (2,000) (2,000) (2,000) $2,375 $1,672 $977 $1,540 Shares Held Share Price 35.9 37.3 37.3 37.3 $23.50 $19.72 $15.99 $19.01 Market Value to Paul / Glen $844 $736 $597 $710 Shares Held Share Price 26.4 26.1 26.1 26.1 $21.14 $19.00 $19.85 $21.34 Source: Capital IQ and SEC filings. Note: Shares held exclude options and non-vested shares. Page 3 Project Bronco | Market Value to Paul / Glen $558 $497 $519 $558 AR AMGP Net to Paul / Glen (81.1%) $114 $80 $47 $74 Conversion Value (5.92%) $141 $99 $58 $91 Series B
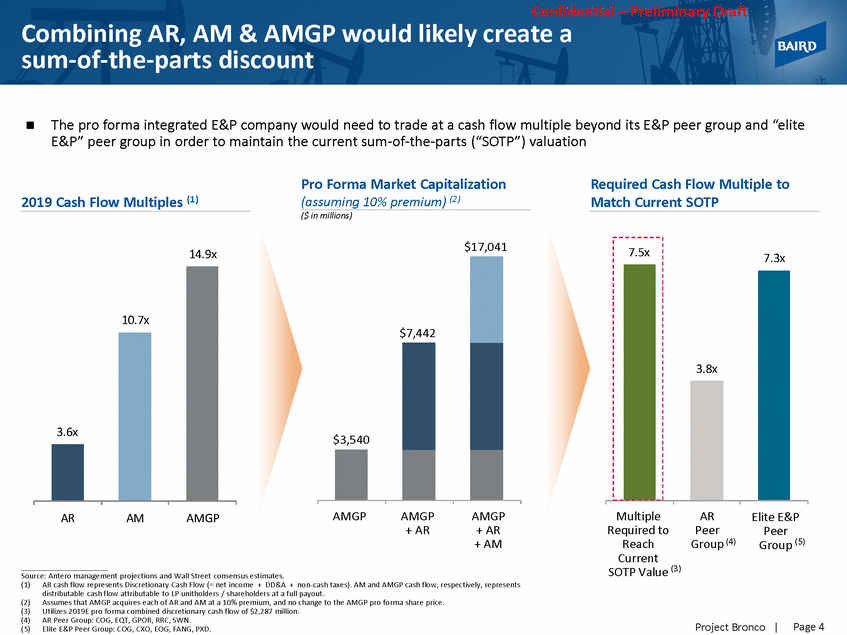
Confidential – Preliminary Draft Combining AR, AM & AMGP would likely create a sum-of-the-parts discount The pro forma integrated E&P company would need to trade at a cash flow multiple beyond its E&P peer group and “elite E&P” peer group in order to maintain the current sum-of-the-parts (“SOTP”) valuation Pro Forma Market Capitalization (assuming 10% premium) (2) Required Cash Flow Multiple to Match Current SOTP 2019 Cash Flow Multiples (1) ($ in millions) $17,041 14.9x AMGP AMGP + AR AMGP + AR + AM Multiple Required to Reach AR Elite E&P AR AM AMGP Peer Group (4) Peer Group (5) Current SOTP Value (3) Source: Antero management projections and Wall Street consensus estimates. (1) AR cash flow represents Discretionary Cash Flow (= net income + DD&A + non-cash taxes). AM and AMGP cash flow, respectively, represents distributable cash flow attributable to LP unitholders / shareholders at a full payout. Assumes that AMGP acquires each of AR and AM at a 10% premium, and no change to the AMGP pro forma share price. Utilizes 2019E pro forma combined discretionary cash flow of $2,287 million. AR Peer Group: COG, EQT, GPOR, RRC, SWN. Elite E&P Peer Group: COG, CXO, EOG, FANG, PXD. (2) (3) (4) (5) Page 4 Project Bronco | 10.7x 3.6x $7,442 $3,540 7.5x 7.3x 3.8x
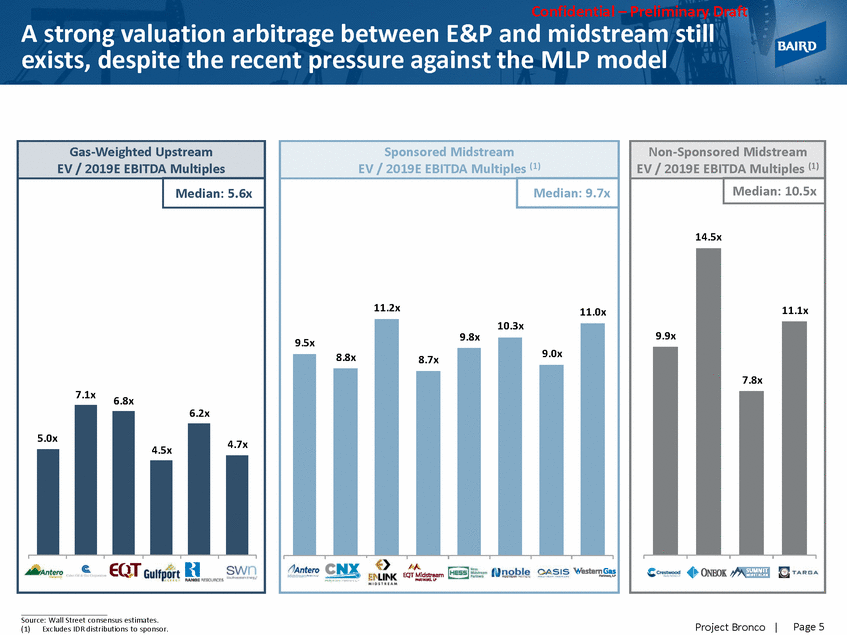
Confidential – Preliminary Draft A strong valuation arbitrage between E&P and midstream still exists, despite the recent pressure against the MLP model EV / 2019E EBITDA Multiples EV / 2019E EBITDA Multiples (1) EV / 2019E EBITDA Multiples (1) Source: Wall Street consensus estimates. (1)Excludes IDR distributions to sponsor. Page 5 Project Bronco | Sponsored Midstream Median: 9.7x 11.2x 11.0x 9.8x 9.5x 10.3x 9.0x 8.7x 8.8x Non-Sponsored Midstream Median: 10.5x 14.5x 9.9x 11.1x 7.8x Gas-Weighted Upstream Median: 5.6x 7.1x 6.8x 5.0x 6.2x 4.5x 4.7x
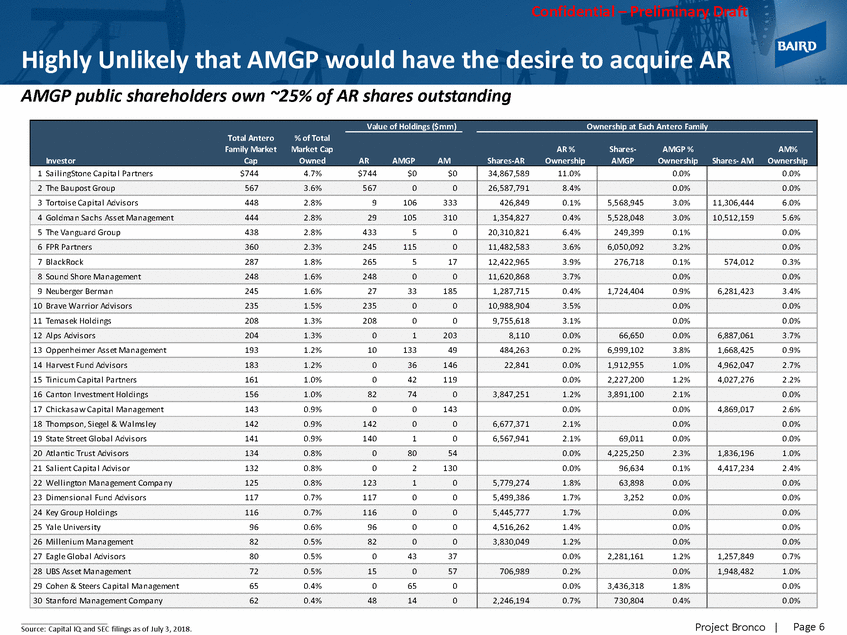
Confidential – Preliminary Draft Highly Unlikely that AMGP would have the desire AMGP public shareholders own ~25% of AR shares outstanding to acquire AR Page 6 Project Bronco | Source: Capital IQ and SEC filings as of July 3, 2018. Value of Holdings ($mm) Ownership at Each Antero Family Total Antero% of Total Family MarketMarket CapAR %Shares-AMGP %AM% InvestorCap OwnedARAMGPAMShares-AROwnership AMGPOwnershipShares-AMOwnership 1 Sa i l i ngStone Capi tal Partners$7444.7%$744$0$0 34,867,58911.0% 0.0% 0.0% 2 The Baupos t Group5673.6%56700 26,587,7918.4% 0.0% 0.0% 3 Tortoi s e Capi tal Advi s ors4482.8%9106333 426,8490.1% 5,568,9453.0% 11,306,4446.0% 4 Gol dman Sa chs As s et Management4442.8%29105310 1,354,8270.4% 5,528,0483.0% 10,512,1595.6% 5 The Vanguard Group4382.8%43350 20,310,8216.4% 249,3990.1% 0.0% 6 FPR Partners3602.3%2451150 11,482,5833.6% 6,050,0923.2% 0.0% 7 Bl ackRock2871.8%265517 12,422,9653.9% 276,7180.1% 574,0120.3% 8 Sound Shore Management2481.6%24800 11,620,8683.7% 0.0% 0.0% 9 Neuberger Berman2451.6%2733185 1,287,7150.4% 1,724,4040.9% 6,281,4233.4% 10 Brave Warri or Advi s ors2351.5%23500 10,988,9043.5% 0.0% 0.0% 11 Temas ek Hol di ngs2081.3%20800 9,755,6183.1% 0.0% 0.0% 12 Al ps Advi s ors2041.3%01203 8,1100.0% 66,6500.0% 6,887,0613.7% 13 Oppenhei mer As s et Management1931.2%1013349 484,2630.2% 6,999,1023.8% 1,668,4250.9% 14 Harves t Fund Advi s ors1831.2%036146 22,8410.0% 1,912,9551.0% 4,962,0472.7% 15 Ti ni cum Capi tal Partners1611.0%042119 0.0% 2,227,2001.2% 4,027,2762.2% 16 Canton Inves tment Hol di ngs1561.0%82740 3,847,2511.2% 3,891,1002.1% 0.0% 17 Chi ckas aw Capi tal Management1430.9%00143 0.0% 0.0% 4,869,0172.6% 18 Thomps on, Si egel & Wal ms l ey1420.9%14200 6,677,3712.1% 0.0% 0.0% 19 State Street Gl obal Advi s ors1410.9%14010 6,567,9412.1% 69,0110.0% 0.0% 20 Atl anti c Trus t Advi s ors1340.8%08054 0.0% 4,225,2502.3% 1,836,1961.0% 21 Sa l i ent Capi tal Advi s or1320.8%02130 0.0% 96,6340.1% 4,417,2342.4% 22 Wel l i ngton Management Company1250.8%12310 5,779,2741.8% 63,8980.0% 0.0% 23 Di mens i onal Fund Advi s ors1170.7%11700 5,499,3861.7% 3,2520.0% 0.0% 24 Key Group Hol di ngs1160.7%11600 5,445,7771.7% 0.0% 0.0% 25 Yal e Uni vers i ty960.6%9600 4,516,2621.4% 0.0% 0.0% 26 Mi l l eni um Management820.5%8200 3,830,0491.2% 0.0% 0.0% 27 Eagl e Gl obal Advi s ors800.5%04337 0.0% 2,281,1611.2% 1,257,8490.7% 28 UBS As s et Management720.5%15057 706,9890.2% 0.0% 1,948,4821.0% 29 Cohen & Steers Capi tal Management650.4%0650 0.0% 3,436,3181.8% 0.0% 30 Stanford Management Company620.4%48140 2,246,1940.7% 730,8040.4% 0.0%
