Confidential – Preliminary Draft PROJECT BRONCO CONFIDENTIAL DISCUSSION MATERIALS October 1, 2018 Project Bronco |
Confidential – Preliminary Draft PROJECT BRONCO CONFIDENTIAL DISCUSSION MATERIALS October 1, 2018 Project Bronco |

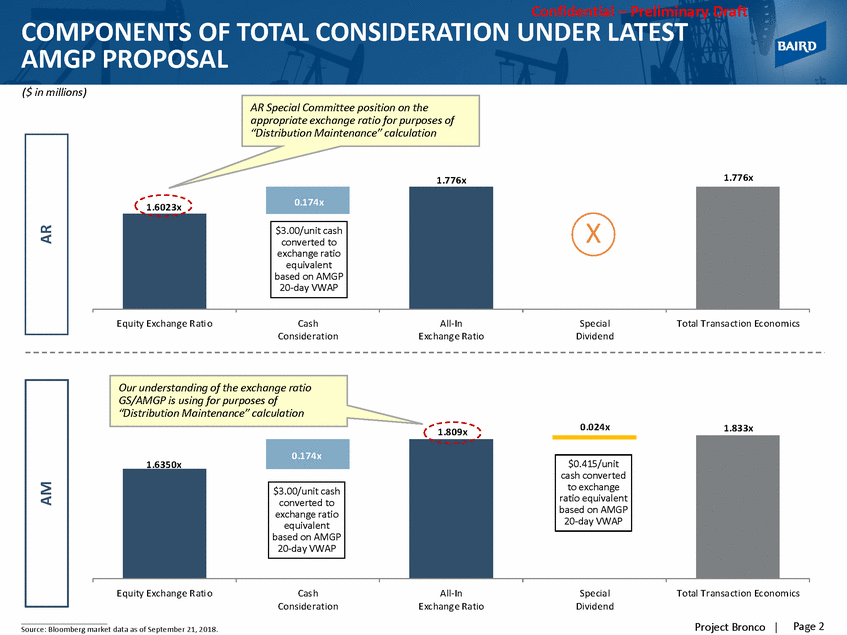
Confidential – Preliminary Draft UNDER LATEST COMPONENTS OF AMGP PROPOSAL ($ in millions) TOTAL CONSIDERATION AR Special Committee position on the appropriate exchange ratio for purposes of “Distribution Maintenance” calculation 1.776x 1.776x Equity Exchang e R ati o Cas h Consideration All-In Exchang e Ra tio Specia l Dividend Total Transa ction Economics Our understanding of the exchange ratio GS/AMGP is using for purposes of “Distribution Maintenance” calculation 0.024x 1.833x 1.809x Equity Exchang e R ati o Cas h Consideration All-In Exchang e Ra tio Specia l Dividend Total Transa ction Economics Page 2 Project Bronco | Source: Bloomberg market data as of September 21, 2018. 1.6350x converted to equivalent $3.00/unit cash exchange ratio based on AMGP 20-day VWAP $0.415/unit cash converted to exchange ratio equivalent based on AMGP 20-day VWAP 0.174x AM 1.6023x X $3.00/unit cash converted to exchange ratio equivalent based on AMGP 20-day VWAP 0.174x AR
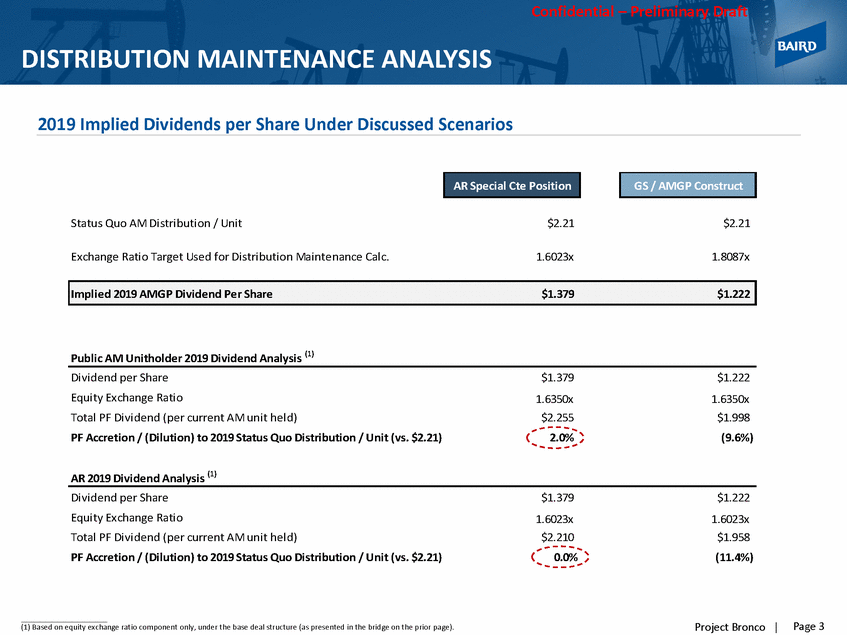
Confidential – Preliminary Draft DISTRIBUTION MAINTENANCE ANALYSIS 2019 Implied Dividends per Share Under Discussed Scenarios Status Quo AM Distribution / Unit $2.21 $2.21 Exchange Ratio Target Used for Distribution Maintenance Calc. 1.6023x 1.8087x Public AM Unitholder 2019 Dividend Analysis (1) Dividend per Share Equity Exchange Ratio Total PF Dividend (per current AM unit held) PF Accretion / (Dilution) to 2019 Status Quo Distribution / Unit (vs. $2.21) $1.379 1.6350x $2.255 2.0% $1.222 1.6350x $1.998 (9.6%) AR 2019 Dividend Analysis (1) Dividend per Share Equity Exchange Ratio Total PF Dividend (per current AM unit held) PF Accretion / (Dilution) to 2019 Status Quo Distribution / Unit (vs. $2.21) $1.379 1.6023x $2.210 0.0% $1.222 1.6023x $1.958 (11.4%) Page 3 Project Bronco | (1) Based on equity exchange ratio component only, under the base deal structure (as presented in the bridge on the prior page). Implied 2019 AMGP Dividend Per Share $1.379 $1.222 GS / AMGP Construct AR Special Cte Position
Confidential – Preliminary Draft PRO FORMA IMPACT ($ in millions, unless otherwise noted) Dividend per AR-Owned AM Unit Dividend per Public AM Unit $5.00 $5.00 4.18 4.19 4.10 $4.00 $4.00 $3.00 $3.00 2.00 $2.00 $2.00 1.31x 1.11x 1.05x $1.00 $1.00 $0.00 $0.00 2019E 2020E 2021E 2022E 2019E 2020E 2021E 2022E Dividend per AMGP Share Cash Flow to Series B $3.00 $50 $40 $33 $2.00 $30 $20 $16 $16 $1.00 $12 $10 $0.00 $0 2019E 2020E 2021E 2022E 2019E 2020E 2021E 2022E Page 4 Project Bronco | Source: Antero management projections. 2.61 2.62 2.13 2.142.22 1.72 1.731.74 1.38 1.221.34 0.89 $45 $45 Series B unaffected due to 2019 Dividend holiday$37 $37 $30 $30 $19 $26 4.10 4.27 4.28 3.42 3.48 3.49 2.85 2.81 2.82 2.21 2.26 Pro forma dividend coverage ratio would need to equal 1.19x to hold AR flat in 2019 vs. 1.31x in the Status Quo and 1.34x in the GS / AMGP case 2.21 2.21 3.42 3.41 3.42 2.85 2.76 2.76 1.96 1.16x 1.19x 1.34x Status Quo2019 Distr. Maintenance @ 1.6023x2019 Distr. Maintenance @ 1.809x
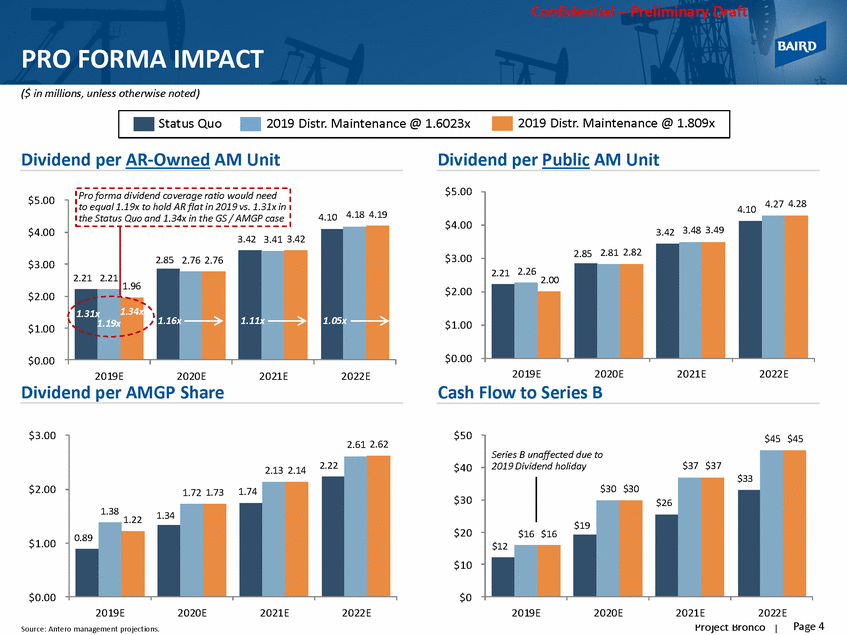
Confidential – Preliminary Draft ECONOMIC IMPACT TO AR ($ in millions, unless otherwise noted) Total Cash to AR from Midstream Holdings $405 $414 $414 $1,539 $1,516 $282 $273 $273 $194 Total Cash Through 2022 At Clos e 2019 2020 2021 2022 Page 5 Project Bronco | Source: Antero management projections. $1,244 $338 $337 $338 $297 $297 $0 $219 $219 Approximate $25 mm cash flow decline from midstream holdings using the GS / AMGP construct Status Quo2019 Distr. Maintenance @ 1.6023x2019 Distr. Maintenance @ 1.809x
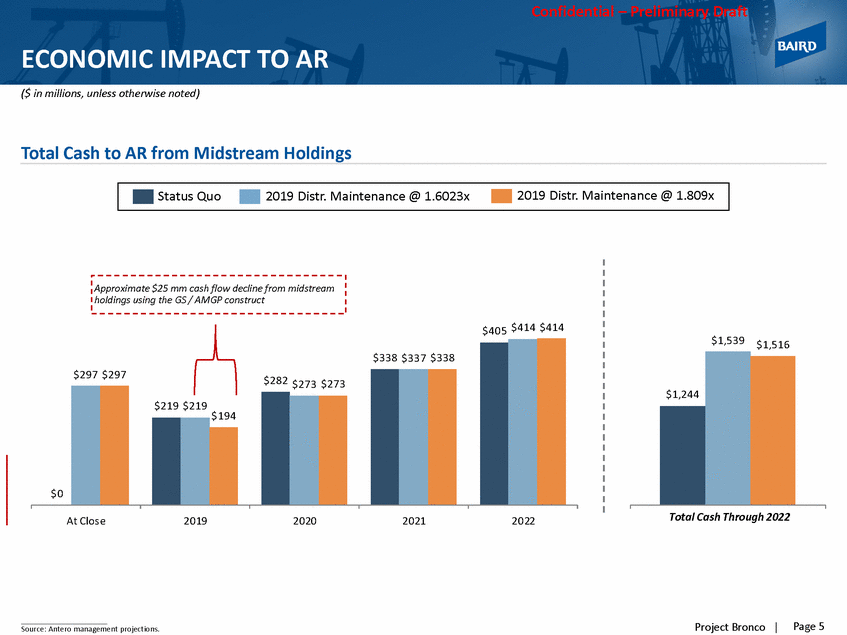
Confidential – Preliminary Draft 2018 – 2022 AR FREE CASH FLOW BRIDGE • • • • • • Cash Flow from E&P Operations Plus: AM Distributions Plus: Water Earn-Out & Lawsuit Recoveries Less: Drilling Capital Expenditures Less: Changes in Working Capital Less: Leasehold Maintenance Expenditures $1,800 $1,600 $1,400 $1,200 $1,000 $800 $600 $400 $200 $0 ($200) ($400) AR Reported FCF Generation AM Distributions Water Earn-Out Lawsuit Damage Recoveries Isolated E&P FCF Page 6 Project Bronco | Source: Antero Management projections. $1,629 ($250) ($169) ($135) ($1,413) AR Free Cash Flow Definition
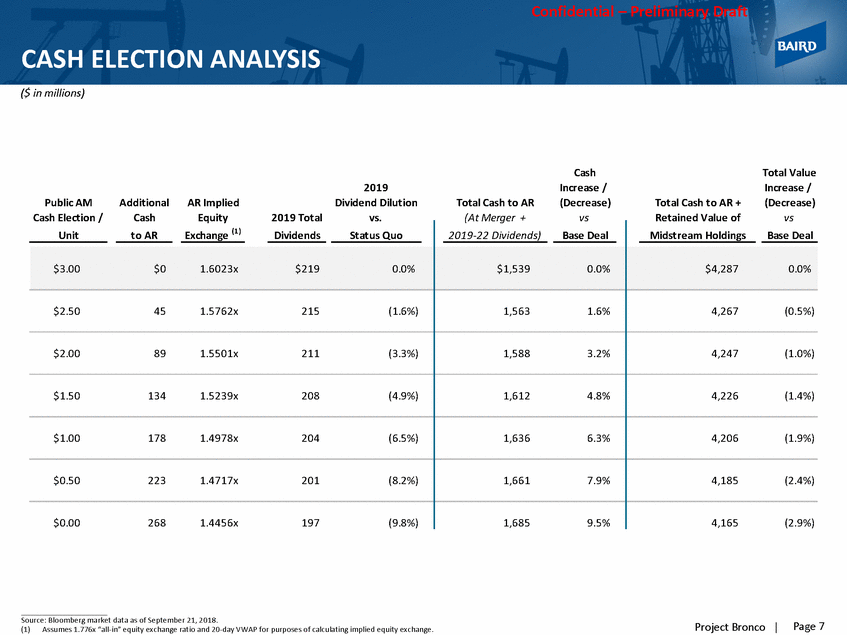
Confidential – Preliminary Draft CASH ELECTION ANALYSIS ($ in millions) Cash Increase / (Decrease) vs Total Value Increase / (Decrease) vs 2019 Dividend Dilution vs. Public AM Cash Election / Additional Cash AR Implied Equity Total Cash to AR (At Merger + Total Cash to AR + Retained Value of 2019 Total Source: Bloomberg market data as of September 21, 2018. (1)Assumes 1.776x “all-in” equity exchange ratio and 20-day VWAP for purposes of calculating implied equity exchange. Page 7 Project Bronco | Unit to AR Exchange (1 ) Dividends Status Quo 2019-22 Dividends) Base Deal Midstream Holdings Base Deal $3.00 $0 1.6023x $219 0.0% $1,539 0.0% $4,287 0.0% $2.50 45 1.5762x 215 (1.6%) 1,563 1.6% 4,267 (0.5%) $2.00 89 1.5501x 211 (3.3%) 1,588 3.2% 4,247 (1.0%) $1.50 134 1.5239x 208 (4.9%) 1,612 4.8% 4,226 (1.4%) $1.00 178 1.4978x 204 (6.5%) 1,636 6.3% 4,206 (1.9%) $0.50 223 1.4717x 201 (8.2%) 1,661 7.9% 4,185 (2.4%) $0.00 268 1.4456x 197 (9.8%) 1,685 9.5% 4,165 (2.9%)
