Confidential PROJECT BRONCO FAIRNESS OPINION October 8, 2018 MATERIALS Project Bronco |

Confidential PROJECT BRONCO FAIRNESS OPINION October 8, 2018 MATERIALS Project Bronco |

Confidential Presentation to the Special Committee of Antero Resources Corporation TABLE OF CONTENTS Baird’s Role and Process Overview Proposed Transaction Summary Valuation Approach AM Valuation Analysis AMGP Valuation Analysis Merger Consideration Analysis Supplemental Analysis 1 2 3 4 5 6 7 Page 2 Project Bronco |
Confidential BAIRD’S ROLE AND PROCESS OVERVIEW Project Bronco |
Confidential PROCESS OVERVIEW The Special Committee (the “Committee”) of the Board of Directors of Antero Resources Corporation, a Delaware corporation (“AR” or the “Company”) and owner of a 52.9% limited partner interest in Antero Midstream Partners LP, a Delaware limited partnership (“AM”), has been asked to consider the proposal by Antero Midstream GP LP, a Delaware limited partnership (“AMGP”) and indirect owner of the general partner of AM, for AM to enter into a Simplification Agreement (the “Agreement”) by and among AMGP, Arkrose Midstream Merger Sub LLC, a Delaware limited liability company and indirect subsidiary of AMGP (“Merger Sub”), AM, and the other parties thereto. Pursuant to the Agreement, among other things: (1) AMGP will convert from a Delaware limited partnership to a Delaware corporation to be renamed “Antero Midstream Corporation” upon such conversion (following such conversion, “AMGP Corp”); and (2) Merger Sub will merge with and into AM with AM continuing as the surviving limited partnership and an indirect subsidiary of AMGP Corp (such merger is referred to herein as the “Transaction”). Pursuant to the Agreement and as a result of the Transaction, each common unit of AM (“AM Common Units”) issued and outstanding and held by the Company immediately prior to the Effective Time (as defined in the Agreement) shall be converted into the right to receive 1.6023 shares of common stock, par value $0.01 per share, of AMGP Corp (“AMGP Common Stock”) and $3.00 in cash, subject to AR’s right to elect under certain circumstances to take additional cash (in lieu of a corresponding number of shares of AMGP Common Stock, on the terms set forth in the Agreement) (the foregoing consideration to be received by AR is referred to herein as the “Consideration”). In connection with its consideration of the Transaction, the Committee has requested that Robert W. Baird & Co. Incorporated (“Baird” or “we”) provide our opinion as to the fairness from a financial point of view, to the Company and the unaffiliated stockholders of the Company, of the Consideration to be received by the Company in the Transaction. The Committee has not asked us to express, and we are not expressing, any opinion with respect to any of the other financial or non-financial terms, conditions, determinations or actions with respect to the Transaction, including the fairness of the consideration to be received by any unitholder of AM other than the Company Page 4 Project Bronco |
Confidential PROCESS OVERVIEW (CONT.) …Continued Further, the Committee has not asked us to express, and we are not expressing, any opinion as to the individual shares of AMGP Common Stock and/or cash components, or the relative proportional amounts thereof, of the Consideration. In conducting our financial analyses and in arriving at our opinion herein, we have reviewed such information and have taken into account such financial and economic factors, investment banking procedures and considerations as we have deemed relevant under the circumstances. In that connection, and subject to the various assumptions, qualifications and limitations set forth herein, we have, among other things: Participated in meetings with management of AR, AM and AMGP (collectively, “management”) and the Committee and its legal counsel, during which the background on the Transaction was discussed; Reviewed certain internal information, primarily financial in nature, including financial forecasts concerning the business and operations of AM, AMGP and AMGP Corp. and the contemplated strategic, operating and cost benefits associated with the Transaction furnished to us, and certified, by management for purposes of our analysis (collectively, the “Forecasts”); Participated in subsequent calls and meetings with management regarding the Forecasts and their underlying assumptions and for review and updates regarding AR, AM, AMGP and AMGP Corp. and certain of their respective assets; Reviewed certain publicly available information including, but not limited to, AR’s, AM’s and AMGP’s recent filings with the Securities and Exchange Commission and equity analyst research reports covering AR, AM and AMGP prepared by various investment banking and research firms; Page 5 Project Bronco |
Confidential PROCESS OVERVIEW (CONT.) …Continued In conjunction with the Committee and its legal counsel, reviewed the initial proposal letter and associated supporting materials provided by the Conflicts Committee of AMGP dated June 8, 2018, as well as subsequent counterproposal letters from the Conflicts Committee of AMGP and the Conflicts Committee of AM, in each case, as provided to us; In conjunction with the Committee and its legal counsel, reviewed the principal financial terms of the Agreement (draft dated October 7, 2018); Reviewed the proposed financial terms of the Transaction and the reported financial terms of certain other transactions we deemed relevant; Reviewed the historical market prices, trading activity and market trading multiples of AM Common Units and AMGP common shares, as well as those of certain other publicly-traded partnerships and companies we deemed relevant; Considered the present values of the forecasted cash flows attributable to AM, AMGP and AMGP Corp as contained in the Forecasts; Considered the present values of the forecasted stand-alone distributions to the holders of the AM Common Units and AMGP common shares as contained in the Forecasts; Considered the impact to AR of the completion of the Transaction, as reflected in the Forecasts; Reviewed certain potential pro forma financial effects of the Transaction based on information furnished to us, and prepared, by management for purposes of our analysis; and Considered various other information, financial studies, analyses and investigations and financial, economic and market criteria we deemed relevant for the preparation of our opinion. Page 6 Project Bronco |
Confidential KEY ASSUMPTIONS UNDERLYING BAIRD’S ANALYSIS We have held discussions with members of management concerning their views on general market trends, historical and current financial condition and operating results, as well as the future prospects of AR, AM, AMGP and AMGP Corp and the anticipated benefits of the proposed Transaction. We were not engaged or requested to provide, and have not provided, any advice concerning the advisability of entering into the Transaction, and we were not involved in assisting AMGP in obtaining any financing for the Transaction. In arriving at our opinion, we have assumed and relied upon, without independent verification, the accuracy and completeness of all of the financial and other information that was publicly available or provided to us by or on behalf of AR, AM and/or AMGP, including the Forecasts. We have not independently verified any information supplied to us by or on behalf of AR, AM and/or AMGP. We have not been engaged to independently verify, have not assumed any responsibility to verify, assume no liability for, and express no opinion on, any such information. We have assumed and relied upon, without any independent verification, that: None of AR, AM and AMGP is aware of any information prepared for it or its advisors that might be material to our opinion that has not been provided to us; Any adverse tax consequences with respect to AR’s receipt of the Consideration are offset by existing net operating losses of AR; All assets and liabilities (contingent or otherwise, known or unknown) of AR, AM and AMGP are set forth in the respective publicly-filed financial statements, and there is no information or facts that would make any of the information reviewed by us incomplete or misleading; Page 7 Project Bronco |
Confidential KEY ASSUMPTIONS UNDERLYING BAIRD’S ANALYSIS …Continued The financial statements of AM and AMGP provided to us present fairly the results of operations, cash flows and financial condition of AM and AMGP, respectively, for the periods, and as of the dates, indicated and were prepared in conformity with U.S. generally accepted accounting principles, consistently applied; The Forecasts were reasonably prepared on bases reflecting the best available estimates and good faith judgments of management as to the future performance of AM, AMGP and AMGP Corp, and we have relied, without independent verification, upon such Forecasts in the preparation of our opinion, although we express no opinion with respect to the Forecasts or any judgments, estimates, assumptions or basis on which they were based, and we have assumed, without independent verification, that the Forecasts, including the financial results and the strategic, operating and cost benefits currently contemplated by management will be realized in the amounts and on the time schedule contemplated in the forecasts; The Transaction will be consummated in accordance with the terms and conditions of the Agreement, which is consistent in all material respects with the draft dated October 7, 2018 (the most recent draft we have been provided), without any amendment thereto and without waiver by any party of any of the conditions to their respective obligations thereunder; The representations and warranties contained in the Agreement are true and correct subject to the qualifications stated therein and that each party will perform all of the covenants and agreements required to be performed by it under the Agreement; The Transaction will not materially impact the tax characteristics of AMGP or AMGP Corp; and All corporate, partnership, governmental, regulatory, third party or other consents and approvals (contractual or otherwise) required to consummate the Transaction have been, or will be, obtained without the need for any changes to the Consideration or other financial terms of the Transaction or that would otherwise materially affect AR, AM, AMGP, AMGP Corp, the Transaction or our analysis. Page 8 Project Bronco |
Confidential KEY ASSUMPTIONS UNDERLYING BAIRD’S ANALYSIS …Continued We do not provide regulatory, accounting, insurance, tax or legal advice and therefore have not expressed an opinion on such matters as they relate to the Transaction. In conducting our review, we have not undertaken or obtained an independent evaluation or appraisal of any of the assets or liabilities (contingent or otherwise, known or unknown) or solvency of AM or AMGP nor have we made a physical inspection of all of the properties or facilities of AM or AMGP. We express no opinion with respect to the terms, or impact on AMGP or AMGP Corp, their financial condition, results of operation or cash flows, or on the price or trading range of AMGP common shares or shares of AMGP Common Stock, of any financing obtained, or to be obtained, by AMGP or AMGP Corp in connection with or following the Transaction. In each case, we have made the assumptions and taken the actions or inactions described herein with the knowledge and consent of the Committee. Our opinion necessarily is based upon economic, monetary, market, and other conditions as they exist and can be evaluated on the date hereof and upon certain assumptions we have made with respect thereto, and our opinion does not predict or take into account any changes which may occur, or information which may become available, after the date hereof. We are under no obligation to update, revise, reaffirm or otherwise comment on or consider events occurring after the date hereof. Furthermore, we express no opinion as to the price or trading range at which any of AR’s, AM’s, AMGP’s or AMGP Corp’s securities (including AM Common Units, AMGP common shares or shares of AMGP Common Stock) will trade following the date of our opinion or as to the effect of the Transaction on such price or trading range, or any earnings or ownership dilutive impact that may result from future issuances of securities by AR, AM, AMGP or AMGP Corp. Such price and trading range may be affected by a number of factors, including but not limited to: Page 9 Project Bronco |
Confidential KEY ASSUMPTIONS UNDERLYING BAIRD’S ANALYSIS …Continued Dispositions of shares of AR common stock, AM Common Units, AMGP common shares or shares of AMGP Common Stock within a short period of time after, or other market effects resulting from, the announcement and/or effective date of the Transaction; Changes in prevailing interest rates and other factors which generally influence the price of securities; Adverse changes in current capital markets; The occurrence of adverse changes in the financial condition, business, assets, results of operations or prospects of AR, AM, AMGP or AMGP Corp or in its related industry; Other transactions or strategic initiatives that AR, AM, AMGP or AMGP Corp may enter into prior to, concurrent with, or subsequent to, the Transaction; Changes in commodity prices; Any necessary actions by, or restrictions of, federal, state or other governmental agencies or regulatory authorities; and Timely completion of the Transaction on terms and conditions that are acceptable to all parties at interest. Our opinion has been prepared at the request of, and solely for the benefit and use of, the Committee in its consideration of the Transaction, and may not be relied upon, used for any other purpose or disclosed to any other party without our prior written consent, except as permitted under the terms of our engagement letter, dated March 15, 2018. Page 10 Project Bronco |
Confidential KEY ASSUMPTIONS UNDERLYING BAIRD’S ANALYSIS …Continued In that regard, if any description of or reference to us or our opinion is included in any proxy statement, information statement or any other public filing or any other public filing or other materials mailed, or our opinion is reproduced in any such proxy statement, then any description of or reference to us or any summary of our opinion included in any such statement, filing or mailing shall be in form and substance acceptable to us and our legal counsel in our or their respective reasonable judgments. Our opinion does not address the relative merits or risks of: The Transaction, the Agreement or any other agreements or other matters provided for, or contemplated by, the Transaction, the Agreement, or any tax strategy implemented or contemplated pursuant to the Transaction; Any other transactions that may be or might have been available as an alternative to the Transaction; or The Transaction compared to any other potential alternative transactions or business strategies considered by AR, AM, AMGP, the Committee or the Board and, accordingly, we have relied upon our discussions with the management with respect to the availability and consequences of any alternatives to the Transaction. Our opinion does not constitute a recommendation to the Committee, the Board or any other person or entity as to how any such person or entity should act with respect to the Transaction. We, based on our experience and professional judgment, made qualitative conclusions as to the relevance and significance of each analysis and factor considered by us. Therefore, our analysis must be considered as a whole. Considering any portion of the various analyses and factors reviewed, without bearing in mind all analyses, could create a misleading or incomplete view of the process underlying our opinion. Page 11 Project Bronco |
Confidential PROPOSED TRANSACTION SUMMARY Project Bronco |
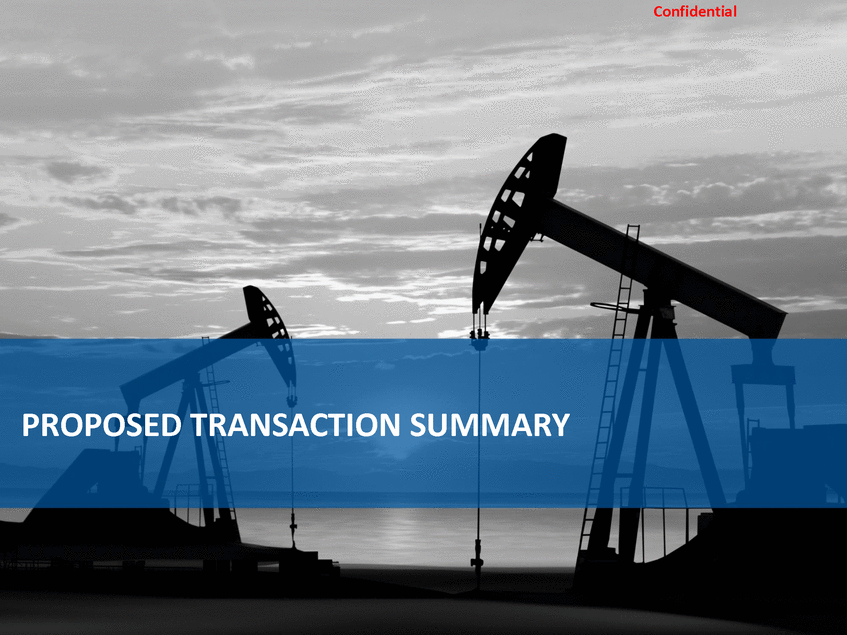
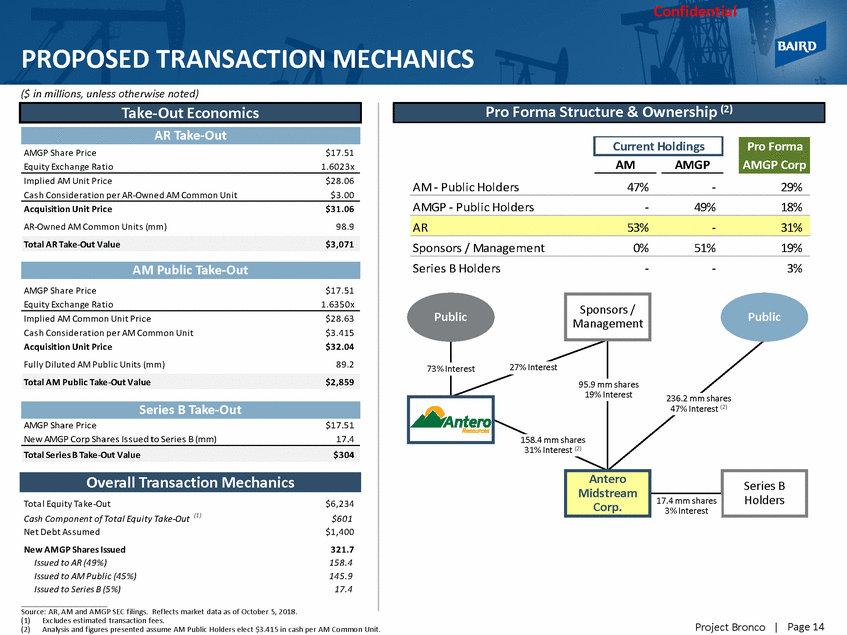
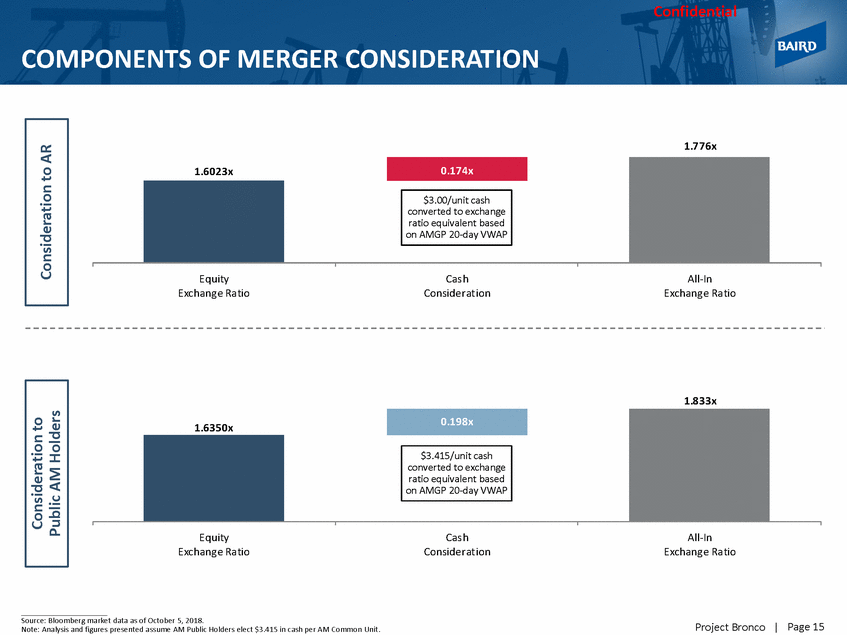
Confidential PROPOSED TRANSACTION DETAILS AMGP acquires all of the outstanding common units of AM in exchange for equity and cash Each AM Common Unit held by AR will be exchanged for (i) 1.6023 shares of AMGP stock and (ii) $3.00 in cash, implying an all-in exchange ratio of 1.776x (1) Each AM Common Unit held outside of AR (“Public AM Holders”) will be exchanged for (i) 1.6350 shares of AMGP stock and (ii) $3.415 in cash, implying an all-in exchange ratio of 1.833x (1) Public AM Holders can elect to receive additional equity in lieu of cash; AR has the right to accept additional cash and ratably reduce its equity consideration (2) The transaction will be fully taxable to holders of AM; and the pro forma AMGP will benefit from a step-up in basis AR is fully shielded from the tax impact of the transaction via its ~$3 billion NOL offset Public AM Holders (who do not have the benefit of the NOL) will receive an additional $0.415 per AM Common Unit in recognition of an anticipated cash tax liability AMGP will be reorganized as a Delaware corporation with typical C-corp corporate governance Each share representing a limited partner interest in AMGP will be converted to one share of common stock of the resulting AMGP Corp IDRs in AM held by Antero IDR Holdings, LLC, a partially-owned subsidiary of AMGP ("IDR Holdings"), will be cancelled All of the Series B Units of IDR Holdings will be exchanged in a taxable transaction for an aggregate of 17.354 million AMGP Corp shares (1)Based on 20-day VWAP as of October 5, 2018. (2)Subject to the cash and equity election provisions, pursuant to the Agreement. Page 13 Project Bronco | Ancillary Deal Points Tax Implications Merger Consideration
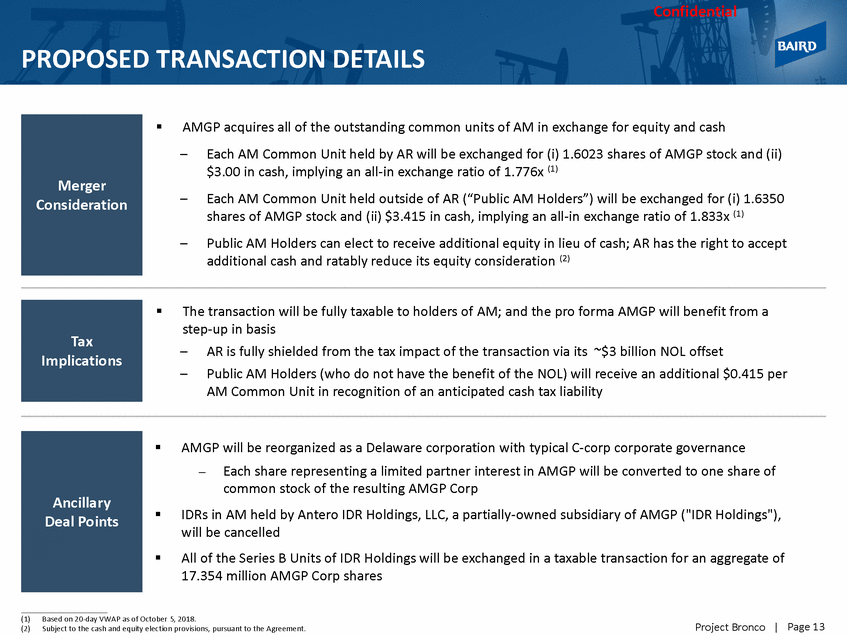
Confidential PROPOSED TRANSACTION MECHANICS ($ in millions, unless otherwise noted) AMGP Sha re Price Equity Excha nge Ra tio $17.51 1.6023x AM AMGP Implied AM Unit Price Ca s h Cons idera tion per AR-Owned AM Common Unit $28.06 $3.00 AM - Public Holders 47% - 29% AMGP - Public Holders - 49% 18% Acquisition Unit Price AR-Owned AM Common Units (mm) $31.06 98.9 Sponsors / Management 0% 51% 19% Series B Holders - - 3% AMGP Sha re Price Equity Excha nge Ra tio $17.51 1.6350x Public Public Implied AM Common Unit Price Ca s h Cons idera tion per AM Common Unit Acquisition Unit Price Fully Diluted AM Public Units (mm) $28.63 $3.415 $32.04 89.2 27% Interest 73% Interest 95.9 mm shares 19% Interest 236.2 mm shares AMGP Sha re Price New AMGP Corp Sha res Issued to Series B (mm) $17.51 17.4 158.4 mm s 31% Interest (2) Tota l Equity Ta ke-Out Cash Component of Total Equity Take-Out (1 ) Net Debt As s umed New AMGP Shares Issued Issued to AR (49%) Issued to AM Public (45%) Issued to Series B (5%) $6,234 $601 $1,400 321.7 158.4 145.9 17.4 Source: AR, AM and AMGP SEC filings. Reflects market data as of October 5, 2018. (1)Excludes estimated transaction fees. Page 14 Project Bronco | (2)Analysis and figures presented assume AM Public Holders elect $3.415 in cash per AM Common Unit. Overall Transaction Mechanics hares 47% Interest (2) Antero Midstream Corp. Series B Holders 17.4 mm shares 3% Interest Total Series B Take-Out Value $304 Series B Take-Out Total AM Public Take-Out Value $2,859 Sponsors / Management AM Public Take-Out Total AR Take-Out Value $3,071 AR 53% - 31% Pro Forma AMGP Corp Current Holdings AR Take-Out Take-Out Economics Pro Forma Structure & Ownership (2)
Confidential COMPONENTS OF MERGER CONSIDERATION 1.776x Equity Exchang e Ra tio Cas h Consideration All-In Exchang e Ra tio 1.833x Equity Exchang e Ra tio Cas h Consideration All-In Exchang e Ra tio Source: Bloomberg market data as of October 5, 2018. Note: Analysis and figures presented assume AM Public Holders elect $3.415 in cash per AM Common Unit. Page 15 Project Bronco | Public AM Holders 1.6350x $3.415/unit cash converted to exchange ratio equivalent based on AMGP 20-day VWAP 0.198x Consideration to 1.6023x $3.00/unit cash converted to exchange ratio equivalent based on AMGP 20-day VWAP 0.174x Consideration to AR
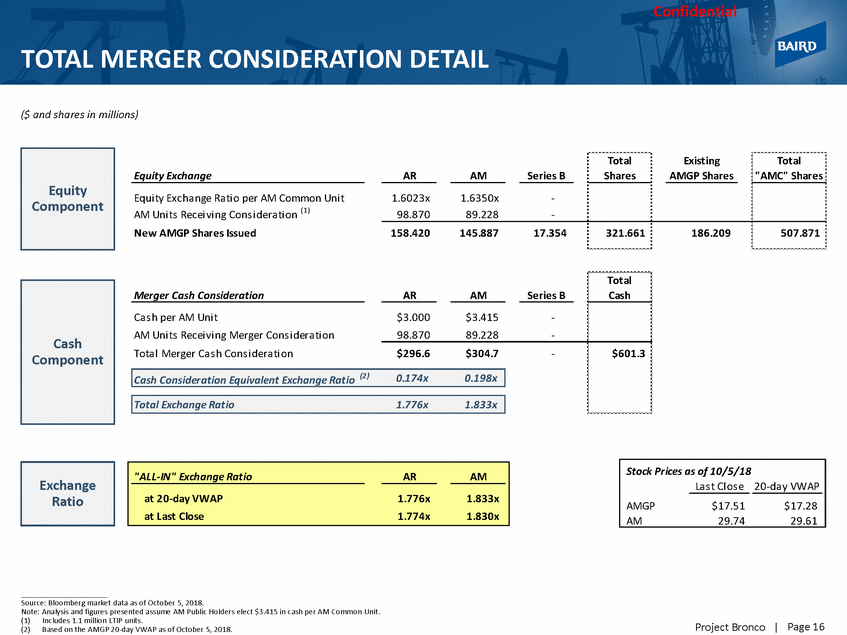
Confidential TOTAL MERGER CONSIDERATION DETAIL ($ and shares in millions) Total Shares Existing AMGP Shares Total "AMC" Shares Equity Exchange AR AM Series B Equi ty Exchange Rati o per AM Common Uni t AM Uni ts Recei vi ng Cons i derati on (1) New AMGP Shares Issued 1.6023x 1.6350x - 98.870 89.228 - 158.420 145.887 17.354 321.661 186.209 507.871 Total Series B Cash Merger Cash Consideration AR AM Ca s h per AM Uni t AM Uni ts Recei vi ng Merger Cons i dera ti on Tota l Merger Ca s h Cons i dera ti on $3.000 $3.415 - 98.870 89.228 - $296.6 $304.7 - $601.3 Source: Bloomberg market data as of October 5, 2018. Note: Analysis and figures presented assume AM Public Holders elect $3.415 in cash per AM Common Unit. (1)Includes 1.1 million LTIP units. (2)Based on the AMGP 20-day VWAP as of October 5, 2018. Page 16 Project Bronco | Exchange Ratio "ALL-IN" Exchange Ratio AR AM at 20-day VWAP 1.776x 1.833x at Last Close 1.774x 1.830x Stock Prices as of 10/5/18 Las t Cl os e 20-day VWAP AMGP $17.51 $17.28 AM 29.74 29.61 Total Exchange Ratio 1.776x 1.833x Cash Consideration Equivalent Exchange Ratio (2) 0.174x 0.198x Cash Component Equity Component
Confidential POTENTIAL BENEFITS TO AR OF THE PROPOSED TRANSACTION Addresses AR shareholder concerns regarding mis-alignment of incentives associated with the IDRs and Series B units held by AMGP and creates C-Corp structure with traditional governance Simplifies the overall Antero structure into two distinct publicly traded C-Corps AR receives an up-front premium for its units of AM (1) and greater overall cash flow from 2019 – 2022 (when considering the cash component of the merger consideration) vs. the status quo AR goes from having limited voting rights at the status quo AM to being the largest AMGP stockholder with proportionate voting rights Cash component of the transaction may facilitate potential return of capital initiatives at AR Pro forma AMGP Corp has favorable growth, balance sheet and dividend coverage characteristics relative to its peers AMGP Corp’s pro forma market capitalization and C-Corp structure result in a larger float and the potential for enhanced trading liquidity, which may improve AR’s ability to monetize its retained ownership of AMGP Corp (relative to its ability to monetize its ownership of AM in the status quo) Page 17 Project Bronco | (1) Based on closing prices for AM and AMGP as of 10/5/2018.
Confidential VALUATION APPROACH Project Bronco |

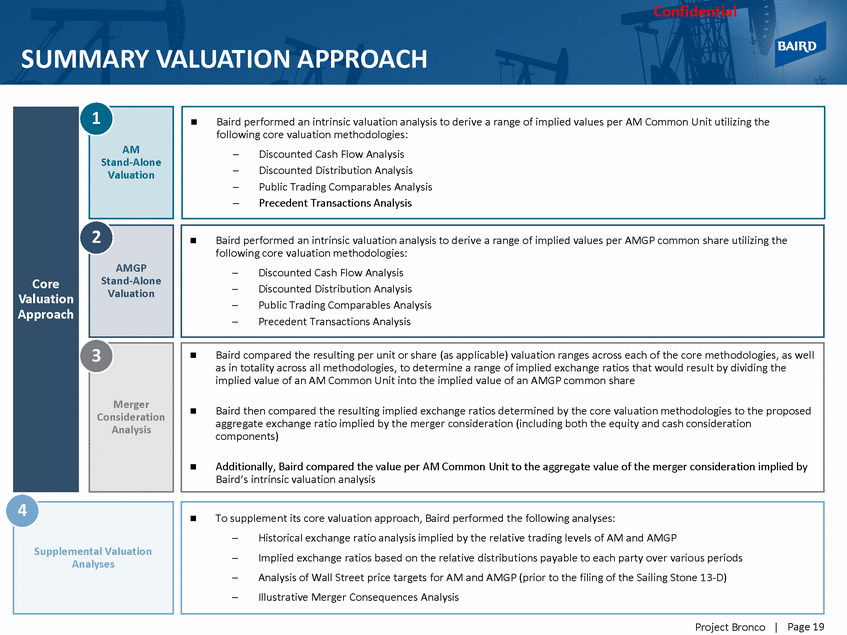
Confidential SUMMARY VALUATION APPROACH Stand-Alone – Public Trading Comparables Analysis as in totality across all methodologies, to determine a range of implied exchange ratios that would result by dividing the aggregate exchange ratio implied by the merger consideration (including both the equity and cash consideration Analyses Page 19 Project Bronco | 4 Supplemental Valuation To supplement its core valuation approach, Baird performed the following analyses: –Historical exchange ratio analysis implied by the relative trading levels of AM and AMGP –Implied exchange ratios based on the relative distributions payable to each party over various periods –Analysis of Wall Street price targets for AM and AMGP (prior to the filing of the Sailing Stone 13-D) –Illustrative Merger Consequences Analysis Baird compared the resulting per unit or share (as applicable) valuation ranges across each of the core methodologies, as well implied value of an AM Common Unit into the implied value of an AMGP common share Baird then compared the resulting implied exchange ratios determined by the core valuation methodologies to the proposed components) Additionally, Baird compared the value per AM Common Unit to the aggregate value of the merger consideration implied by Baird’s intrinsic valuation analysis 3 Merger Consideration Analysis Baird performed an intrinsic valuation analysis to derive a range of implied values per AMGP common share utilizing the following core valuation methodologies: –Discounted Cash Flow Analysis –Discounted Distribution Analysis –Precedent Transactions Analysis 2 AMGP Stand-Alone Valuation Core Valuation Approach 1 AM Valuation Baird performed an intrinsic valuation analysis to derive a range of implied values per AM Common Unit utilizing the following core valuation methodologies: –Discounted Cash Flow Analysis –Discounted Distribution Analysis –Public Trading Comparables Analysis –Precedent Transactions Analysis
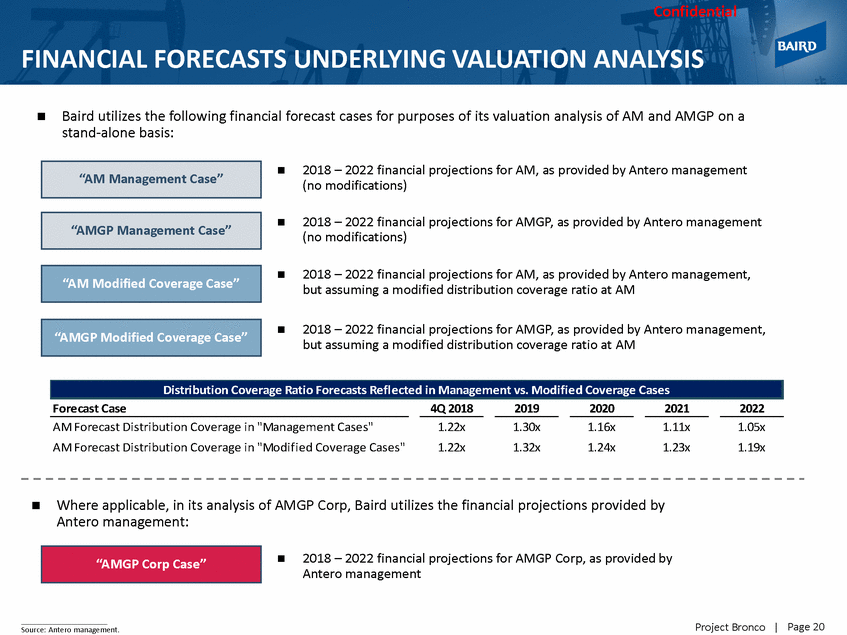
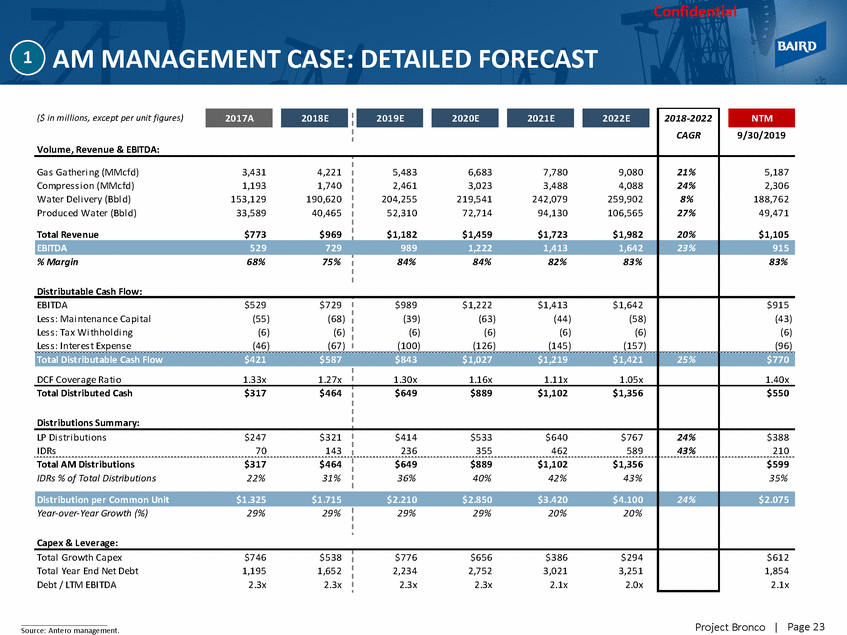
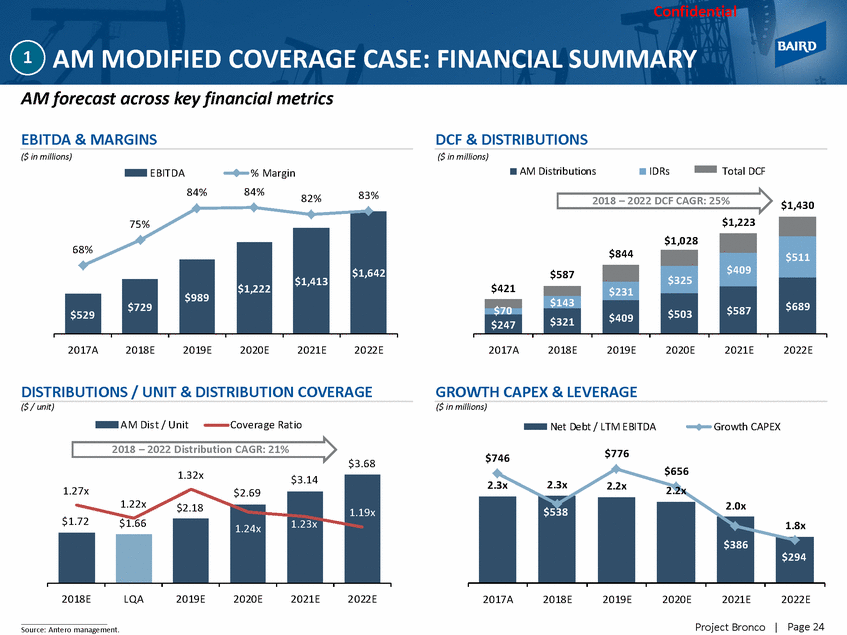
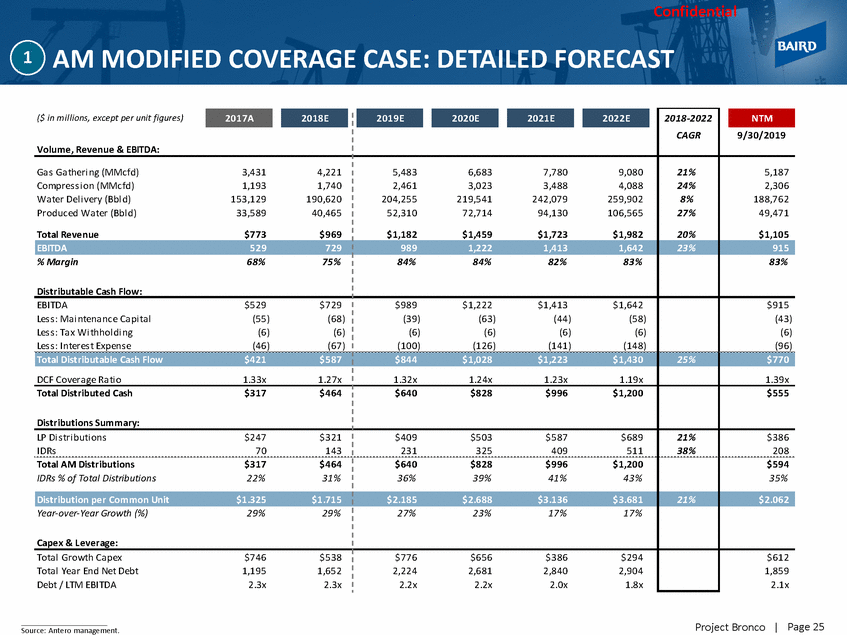
Confidential FINANCIAL FORECASTS UNDERLYING VALUATION ANALYSIS Baird utilizes the following financial forecast cases for purposes of its valuation analysis of AM and AMGP on a stand-alone basis: 2018 – 2022 financial projections for AM, as provided by Antero management (no modifications) 2018 – 2022 financial projections for AMGP, as provided by Antero management (no modifications) 2018 – 2022 financial projections for AM, as provided by Antero management, but assuming a modified distribution coverage ratio at AM 2018 – 2022 financial projections for AMGP, as provided by Antero management, but assuming a modified distribution coverage ratio at AM Forecast Case 4Q 2018 2019 2020 2021 2022 AM Forecast Distribution Coverage in "Management Cases" AM Forecast Distribution Coverage in "Modified Coverage Cases" 1.22x 1.22x 1.30x 1.32x 1.16x 1.24x 1.11x 1.23x 1.05x 1.19x Where applicable, in its analysis of AMGP Corp, Baird utilizes the financial projections provided by Antero management: 2018 – 2022 financial projections for AMGP Corp, as provided by Antero management Page 20 Project Bronco | Source: Antero management. “AMGP Corp Case” Distribution Coverage Ratio Forecasts Reflected in Management vs. Modified Coverage Cases “AMGP Modified Coverage Case” “AM Modified Coverage Case” “AMGP Management Case” “AM Management Case”
Confidential AM VALUATION ANALYSIS 1 Project Bronco |
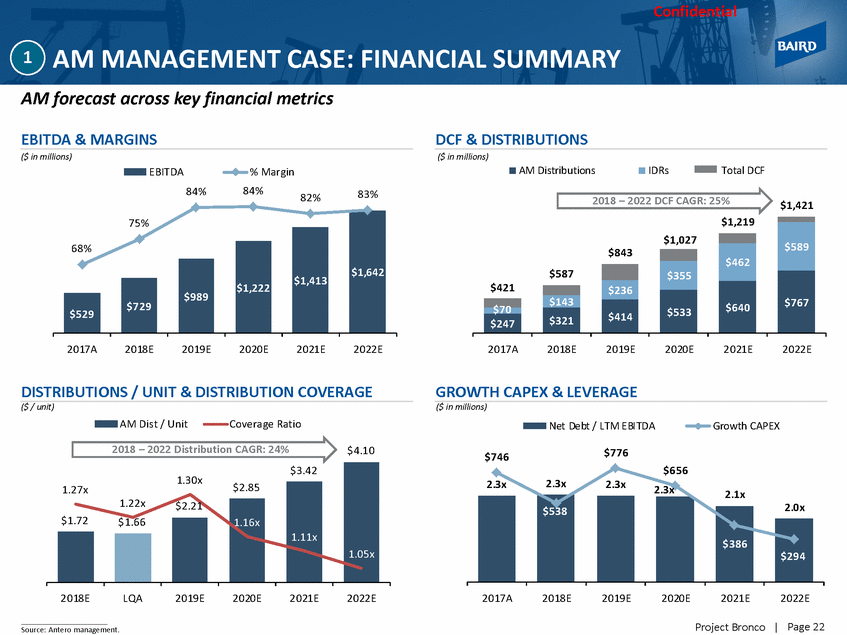
Confidential AM MANAGEMENT CASE: FINANCIAL SUMMARY 1 AM forecast across key financial metrics EBITDA & MARGINS DCF & DISTRIBUTIONS ($ in millions) ($ in millions) AM Distributions IDRs Total DCF EBITDA % Margin 84% 84% 83% 82% 2018 – 2022 DCF CAGR: 25% $1,421 2017A 2018E 2019E 2020E 2021E 2022E 2017A 2018E 2019E 2020E 2021E 2022E DISTRIBUTIONS / UNIT & DISTRIBUTION COVERAGE GROWTH CAPEX & LEVERAGE ($ / unit) ($ in millions) AM Dis t / Unit Covera ge Ratio Net Debt / LTM EBITDA Growth CAPEX 2018 – 2022 Distribution CAGR: 24% $4.10 $776 $746 $656 2.3x 1.30x 2.3x 2.3x 2.3x 2.1x 2.0x 2018E LQA 2019E 2020E 2021E 2022E 2017A 2018E 2019E 2020E 2021E 2022E Page 22 Project Bronco | Source: Antero management. $538 $386 $294 $3.42 1.05x 1.27x $2.85 1.11x 1.22x $2.21 1.16x $1.72 $1.66 $1,219 $589 $1,027 $462 $843 $587 $355 $767 $640 $236 $421 $533 $143 $414 $321 $247 75% $1,642 $1,413 68% $1,222 $989 $729 $529
Confidential AM MANAGEMENT CASE: DETAILED FORECAST 1 Page 23 Project Bronco | Source: Antero management. ($ in millions, except per unit figures) Volume, Revenue & EBITDA: 2018-2022 CAGR 9/30/2019 Ga s Ga theri ng (MMcfd) 3,431 4,221 Compres s i on (MMcfd) 1,193 1,740 Wa ter Del i very (Bbl d) 153,129 190,620 Produced Wa ter (Bbl d) 33,589 40,465 Total Revenue $773 $969 5,483 6,683 7,780 9,080 2,461 3,023 3,488 4,088 204,255 219,541 242,079 259,902 52,310 72,714 94,130 106,565 $1,182 $1,459 $1,723 $1,982 21% 24% 8% 27% 20% 5,187 2,306 188,762 49,471 $1,105 EBITDA 529 729 989 1,222 1,413 1,642 23% 915 % Margin 68% 75% 84% 84% 82% 83% 83% Distributable Cash Flow: EBITDA $529 $729 Les s : Ma i ntena nce Ca pi ta l (55) (68) Les s : Ta x Wi thhol di ng (6) (6) Les s : Interes t Expens e (46) (67) $989 $1,222 $1,413 $1,642 (39) (63) (44) (58) (6) (6) (6) (6) (100) (126) (145) (157) $915 (43) (6) (96) Total Distributable Cash Flow $421 $587 $843 $1,027 $1,219 $1,421 25% $770 DCF Covera ge Ra ti o 1.33x 1.27x 1.30x 1.16x 1.11x 1.05x 1.40x Total Distributed Cash $317 $464 Distributions Summary: $649 $889 $1,102 $1,356 $550 LP Di s tri buti ons $247 $321 IDRs 70 143 Total AM Distributions $317 $464 IDRs % of Total Distributions 22% 31% $414 $533 $640 $767 236 355 462 589 $649 $889 $1,102 $1,356 36% 40% 42% 43% 24% 43% $388 210 $599 35% Distribution per Common Unit $1.325 $1.715 $2.210 $2.850 $3.420 $4.100 24% $2.075 Year-over-Year Growth (%) 29% 29% 29% 29% 20% 20% Capex & Leverage: Tota l Growth Ca pex $746 $538 Tota l Yea r End Net Debt 1,195 1,652 Debt / LTM EBITDA 2.3x 2.3x $776 $656 $386 $294 2,234 2,752 3,021 3,251 2.3x 2.3x 2.1x 2.0x $612 1,854 2.1x NTM 2022E 2021E 2020E 2019E 2018E 2017A
Confidential AM MODIFIED COVERAGE CASE: FINANCIAL SUMMARY 1 AM forecast across key financial metrics EBITDA & MARGINS DCF & DISTRIBUTIONS ($ in millions) ($ in millions) AM Distributions IDRs Total DCF EBITDA % Margin 84% 84% 83% 82% 2018 – 2022 DCF CAGR: 25% $1,430 2017A 2018E 2019E 2020E 2021E 2022E 2017A 2018E 2019E 2020E 2021E 2022E DISTRIBUTIONS / UNIT & DISTRIBUTION COVERAGE GROWTH CAPEX & LEVERAGE ($ / unit) ($ in millions) AM Dis t / Unit Covera ge Ratio Net Debt / LTM EBITDA Growth CAPEX 2018 – 2022 Distribution CAGR: 21% $776 $746 $3.68 $656 2.2x 2.3x 2.3x 2.2x 1.27x $2.69 2018E LQA 2019E 2020E 2021E 2022E 2017A 2018E 2019E 2020E 2021E 2022E Page 24 Project Bronco | Source: Antero management. $538 2.0x $386 1.8x $294 1.32x $3.14 1.19x 1.23x 1.22x $2.18 1.24x $1.72 $1.66 $1,223 $1,028 $511 $844 $409 $587 $325 $689 $231 $587 $421 $503 $143 $409 $321 $247 75% $1,642 $1,413 68% $1,222 $989 $729 $529
Confidential AM MODIFIED COVERAGE CASE: DETAILED FORECAST 1 Page 25 Project Bronco | Source: Antero management. 2018-2022 CAGR 9/30/2019 ($ in millions, except per unit figures) Volume, Revenue & EBITDA: Ga s Ga theri ng (MMcfd) 3,431 4,221 Compres s i on (MMcfd) 1,193 1,740 Wa ter Del i very (Bbl d) 153,129 190,620 Produced Wa ter (Bbl d) 33,589 40,465 Total Revenue $773 $969 5,483 6,683 7,780 9,080 2,461 3,023 3,488 4,088 204,255 219,541 242,079 259,902 52,310 72,714 94,130 106,565 $1,182 $1,459 $1,723 $1,982 21% 24% 8% 27% 20% 5,187 2,306 188,762 49,471 $1,105 EBITDA 529 729 989 1,222 1,413 1,642 23% 915 % Margin 68% 75% Distributable Cash Flow: 84% 84% 82% 83% 83% EBITDA $529 $729 Les s : Ma i ntena nce Ca pi ta l (55) (68) Les s : Ta x Wi thhol di ng (6) (6) Les s : Interes t Expens e (46) (67) $989 $1,222 $1,413 $1,642 (39) (63) (44) (58) (6) (6) (6) (6) (100) (126) (141) (148) $915 (43) (6) (96) Total Distributable Cash Flow $421 $587 $844 $1,028 $1,223 $1,430 25% $770 DCF Covera ge Ra ti o 1.33x 1.27x 1.32x 1.24x 1.23x 1.19x 1.39x Total Distributed Cash $317 $464 Distributions Summary: $640 $828 $996 $1,200 $555 LP Di s tri buti ons $247 $321 IDRs 70 143 Total AM Distributions $317 $464 IDRs % of Total Distributions 22% 31% $409 $503 $587 $689 231 325 409 511 $640 $828 $996 $1,200 36% 39% 41% 43% 21% 38% $386 208 $594 35% Distribution per Common Unit $1.325 $1.715 $2.185 $2.688 $3.136 $3.681 21% $2.062 Year-over-Year Growth (%) 29% 29% Capex & Leverage: 27% 23% 17% 17% Tota l Growth Ca pex $746 $538 Tota l Yea r End Net Debt 1,195 1,652 Debt / LTM EBITDA 2.3x 2.3x $776 $656 $386 $294 2,224 2,681 2,840 2,904 2.2x 2.2x 2.0x 1.8x $612 1,859 2.1x NTM 2022E 2021E 2020E 2019E 2018E 2017A
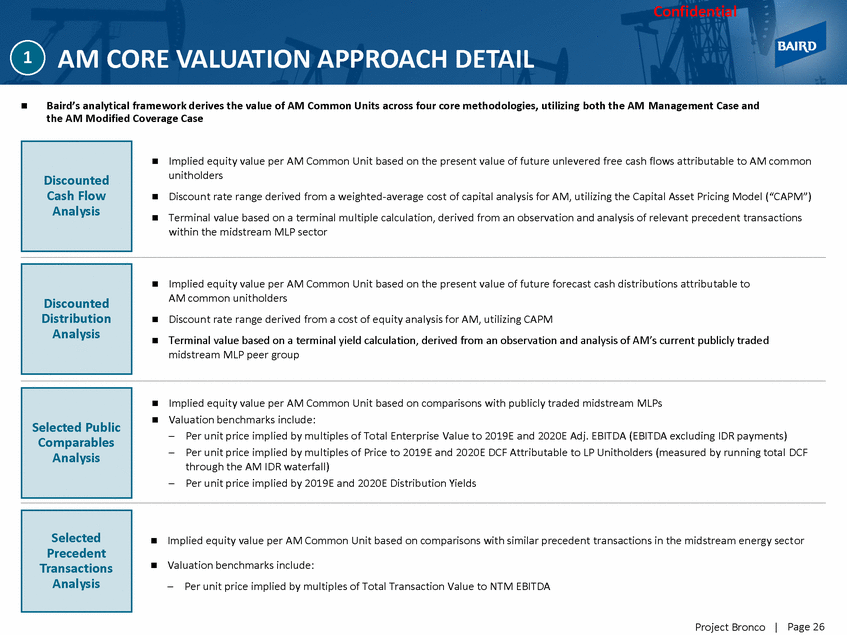
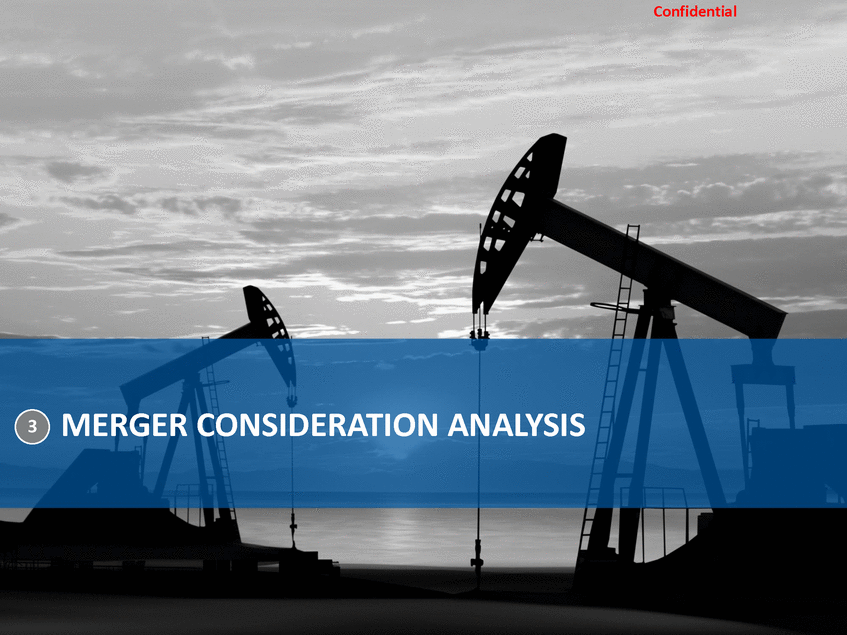
Confidential AM CORE VALUATION APPROACH DETAIL Baird’s analytical framework derives the value of AM Common Units across four core methodologies, utilizing both the AM Management Case and the AM Modified Coverage Case 1 Implied equity value per AM Common Unit based on the present value of future unlevered free cash flows attributable to AM common unitholders Discount rate range derived from a weighted-average cost of capital analysis for AM, utilizing the Capital Asset Pricing Model (“CAPM”) Terminal value based on a terminal multiple calculation, derived from an observation and analysis of relevant precedent transactions within the midstream MLP sector Implied equity value per AM Common Unit based on the present value of future forecast cash distributions attributable to AM common unitholders Discount rate range derived from a cost of equity analysis for AM, utilizing CAPM Terminal value based on a terminal yield calculation, derived from an observation and analysis of AM’s current publicly traded midstream MLP peer group Implied equity value per AM Common Unit based on comparisons with publicly traded midstream MLPs Valuation benchmarks include: – – Per unit price implied by multiples of Total Enterprise Value to 2019E and 2020E Adj. EBITDA (EBITDA excluding IDR payments) Per unit price implied by multiples of Price to 2019E and 2020E DCF Attributable to LP Unitholders (measured by running total DCF through the AM IDR waterfall) Per unit price implied by 2019E and 2020E Distribution Yields – Implied equity value per AM Common Unit based on comparisons with similar precedent transactions in the midstream energy sector Valuation benchmarks include: – Per unit price implied by multiples of Total Transaction Value to NTM EBITDA Page 26 Project Bronco | Selected Precedent Transactions Analysis Selected Public Comparables Analysis Discounted Distribution Analysis Discounted Cash Flow Analysis
Confidential AM SUMMARY VALUATION ANALYSIS 1 Implied valuation ranges per AM Common Unit across core methodologies $60.00 $50.00 $40.00 $30.00 $20.00 $10.00 Di scounted Cas h Flo w Anal ysi s Di scounted Di stri bution Analy sis Selected Publ ic Comparabl es Anal ysi s Selected Precedent Transactio ns Analy sis Implied AM Common Unit Price Ranges Reference Median Valuation Methodology Low High Di s counted Ca s h Fl ow Anal ys i s $30.58 - $40.56 $35.57 Di s counted Di s tri buti on Anal ys i s $31.48 - $40.36 $35.92 Sel ected Publ i c Comparabl es Anal ys i s $24.45 - $35.10 $29.77 Sel ected Precedent Trans acti ons Anal ys i s $29.36 - $43.40 $36.38 Page 27 Project Bronco | (1)Reference Median provided for informational purposes. $ per AM Common Unit $35.75 Median $29.97 - $40.46 $43.40 $40.56 $40.36 $35.10 $30.58 $31.48 $29.36 $24.45 Reference Median (1): $35.75
Confidential Detailed AM Valuation Analysis Discounted Cash Flow Analysis 1 Project Bronco |
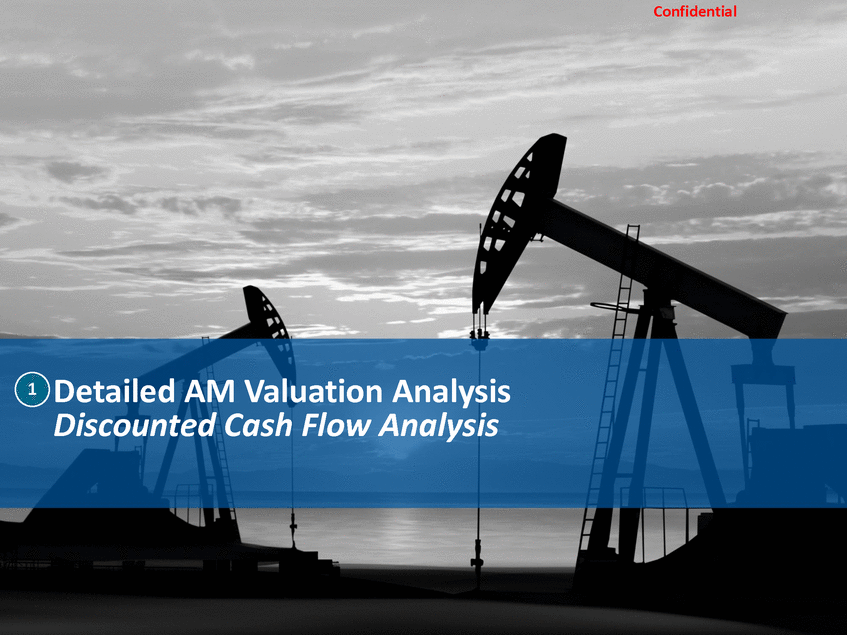
Confidential AM VALUATION SUMMARY 1 Implied valuation ranges per AM Common Unit based on Discounted Cash Flow Analysis $60.00 $50.00 $40.00 $30.00 $20.00 $10.00 Di scounted Cas h Flo w Anal ysi s Di scounted Di stri bution Analy sis Selected Publ ic Comparabl es Anal ysi s Selected Precedent Transactio ns Analy sis Implied equity value per AM Common Unit based on the present value of future unlevered free cash flows attributable to AM common unitholders Discount rate range derived from a weighted-average cost of capital analysis for AM, utilizing CAPM Terminal value based on a terminal multiple calculation, derived from an observation and analysis of precedent transactions Page 29 Project Bronco | $ per AM Common Unit Discounted Cash Flow Analysis Methodology $43.40 $40.56 $40.36 $35.10 $30.58 $31.48 $29.36 $24.45
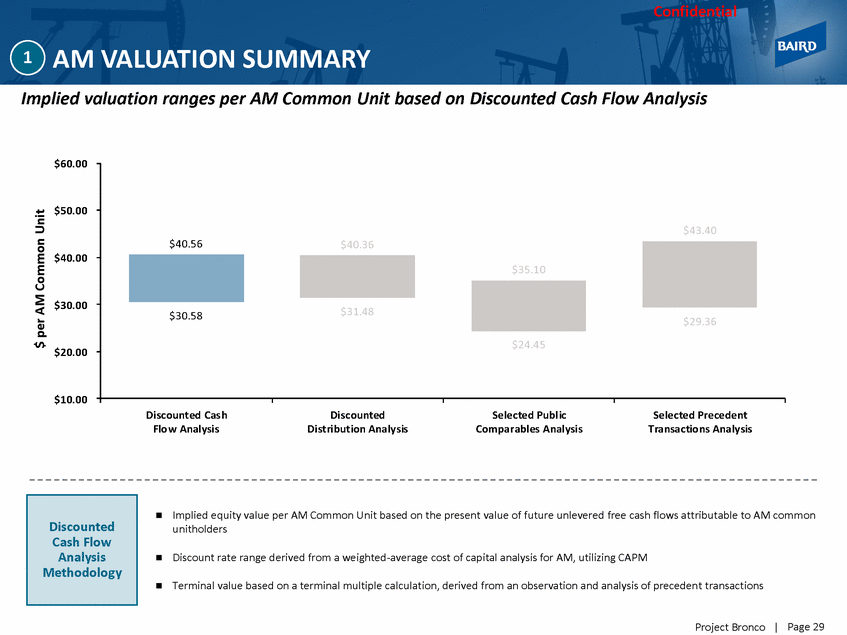
Confidential AM WEIGHTED AVERAGE COST OF CAPITAL ANALYSIS 1 ($ in millions) Ri s k-free Interes t Rate (1) Levered Beta (2) Market Premi um (3) Si ze Premi um (4) 3.3% 1.43 6.9% 0.9% Amount Interest Outstanding (6) Rate ( 7) Revol vi ng Credi t Faci l i ty 5.375% Seni or Notes Due 2024 $770 650 3.3% 5.2% Source: AM filings and Bloomberg. (1) (2) (3) (4) (5) (6) (7) Represents estimated 20-year treasury rate as of October 5, 2018. Represents two-year levered equity beta as of February 23, 2018, the date prior to the announcement of the Special Committee formation. Large company stock total returns minus long-term government bond income returns as computed by Duff & Phelps LLC. Source: Duff & Phelps LLC size premium based on AM’s equity market value as of October 5, 2018. Cost of equity is calculated using CAPM (e.g. cost of equity = risk-free interest rate + levered equity beta * market risk premium + size premium). Represents current debt outstanding, per most recently disclosed June 30, 2018 10-Q. Interest rate for publicly traded senior notes represents the yield-to-worst as of October 5, 2018. Interest rate for revolver represents effective rate per 6/30/18 10-Q. Page 30 Project Bronco | Cost of Debt $1,420 4.2% Cost of Debt Cost of Equity ( 5)14.1% Cost of Equity Cost of Capital Components Implied Weighted Average Cost of Capital (“WACC”) AM Ma rket Va l ue of Equi ty $5,562 AM Net Debt Outs ta ndi ng 1,400 Total AM Firm Value $6,963 AM Equity Market Value / Firm Value 79.9% x Cost of Equity 14.1% AM Net Debt / Firm Value 20.1% x Cost of Debt 4.2% As a result of its weighted average cost of capital analysis, Baird utilized a range of 11.0% – 13.0% for purposes of its discounted cash flow analysis herein Total Implied WACC 12.1% Cost of Debt Contribution 0.8% Cost of Equity Contribution 11.2%
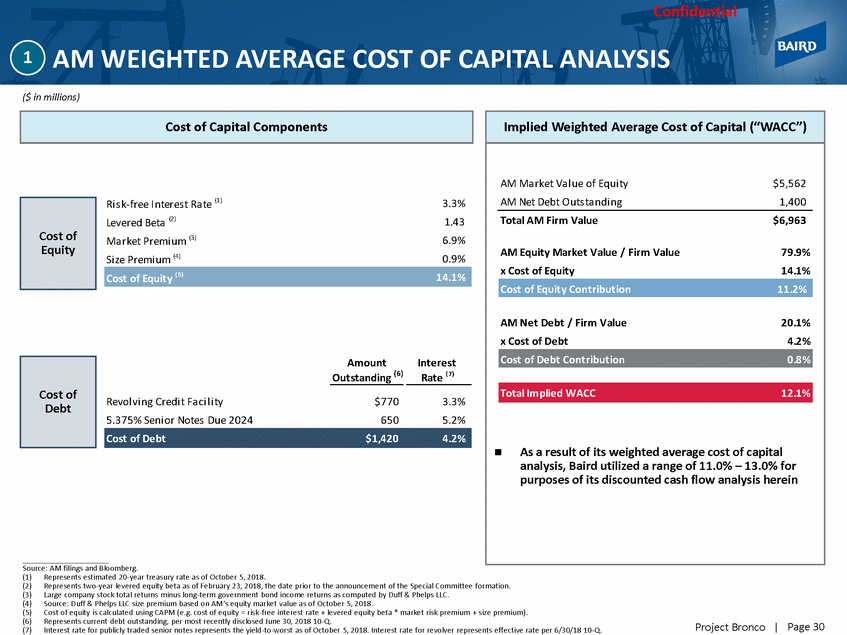
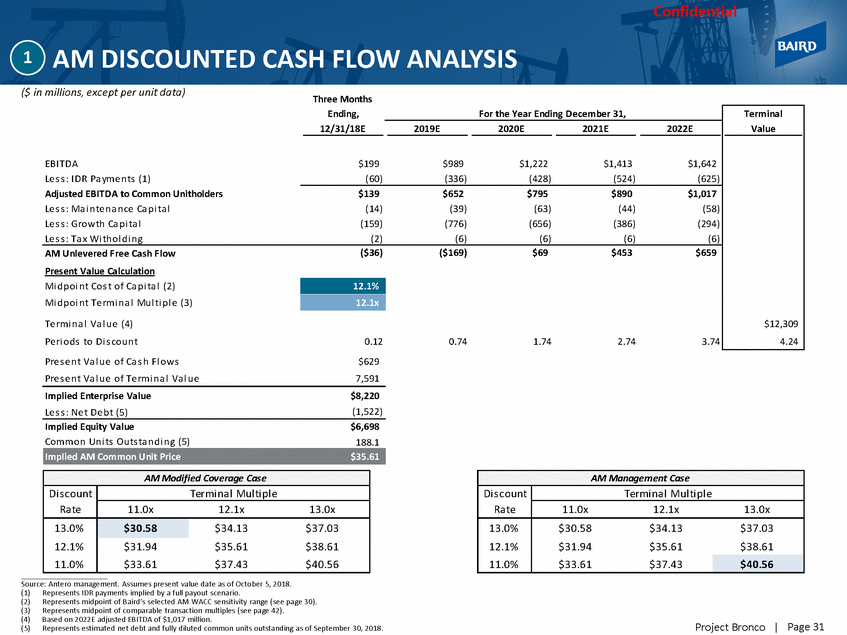
Confidential AM DISCOUNTED CASH FLOW ANALYSIS 1 ($ in millions, except per unit data) Three Months Ending, 12/31/18E EBI TDA Le s s : I DR Pa yme nts (1) Adjusted EBITDA to Common Unitholders Le s s : Ma i nte na nce Ca pi ta l Le s s : Growth Ca pi ta l Le s s : Ta x Wi thol di ng $199 (60) Pre s e nt Va l ue of Ca s h Fl ows Pre s e nt Va l ue of Te rmi na l Va l ue $629 7,591 Implied Enterprise Value $8,220 Le s s : Ne t D e b t (5) (1,522) Implied Equity Value Common Uni ts Ou ts ta ndi ng (5) $6,698 188.1 Source: Antero management. Assumes present value date as of October 5, 2018. (1) (2) (3) (4) (5) Represents IDR payments implied by a full payout scenario. Represents midpoint of Baird’s selected AM WACC sensitivity range (see page 30). Represents midpoint of comparable transaction multiples (see page 42). Based on 2022E adjusted EBITDA of $1,017 million. Represents estimated net debt and fully diluted common units outstanding as of September 30, 2018. Page 31 Project Bronco | AM Modified Coverage Case Di s count Ra te Termi na l Mul ti pl e 11.0x 12.1x 13.0x 13.0% 12.1% 11.0% $30.58 $34.13 $37.03 $31.94 $35.61 $38.61 $33.61 $37.43 $40.56 AM Management Case Di s count Ra te Termi na l Mul ti pl e 11.0x 12.1x 13.0x 13.0% 12.1% 11.0% $30.58 $34.13 $37.03 $31.94 $35.61 $38.61 $33.61 $37.43 $40.56 Implied AM Common Unit Price$35.61 For the Year Ending December 31, Terminal Value $12,309 4.24 2019E 2020E 2021E 2022E $989$1,222$1,413$1,642 (336)(428)(524)(625) $139 $652$795$890$1,017 (14)(39) (63) (44)(58) (159)(776) (656) (386)(294) (2)(6) (6) (6)(6) AM Unlevered Free Cash Flow($36)($169)$69$453$659 Present Value Calculation Mi dpoi nt Cos t of Ca pi ta l (2) Mi dpoi nt Te rmi na l Mul ti pl e (3) Te rmi na l Va l ue (4) Pe ri ods to Di s count0.120.741.742.743.74 12.1% 12.1x
Confidential Detailed AM Valuation Analysis 1 Discounted Distribution Analysis Project Bronco |
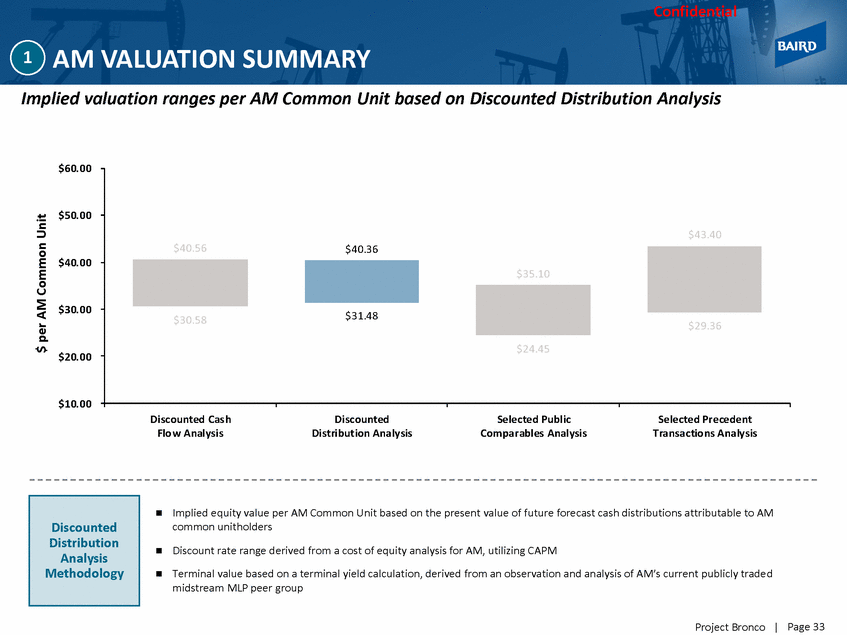
Confidential AM VALUATION SUMMARY 1 Implied valuation ranges per AM Common Unit based on Discounted Distribution Analysis $60.00 $50.00 $40.00 $30.00 $20.00 $10.00 Di scounted Cas h Flo w Anal ysi s Di scounted Di stri bution Analy sis Selected Publ ic Comparabl es Anal ysi s Selected Precedent Transactio ns Analy sis Implied equity value per AM Common Unit based on the present value of future forecast cash distributions attributable to AM common unitholders Discount rate range derived from a cost of equity analysis for AM, utilizing CAPM Terminal value based on a terminal yield calculation, derived from an observation and analysis of AM’s current publicly traded midstream MLP peer group Page 33 Project Bronco | $ per AM Common Unit Discounted Distribution Analysis Methodology $43.40 $40.56 $40.36 $35.10 $30.58 $31.48 $29.36 $24.45
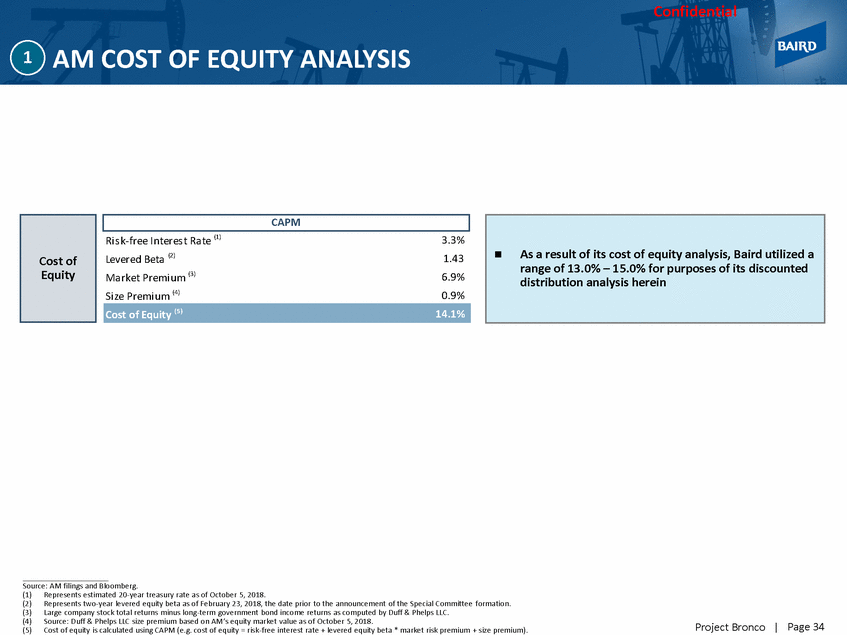
Confidential AM COST OF EQUITY ANALYSIS 1 Ri s k-free Interes t Rate (1) Levered Beta (2) Market Premi um (3) Si ze Premi um (4) 3.3% 1.43 6.9% 0.9% Source: AM filings and Bloomberg. (1) (2) (3) (4) (5) Represents estimated 20-year treasury rate as of October 5, 2018. Represents two-year levered equity beta as of February 23, 2018, the date prior to the announcement of the Special Committee formation. Large company stock total returns minus long-term government bond income returns as computed by Duff & Phelps LLC. Source: Duff & Phelps LLC size premium based on AM’s equity market value as of October 5, 2018. Cost of equity is calculated using CAPM (e.g. cost of equity = risk-free interest rate + levered equity beta * market risk premium + size premium). Page 34 Project Bronco | Cost of Equity ( 5)14.1% As a result of its cost of equity analysis, Baird utilized a range of 13.0% – 15.0% for purposes of its discounted distribution analysis herein Cost of Equity CAPM
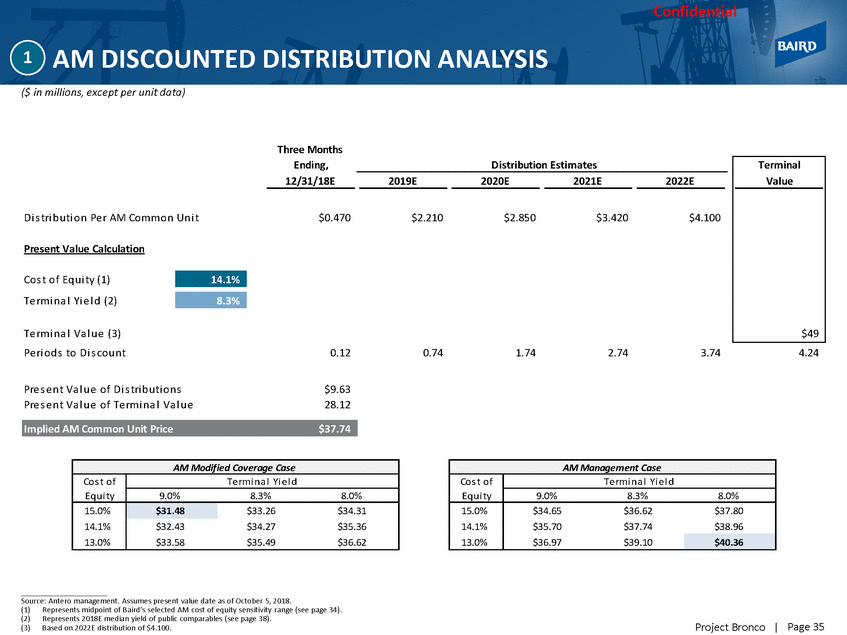
Confidential AM DISCOUNTED DISTRIBUTION ANALYSIS 1 ($ in millions, except per unit data) Three Months Ending, Distribution Estimates 12/31/18E 2019E 2020E 2021E 2022E Di s tri b u ti on Pe r AM Common Un i t $0.470 $2.210 $2.850 $3.420 $4.100 Present Value Calculation Cos t of Eq u i ty (1) Te rmi n a l Yi e l d (2) Te rmi n a l Va l u e (3) Pe ri od s to Di s cou n t 0.12 0.74 1.74 2.74 3.74 4.24 Pre s e n t Va l u e of Di s tri b u ti on s Pre s e n t Va l u e of Te rmi n a l Va l u e $9.63 28.12 Source: Antero management. Assumes present value date as of October 5, 2018. (1)Represents midpoint of Baird’s selected AM cost of equity sensitivity range (see page 34). (2)Represents 2018E median yield of public comparables (see page 38). (3)Based on 2022E distribution of $4.100. Page 35 Project Bronco | AM Modified Coverage Case Cos t of Equi ty Te rmi na l Yi e l d 9.0%8.3%8.0% 15.0% 14.1% 13.0% $31.48 $33.26$34.31 $32.43$34.27$35.36 $33.58$35.49$36.62 AM Management Case Cos t of Equi ty Te rmi na l Yi e l d 9.0%8.3%8.0% 15.0% 14.1% 13.0% $34.65$36.62$37.80 $35.70$37.74$38.96 $36.97$39.10 $40.36 Implied AM Common Unit Price $37.74 8.3% 14.1% Terminal Value $49
Confidential Detailed Selected AM Valuation Analysis Public Comparables Analysis 1 Project Bronco |
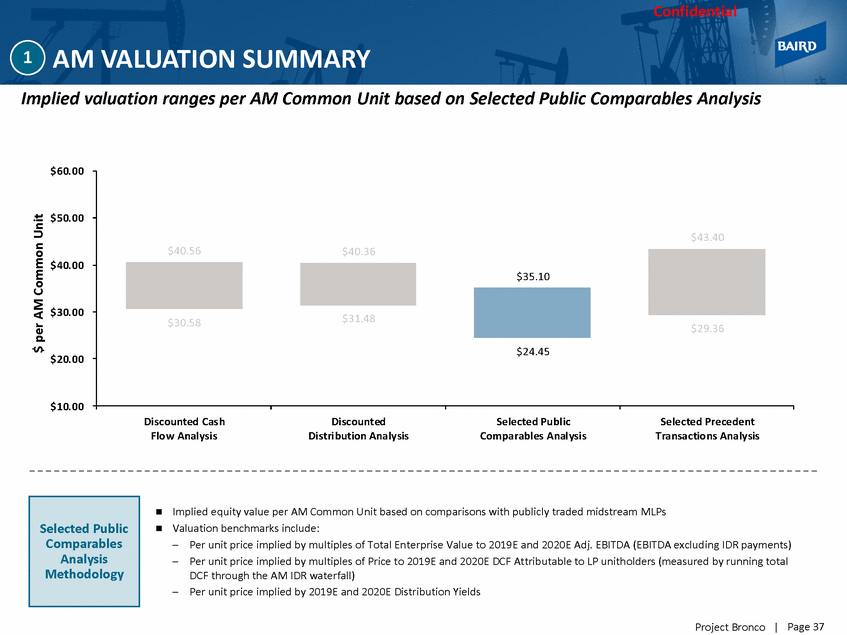
Confidential AM VALUATION SUMMARY 1 Implied valuation ranges per AM Common Unit based on Selected Public Comparables Analysis $60.00 $50.00 $40.00 $30.00 $20.00 $10.00 Di scounted Cas h Flo w Anal ysi s Di scounted Di stri bution Analy sis Selected Publ ic Comparabl es Anal ysi s Selected Precedent Transactio ns Analy sis Implied equity value per AM Common Unit based on comparisons with publicly traded midstream MLPs Valuation benchmarks include: – – Per unit price implied by multiples of Total Enterprise Value to 2019E and 2020E Adj. EBITDA (EBITDA excluding IDR payments) Per unit price implied by multiples of Price to 2019E and 2020E DCF Attributable to LP unitholders (measured by running total DCF through the AM IDR waterfall) Per unit price implied by 2019E and 2020E Distribution Yields – Page 37 Project Bronco | $ per AM Common Unit Selected Public Comparables Analysis Methodology $43.40 $40.56 $40.36 $35.10 $30.58 $31.48 $29.36 $24.45
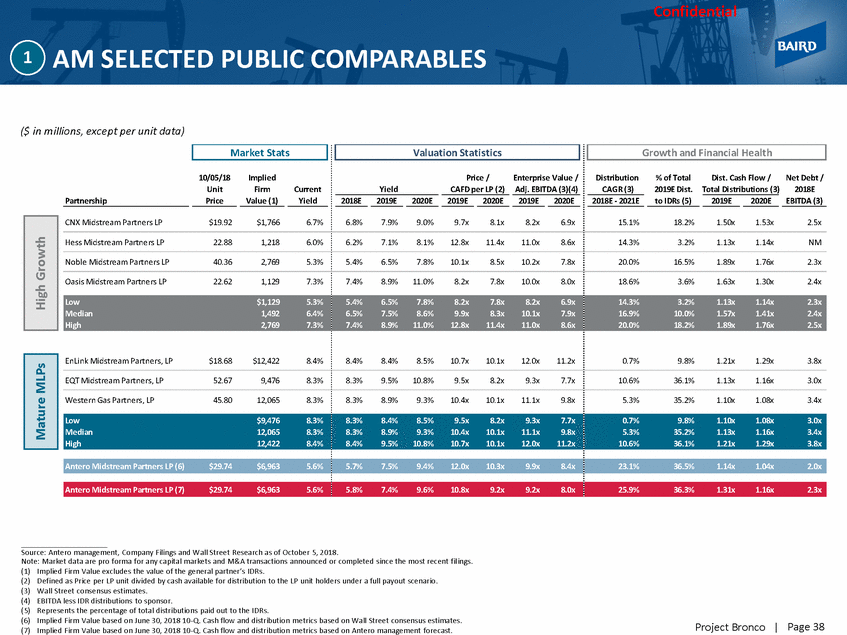
Confidential AM SELECTED PUBLIC COMPARABLES 1 ($ in millions, except per unit data) 10/05/18 Unit Implied Firm Price / Enterprise Value / Distribution% of TotalDist. Cash Flow /Net Debt / Current Yield CAFD per LP (2) Adj. EBITDA (3)(4) CAGR (3) 2019E Dist. Total Distributions (3) 2018E Partnership Price Value (1) Yield 2018E 2019E 2020E 2019E 2020E 2019E 2020E 2018E - 2021E to IDRs (5) 2019E 2020E EBITDA (3) CNX Midstream Partners LP $19.92 $1,766 6.7% 6.8% 7.9% 9.0% 9.7x 8.1x 8.2x 6.9x 15.1% 18.2% 1.50x 1.53x 2.5x Hess Midstream Partners LP 22.88 1,218 6.0% 6.2% 7.1% 8.1% 12.8x 11.4x 11.0x 8.6x 14.3% 3.2% 1.13x 1.14x NM Noble Midstream Partners LP 40.36 2,769 5.3% 5.4% 6.5% 7.8% 10.1x 8.5x 10.2x 7.8x 20.0% 16.5% 1.89x 1.76x 2.3x Oasis Midstream Partners LP 22.62 1,129 7.3% 7.4% 8.9% 11.0% 8.2x 7.8x 10.0x 8.0x 18.6% 3.6% 1.63x 1.30x 2.4x EnLink Midstream Partners, LP $18.68 $12,422 8.4% 8.4% 8.4% 8.5% 10.7x 10.1x 12.0x 11.2x 0.7% 9.8% 1.21x 1.29x 3.8x EQT Midstream Partners, LP 52.67 9,476 8.3% 8.3% 9.5% 10.8% 9.5x 8.2x 9.3x 7.7x 10.6% 36.1% 1.13x 1.16x 3.0x Western Gas Partners, LP 45.80 12,065 8.3% 8.3% 8.9% 9.3% 10.4x 10.1x 11.1x 9.8x 5.3% 35.2% 1.10x 1.08x 3.4x Source: Antero management, Company Filings and Wall Street Research as of October 5, 2018. Note: Market data are pro forma for any capital markets and M&A transactions announced or completed since the most recent fil ings. (1) (2) (3) (4) (5) (6) (7) Implied Firm Value excludes the value of the general partner’s IDRs. Defined as Price per LP unit divided by cash available for distribution to the LP unit holders under a full payout scenario. Wall Street consensus estimates. EBITDA less IDR distributions to sponsor. Represents the percentage of total distributions paid out to the IDRs. Implied Firm Value based on June 30, 2018 10-Q. Cash flow and distribution metrics based on Wall Street consensus estimates. Implied Firm Value based on June 30, 2018 10-Q. Cash flow and distribution metrics based on Antero management forecast. Page 38 Project Bronco | Antero Midstream Partners LP (7)$29.74$6,9635.6%5.8%7.4%9.6%10.8x9.2x9.2x8.0x25.9%36.3%1.31x1.16x2.3x Antero Midstream Partners LP (6)$29.74$6,9635.6%5.7%7.5%9.4%12.0x10.3x9.9x8.4x23.1%36.5%1.14x1.04x2.0x Low $9,476 8.3% 8.3% 8.4% 8.5% 9.5x 8.2x 9.3x 7.7x 0.7% 9.8% 1.10x 1.08x 3.0x Median 12,065 8.3% 8.3% 8.9% 9.3% 10.4x 10.1x 11.1x 9.8x 5.3% 35.2% 1.13x 1.16x 3.4x High 12,422 8.4% 8.4% 9.5% 10.8% 10.7x 10.1x 12.0x 11.2x 10.6% 36.1% 1.21x 1.29x 3.8x Mature MLPs Low $1,129 5.3% 5.4% 6.5% 7.8% 8.2x 7.8x 8.2x 6.9x 14.3% 3.2% 1.13x 1.14x 2.3x Median 1,492 6.4% 6.5% 7.5% 8.6% 9.9x 8.3x 10.1x 7.9x 16.9% 10.0% 1.57x 1.41x 2.4x High 2,769 7.3% 7.4% 8.9% 11.0% 12.8x 11.4x 11.0x 8.6x 20.0% 18.2% 1.89x 1.76x 2.5x High Growth Growth and Financial Health Valuation Statistics Market Stats
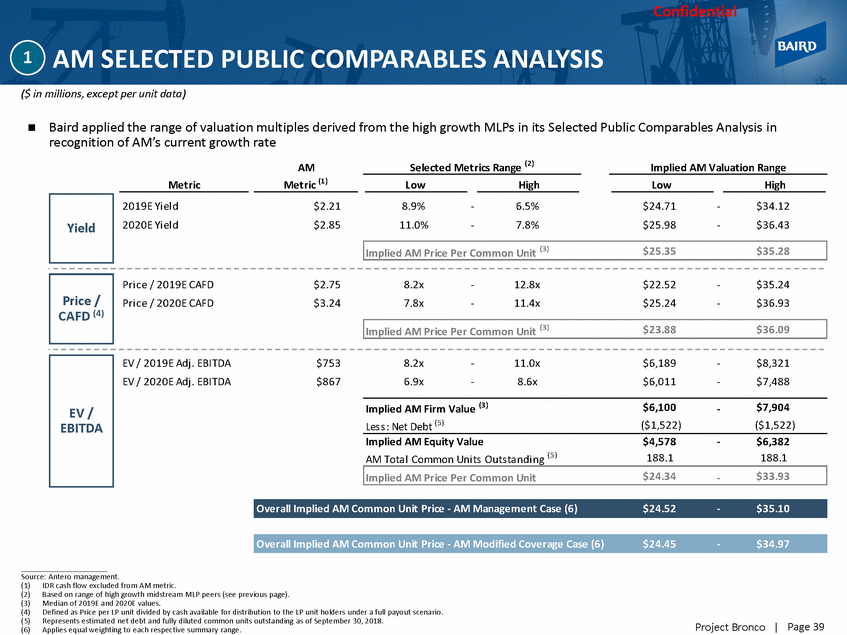
Confidential AM SELECTED PUBLIC COMPARABLES ANALYSIS 1 ($ in millions, except per unit data) Baird applied the range of valuation multiples derived from the high growth MLPs in its Selected Public Comparables Analysis in recognition of AM’s current growth rate Selected Metrics Range (2 ) AM Metric Metric (1 ) Implied AM Valuation Range Low High Low High 2019E Yi el d 2020E Yi el d $2.21 $2.85 8.9% 11.0% - - 6.5% 7.8% $24.71 $25.98 - - $34.12 $36.43 Pri ce / 2019E CAFD Pri ce / 2020E CAFD $2.75 $3.24 8.2x 7.8x - - 12.8x 11.4x $22.52 $25.24 - - $35.24 $36.93 EV / 2019E Adj . EBITDA EV / 2020E Adj . EBITDA $753 $867 8.2x 6.9x - - 11.0x 8.6x $6,189 $6,011 - - $8,321 $7,488 (3) $6,100 $7,904 ($1,522) $6,382 188.1 Implied AM Firm Value - Les s : Net Debt (5 ) ($1,522) Implied AM Equity Value AM Tota l Common Uni ts Outs ta ndi ng (5) $4,578 188.1 - Source: Antero management. (1) (2) (3) (4) (5) (6) IDR cash flow excluded from AM metric. Based on range of high growth midstream MLP peers (see previous page). Median of 2019E and 2020E values. Defined as Price per LP unit divided by cash available for distribution to the LP unit holders under a full payout scenario . Represents estimated net debt and fully diluted common units outstanding as of September 30, 2018. Applies equal weighting to each respective summary range. Page 39 Project Bronco | Overall Implied AM Common Unit Price - AM Modified Coverage Case (6) $24.45 - $34.97 Overall Implied AM Common Unit Price - AM Management Case (6) $24.52 - $35.10 Implied AM Price Per Common Unit $24.34 - $33.93 EV / EBITDA Implied AM Price Per Common Unit (3) $23.88 $36.09 Price / CAFD (4) Implied AM Price Per Common Unit (3) $25.35 $35.28 Yield
Confidential Detailed Selected AM Valuation Analysis Transactions Analysis 1 Project Bronco |
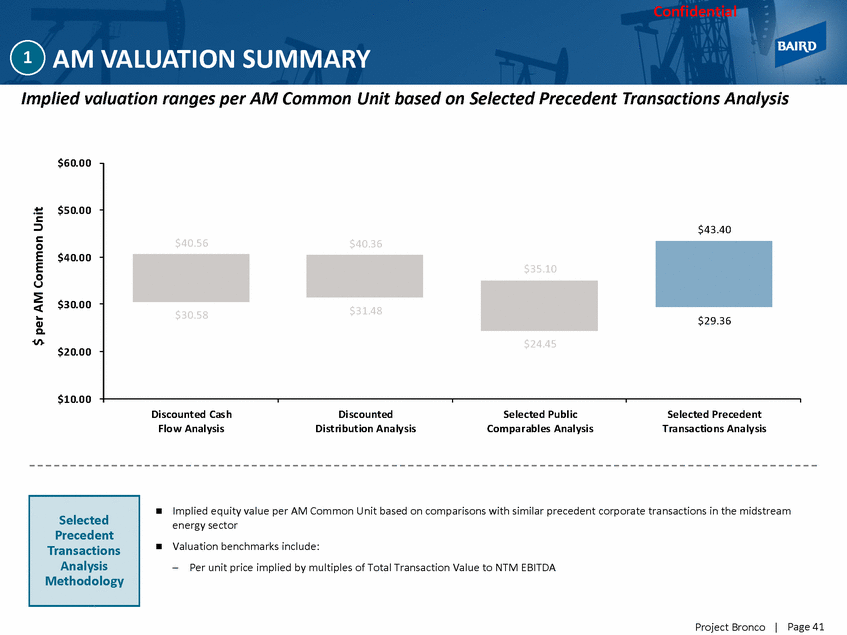
Confidential AM VALUATION SUMMARY 1 Implied valuation ranges per AM Common Unit based on Selected Precedent Transactions Analysis $60.00 $50.00 $40.00 $30.00 $20.00 $10.00 Di scounted Cas h Flo w Anal ysi s Di scounted Di stri bution Analy sis Selected Publ ic Comparabl es Anal ysi s Selected Precedent Transactio ns Analy sis Implied equity value per AM Common Unit based on comparisons with similar precedent corporate transactions in the midstream energy sector Valuation benchmarks include: – Per unit price implied by multiples of Total Transaction Value to NTM EBITDA Page 41 Project Bronco | $ per AM Common Unit Selected Precedent Transactions Analysis Methodology $43.40 $40.56 $40.36 $35.10 $30.58 $31.48 $29.36 $24.45
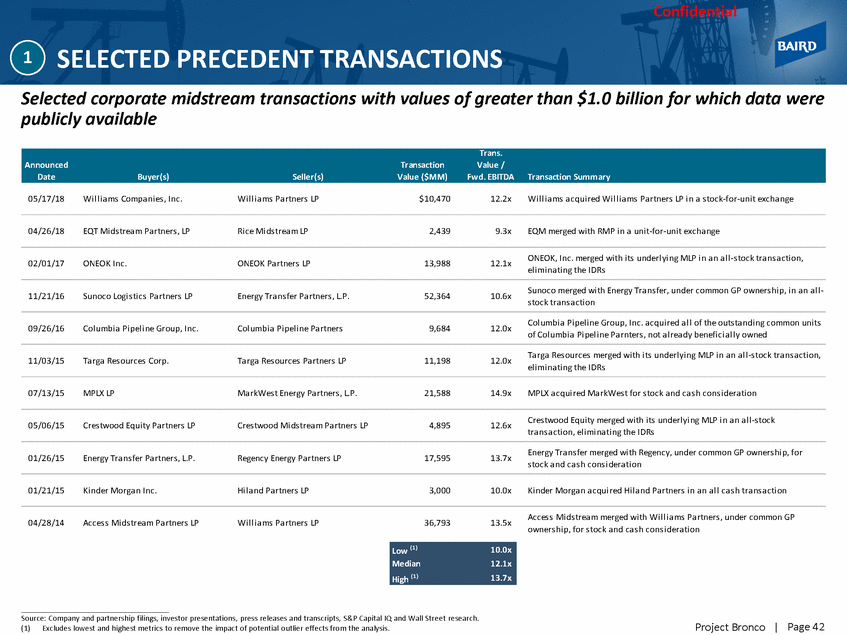
Confidential SELECTED PRECEDENT TRANSACTIONS 1 Selected corporate midstream transactions with values of greater than $1.0 billion for which data were publicly available 05/17/18 Wi l l i a ms Compa ni es , Inc. Wi l l i a ms Pa rtners LP $10,470 12.2x Wi l l i a ms a cqui red Wi l l i a ms Pa rtners LP i n a s tock-for-uni t excha nge 04/26/18 EQT Mi ds trea m Pa rtners , LP Ri ce Mi ds trea m LP 2,439 9.3x EQM merged wi th RMP i n a uni t-for-uni t excha nge ONEOK, Inc. merged wi th i ts underl yi ng MLP i n a n a l l -s tock tra ns a cti on, el i mi na ti ng the IDRs 02/01/17 ONEOK Inc. ONEOK Pa rtners LP 13,988 12.1x Sunoco merged wi th Energy Tra ns fer, under common GP owners hi p, i n a n a l l - s tock tra ns a cti on 11/21/16 Sunoco Logi s ti cs Pa rtners LP Energy Tra ns fer Pa rtners , L.P. 52,364 10.6x Col umbi a Pi pel i ne Group, Inc. a cqui red a l l of the outs ta ndi ng common uni ts of Col umbi a Pi pel i ne Pa rnters , not a l rea dy benefi ci a l l y owned 09/26/16 Col umbi a Pi pel i ne Group, Inc. Col umbi a Pi pel i ne Pa rtners 9,684 12.0x Ta rga Res ources merged wi th i ts underl yi ng MLP i n a n a l l -s tock tra ns a cti on, el i mi na ti ng the IDRs 11/03/15 Ta rga Res ources Corp. Ta rga Res ources Pa rtners LP 11,198 12.0x 07/13/15 MPLX LP Ma rkWes t Energy Pa rtners , L.P. 21,588 14.9x MPLX a cqui red Ma rkWes t for s tock a nd ca s h cons i dera ti on Cres twood Equi ty merged wi th i ts underl yi ng MLP i n a n a l l -s tock tra ns a cti on, el i mi na ti ng the IDRs 05/06/15 Cres twood Equi ty Pa rtners LP Cres twood Mi ds trea m Pa rtners LP 4,895 12.6x Energy Tra ns fer merged wi th Regency, under common GP owners hi p, for s tock a nd ca s h cons i dera ti on 01/26/15 Energy Tra ns fer Pa rtners , L.P. Regency Energy Pa rtners LP 17,595 13.7x 01/21/15 Ki nder Morga n Inc. Hi l a nd Pa rtners LP 3,000 10.0x Ki nder Morga n a cqui red Hi l a nd Pa rtners i n a n a l l ca s h tra ns a cti on Acces s Mi ds trea m merged wi th Wi l l i a ms Pa rtners , under common GP owners hi p, for s tock a nd ca s h cons i dera ti on 04/28/14 Acces s Mi ds trea m Pa rtners LP Wi l l i a ms Pa rtners LP 36,793 13.5x Source: Company and partnership filings, investor presentations, press releases and transcripts, S&P Capital IQ and Wall Stre et research. (1)Excludes lowest and highest metrics to remove the impact of potential outlier effects from the analysis. Page 42 Project Bronco | Low (1) 10.0x Median 12.1x High (1) 13.7x Trans. Announced Transaction Value / Date Buyer(s) Seller(s) Value ($MM) Fwd. EBITDA Transaction Summary
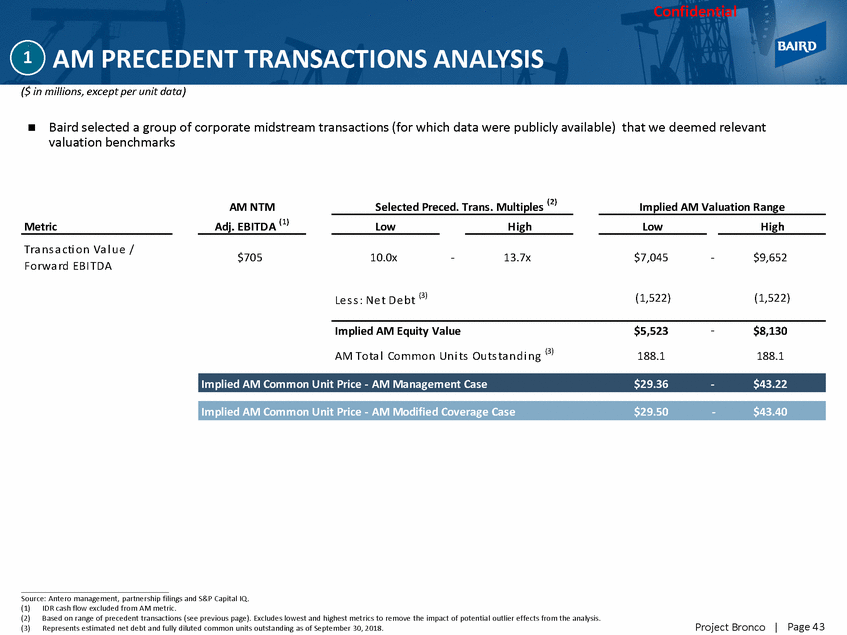
Confidential AM PRECEDENT TRANSACTIONS ANALYSIS 1 ($ in millions, except per unit data) Baird selected a group of corporate midstream transactions (for which data were publicly available) that we deemed relevant valuation benchmarks Selected Preced. Trans. Multiples ( 2) AM NTM Adj. EBITDA ( 1) Implied AM Valuation Range Metric Low High Low High Tra ns a cti on Va l ue / Forwa rd EBI TDA $705 10.0x - 13.7x $7,045 - $9,652 Le s s : Ne t De bt (3) (1,522) (1,522) - Implied AM Equity Value AM Tota l Common Uni ts Outs ta ndi ng (3) $5,523 188.1 $8,130 188.1 Source: Antero management, partnership filings and S&P Capital IQ. (1) (2) (3) IDR cash flow excluded from AM metric. Based on range of precedent transactions (see previous page). Excludes lowest and highest metrics to remove the impact of potential outlier effects from the analysis. Represents estimated net debt and fully diluted common units outstanding as of September 30, 2018. Page 43 Project Bronco | Implied AM Common Unit Price - AM Modified Coverage Case $29.50 - $43.40 Implied AM Common Unit Price - AM Management Case $29.36 - $43.22
Confidential AMGP VALUATION ANALYSIS 2 Project Bronco |
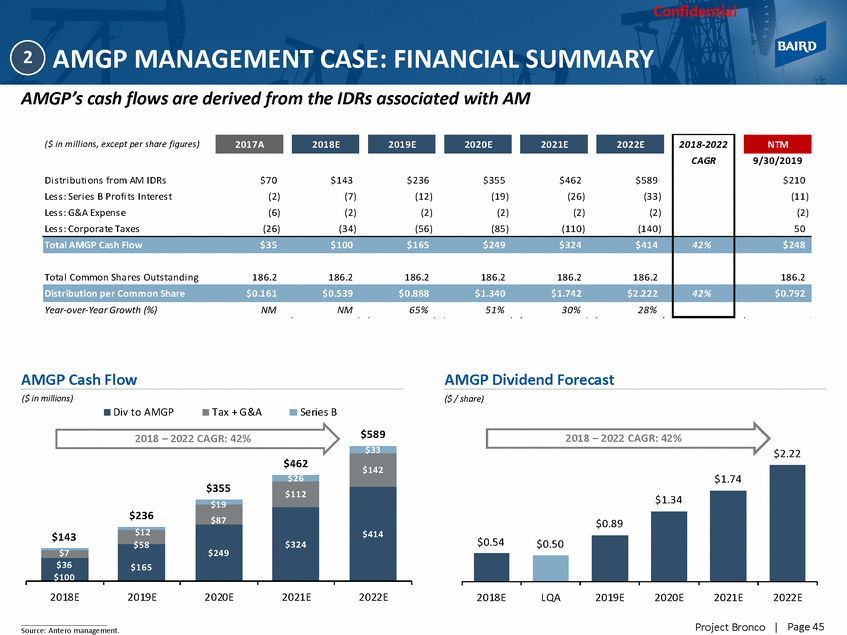
Confidential AMGP MANAGEMENT CASE: FINANCIAL SUMMARY 2 AMGP’s cash flows are derived from the IDRs associated with AM AMGP Cash Flow AMGP Dividend Forecast ($ in millions) ($ / share) Div to AMGP Tax + G &A Series B $589 2018 – 2022 CAGR: 42% 2018 – 2022 CAGR: 42% $2.22 2018E 2019E 2020E 2021E 2022E 2018E LQA 2019E 2020E 2021E 2022E Page 45 Project Bronco | Source: Antero management. $1.74 $1.34 $0.89 $0.54 $0.50 $462 $142 $355 $112 $414 $236 $87 $324 $249 $143 $12 $165 $7 $36 $100 ($ in millions, except per share figures) Di s tri buti ons from AM IDRs $70 $143 $236 $355 $462 $589 Les s : Seri es B Profi ts Interes t (2) (7) (12) (19) (26) (33) Les s : G&A Expens e (6) (2) (2) (2) (2) (2) Les s : Corporate Taxes (26) (34) (56) (85) (110) (140) 2018-2022 CAGR 9/30/2019 $210 (11) (2) 50 Total AMGP Cash Flow$35$100$165$249$324$414 42% $248 Total Common Shares Outs tandi ng186.2186.2186.2186.2186.2186.2 186.2 Distribution per Common Share$0.161$0.539$0.888$1.340$1.742$2.222 42% $0.792 Year-over-Year Growth (%)NMNM65%51%30%28% NTM 2022E 2021E 2020E 2019E 2018E 2017A
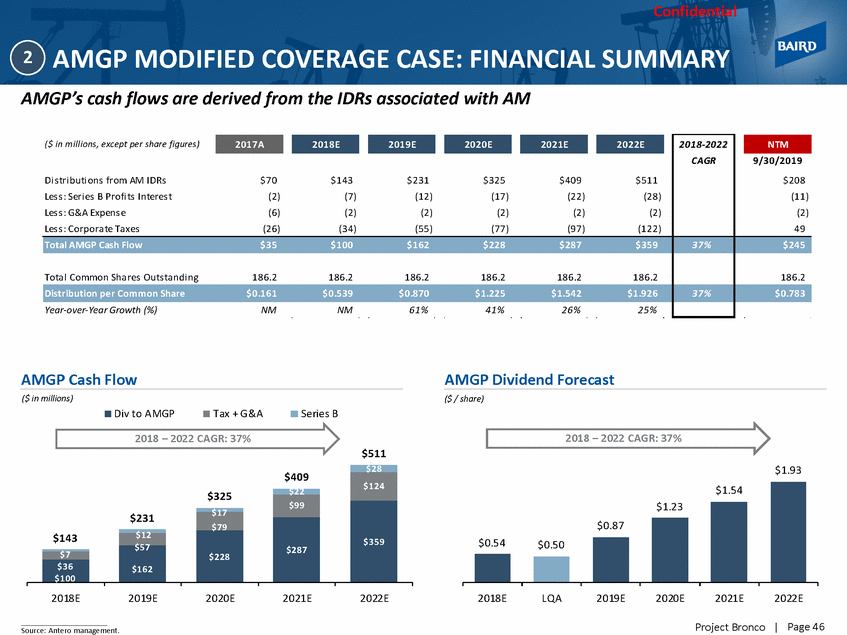
Confidential AMGP MODIFIED COVERAGE CASE: FINANCIAL SUMMARY 2 AMGP’s cash flows are derived from the IDRs associated with AM AMGP Cash Flow AMGP Dividend Forecast ($ in millions) ($ / share) Div to AMGP Tax + G &A Series B 2018 – 2022 CAGR: 37% 2018 – 2022 CAGR: 37% $511 $1.93 $100 2018E LQA 2019E 2020E 2021E 2022E 2018E 2019E 2020E 2021E 2022E Page 46 Project Bronco | Source: Antero management. $1.54 $1.23 $0.87 $0.54 $0.50 $409 $124 $325 $99 $359 $231 $287 $143 $228 $162 $7 $36 ($ in millions, except per share figures) Di s tri buti ons from AM IDRs $70 $143 $231 $325 $409 $511 Les s : Seri es B Profi ts Interes t (2) (7) (12) (17) (22) (28) Les s : G&A Expens e (6) (2) (2) (2) (2) (2) Les s : Corporate Taxes (26) (34) (55) (77) (97) (122) 2018-2022 CAGR 9/30/2019 $208 (11) (2) 49 Total AMGP Cash Flow$35$100$162$228$287$359 37% $245 Total Common Shares Outs tandi ng186.2186.2186.2186.2186.2186.2 186.2 Distribution per Common Share$0.161$0.539$0.870$1.225$1.542$1.926 37% $0.783 Year-over-Year Growth (%)NMNM61%41%26%25% NTM 2022E 2021E 2020E 2019E 2018E 2017A
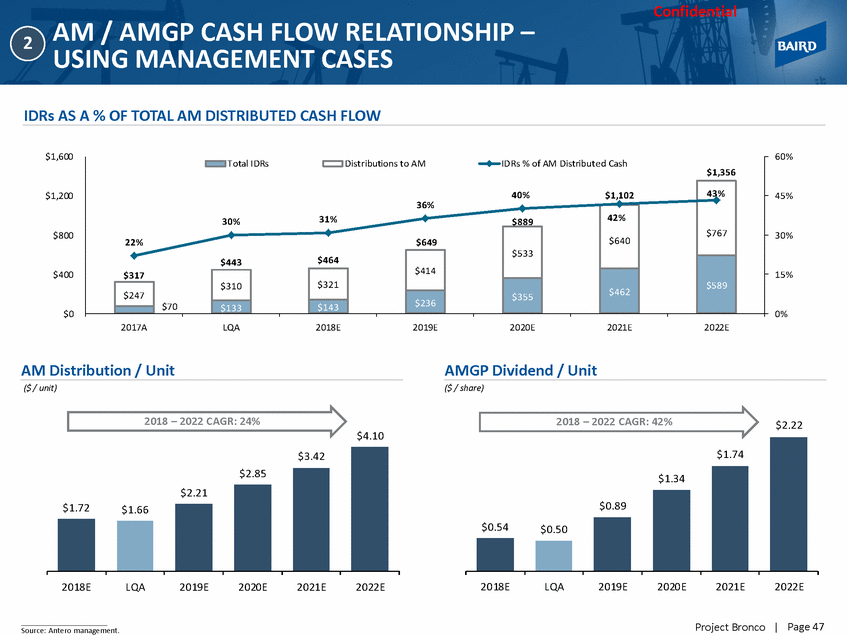
Confidential AM / AMGP CASH FLOW RELATIONSHIP – USING MANAGEMENT CASES 2 IDRs AS A % OF TOTAL AM DISTRIBUTED CASH FLOW $1,600 60% $1,356 $1,200 45% 36% $800 30% $400 15% $0 0% 2017A LQA 2018E 2019E 2020E 2021E 2022E AM Distribution / Unit AMGP Dividend / Unit ($ / unit) ($ / share) 2018 – 2022 CAGR: 24% 2018 – 2022 CAGR: 42% $2.22 $4.10 2018E LQA 2019E 2020E 2021E 2022E 2018E LQA 2019E 2020E 2021E 2022E Page 47 Project Bronco | Source: Antero management. $3.42 $2.85 $2.21 $1.72 $1.66 $1.74 $1.34 $0.89 $0.54 $0.50 Total IDRsDistributions to AMID Rs % of AM Distributed Cash 40%$1,102 43% $767 30%31%$889 42% $640 22%$649 $533 $443$464 $414 $589 $462 $317 $310 $321 $355 $247 $70 $236 $133 $143
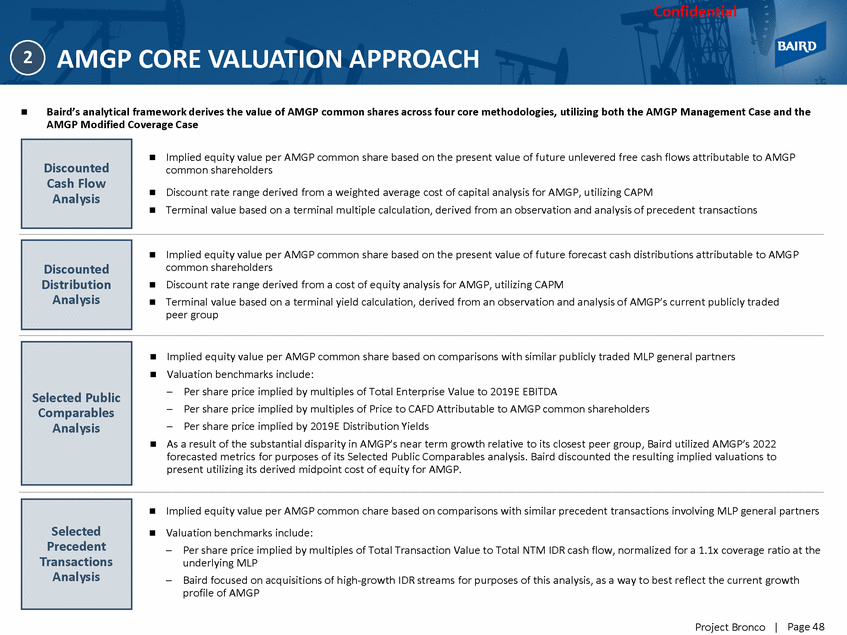
Confidential AMGP CORE VALUATION APPROACH 2 Baird’s analytical framework derives the value of AMGP common shares across four core methodologies, utilizing both the AMGP Management Case and the AMGP Modified Coverage Case Implied equity value per AMGP common share based on the present value of future unlevered free cash flows attributable to AMGP common shareholders Discount rate range derived from a weighted average cost of capital analysis for AMGP, utilizing CAPM Terminal value based on a terminal multiple calculation, derived from an observation and analysis of precedent transactions Implied equity value per AMGP common share based on the present value of future forecast cash distributions attributable to AMGP common shareholders Discount rate range derived from a cost of equity analysis for AMGP, utilizing CAPM Terminal value based on a terminal yield calculation, derived from an observation and analysis of AMGP’s current publicly traded peer group Implied equity value per AMGP common share based on comparisons with similar publicly traded MLP general partners Valuation benchmarks include: – – – Per share price implied by multiples of Total Enterprise Value to 2019E EBITDA Per share price implied by multiples of Price to CAFD Attributable to AMGP common shareholders Per share price implied by 2019E Distribution Yields As a result of the substantial disparity in AMGP’s near term growth relative to its closest peer group, Baird utilized AMGP’s 2022 forecasted metrics for purposes of its Selected Public Comparables analysis. Baird discounted the resulting implied valuations to present utilizing its derived midpoint cost of equity for AMGP. Implied equity value per AMGP common chare based on comparisons with similar precedent transactions involving MLP general partners Valuation benchmarks include: – Per share price implied by multiples of Total Transaction Value to Total NTM IDR cash flow, normalized for a 1.1x coverage ratio at the underlying MLP – Baird focused on acquisitions of high-growth IDR streams for purposes of this analysis, as a way to best reflect the current growth profile of AMGP Page 48 Project Bronco | Selected Precedent Transactions Analysis Selected Public Comparables Analysis Discounted Distribution Analysis Discounted Cash Flow Analysis
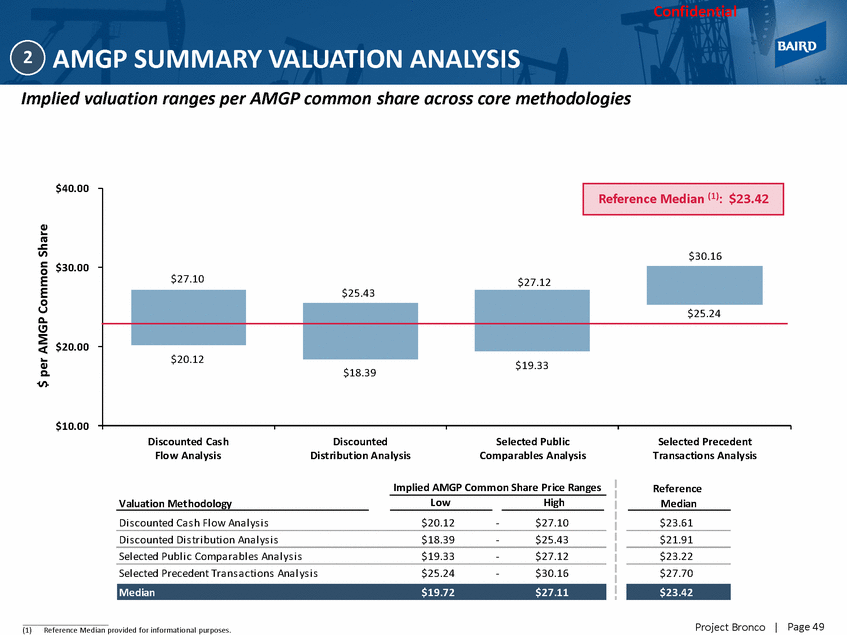
Confidential AMGP SUMMARY VALUATION ANALYSIS 2 Implied valuation ranges per AMGP common share across core methodologies $40.00 $30.00 $20.00 $20.12 $10.00 Di scounted Cas h Flo w Anal ysi s Di scounted Di stri bution Analy sis Selected Publ ic Comparabl es Anal ysi s Selected Precedent Transactio ns Analy sis Implied AMGP Common Share Price Ranges Reference Median Low High Valuation Methodology Di s counted Ca s h Fl ow Anal ys i s $20.12 - $27.10 $23.61 Di s counted Di s tri buti on Anal ys i s $18.39 - $25.43 $21.91 Sel ected Publ i c Comparabl es Anal ys i s $19.33 - $27.12 $23.22 Sel ected Precedent Trans acti ons Anal ys i s $25.24 - $30.16 $27.70 Page 49 Project Bronco | (1)Reference Median provided for informational purposes. $ per AMGP Common Share $23.42 Median $19.72 $27.11 $30.16 $27.10 $27.12 $25.43 $25.24 $18.39 $19.33 Reference Median (1): $23.42
Confidential Detailed AMGP Valuation Analysis Discounted Cash Flow Analysis 2 Project Bronco |
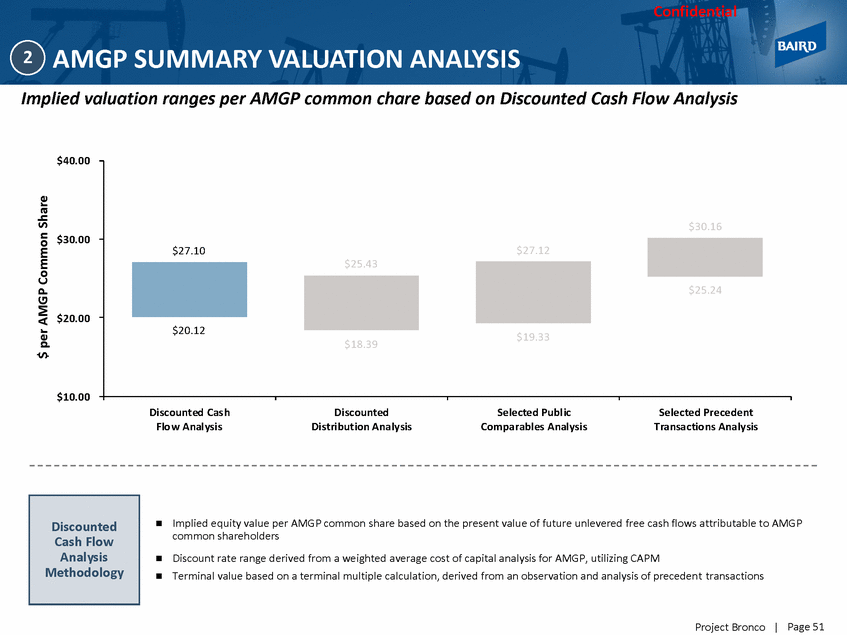
Confidential AMGP SUMMARY VALUATION ANALYSIS 2 Implied valuation ranges per AMGP common chare based on Discounted Cash Flow Analysis $40.00 $30.00 $20.00 $19.33 $18.39 $10.00 Di scounted Cas h Flo w Anal ysi s Di scounted Di stri bution Analy sis Selected Publ ic Comparabl es Anal ysi s Selected Precedent Transactio ns Analy sis Implied equity value per AMGP common share based on the present value of future unlevered free cash flows attributable to AMGP common shareholders Discount rate range derived from a weighted average cost of capital analysis for AMGP, utilizing CAPM Terminal value based on a terminal multiple calculation, derived from an observation and analysis of precedent transactions Page 51 Project Bronco | $ per AMGP Common Share Discounted Cash Flow Analysis Methodology $30.16 $27.10 $27.12 $25.43 $25.24 $20.12
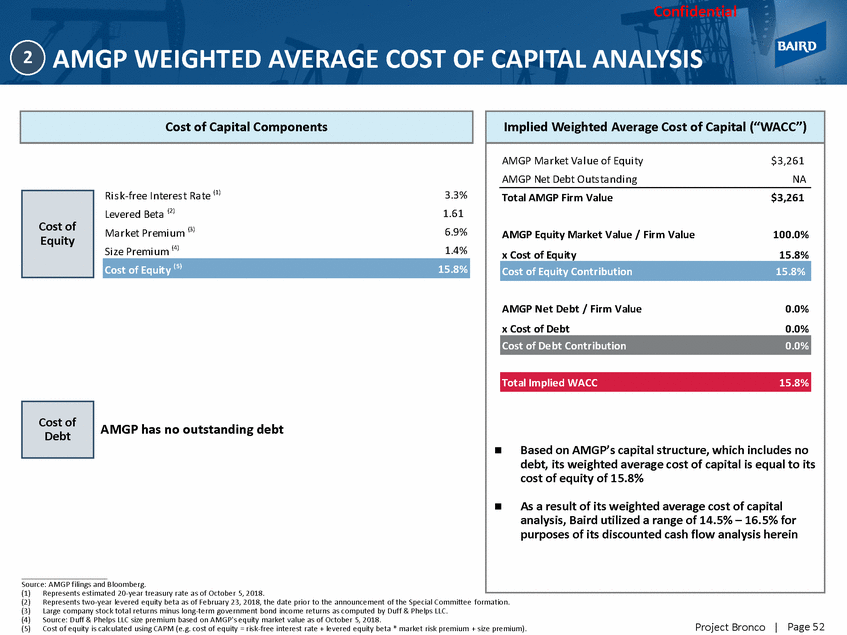
Confidential AMGP WEIGHTED AVERAGE COST OF CAPITAL ANALYSIS 2 Ri s k-free Interes t Rate (1) Levered Beta (2) Market Premi um (3) Si ze Premi um (4) 3.3% 1.61 6.9% 1.4% AMGP has no outstanding debt Source: AMGP filings and Bloomberg. (1) (2) (3) (4) (5) Represents estimated 20-year treasury rate as of October 5, 2018. Represents two-year levered equity beta as of February 23, 2018, the date prior to the announcement of the Special Committee formation. Large company stock total returns minus long-term government bond income returns as computed by Duff & Phelps LLC. Source: Duff & Phelps LLC size premium based on AMGP's equity market value as of October 5, 2018. Cost of equity is calculated using CAPM (e.g. cost of equity = risk-free interest rate + levered equity beta * market risk premium + size premium). Page 52 Project Bronco | Cost of Debt Cost of Equity ( 5)15.8% Cost of Equity Cost of Capital Components Implied Weighted Average Cost of Capital (“WACC”) AMGP Ma rket Va l ue of Equi ty $3,261 AMGP Net Debt Outs ta ndi ng NA Total AMGP Firm Value $3,261 AMGP Equity Market Value / Firm Value 100.0% x Cost of Equity 15.8% AMGP Net Debt / Firm Value 0.0% x Cost of Debt 0.0% Based on AMGP’s capital structure, which includes no debt, its weighted average cost of capital is equal to its cost of equity of 15.8% As a result of its weighted average cost of capital analysis, Baird utilized a range of 14.5% – 16.5% for purposes of its discounted cash flow analysis herein Total Implied WACC 15.8% Cost of Debt Contribution 0.0% Cost of Equity Contribution 15.8%
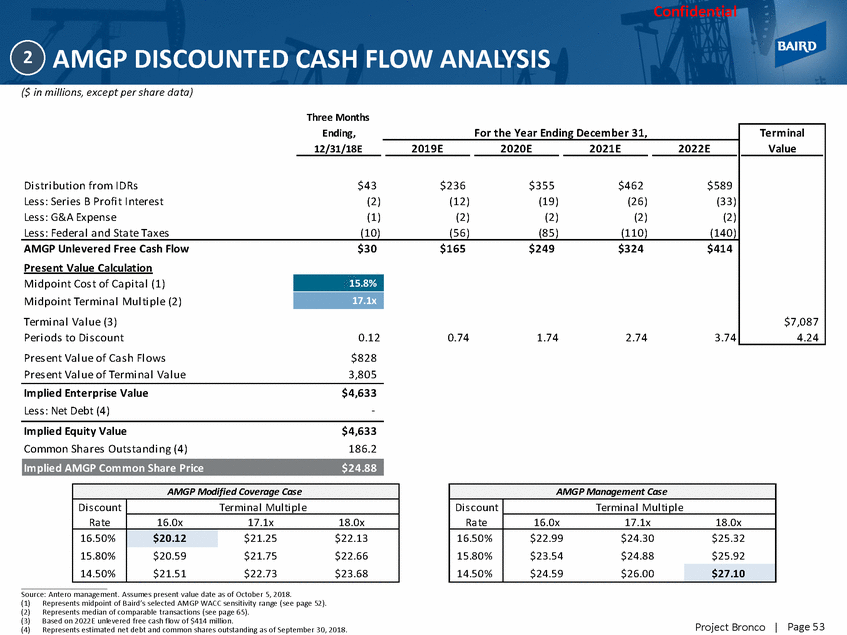
Confidential AMGP DISCOUNTED CASH FLOW ANALYSIS 2 ($ in millions, except per share data) Three Months Ending, 12/31/18E Di s tri buti on from IDRs Les s : Seri es B Profi t Interes t Les s : G&A Expens e Les s : Federa l a nd Sta te Ta xes $43 (2) (1) (10) Pres ent Va l ue of Ca s h Fl ows Pres ent Va l ue of Termi na l Va l ue $828 3,805 Implied Enterprise Value Les s : Net Debt (4) $4,633 - Implied Equity Value Common Sha res Outs ta ndi ng (4) $4,633 186.2 Implied AMGP Common Share Price $24.88 Source: Antero management. Assumes present value date as of October 5, 2018. (1)Represents midpoint of Baird’s selected AMGP WACC sensitivity range (see page 52). (2)Represents median of comparable transactions (see page 65). (3)Based on 2022E unlevered free cash flow of $414 million. (4)Represents estimated net debt and common shares outstanding as of September 30, 2018. Page 53 Project Bronco | AMGP Modified Coverage Case Di s count Ra te Termi na l Mul ti pl e 16.0x 17.1x 18.0x 16.50% 15.80% 14.50% $20.12 $21.25 $22.13 $20.59 $21.75 $22.66 $21.51 $22.73 $23.68 AMGP Management Case Di s count Ra te Termi na l Mul ti pl e 16.0x 17.1x 18.0x 16.50% 15.80% 14.50% $22.99 $24.30 $25.32 $23.54 $24.88 $25.92 $24.59 $26.00 $27.10 For the Year Ending December 31, Terminal Value $7,087 4.24 2019E 2020E 2021E 2022E $236 $355 $462 $589 (12) (19) (26) (33) (2) (2) (2) (2) (56) (85) (110) (140) AMGP Unlevered Free Cash Flow $30 $165 $249 $324 $414 Present Value Calculation Mi dpoi nt Cos t of Ca pi ta l (1) 15.8% Mi dpoi nt Termi na l Mul ti pl e (2) Termi na l Va l ue (3) Peri ods to Di s count 0.12 0.74 1.74 2.74 3.74 17.1x
Confidential Detailed AMGP Valuation Analysis Discounted Distribution Analysis 2 Project Bronco |
Confidential AMGP SUMMARY VALUATION ANALYSIS 2 Implied valuation ranges per AMGP common share based on Discounted Distribution Analysis $40.00 $30.00 $20.00 $19.33 $18.39 $10.00 Di scounted Cas h Flo w Anal ysi s Di scounted Di stri bution Analy sis Selected Publ ic Comparabl es Anal ysi s Selected Precedent Transactio ns Analy sis Implied equity value per AMGP common share based on the present value of future forecast cash distributions attributable to AMGP common shareholders Discount rate range derived from a cost of equity analysis for AMGP, utilizing CAPM Terminal value based on a terminal yield calculation, derived from an observation and analysis of AMGP’s current publicly traded peer group Page 55 Project Bronco | $ per AMGP Common Share Discounted Distribution Analysis Methodology $30.16 $27.10 $27.12 $25.43 $25.24 $20.12
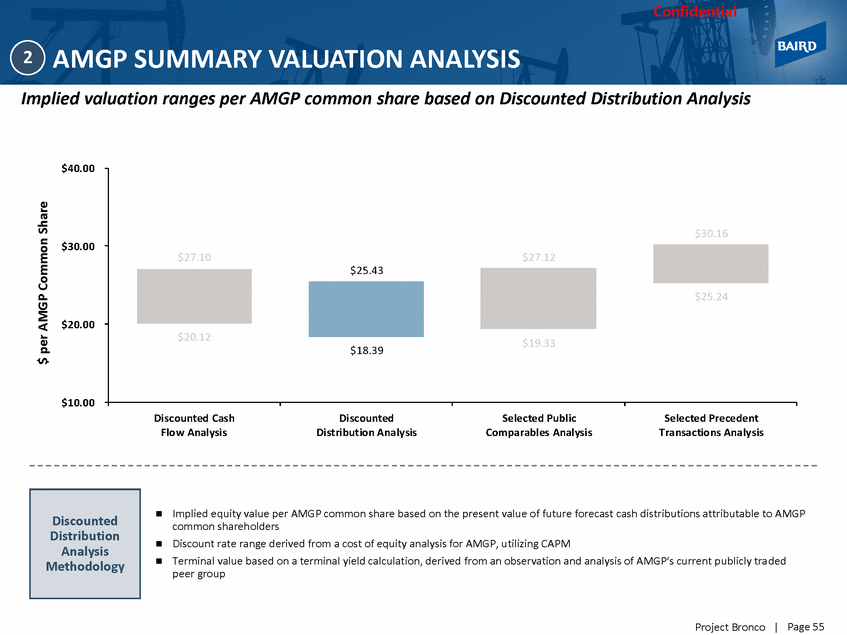
Confidential AMGP COST OF EQUITY ANALYSIS 2 Ri s k-free Interes t Rate (1) 3.3% 1.61 6.9% 1.4% (2) Levered Beta Market Premi um (3) Si ze Premi um (4) Source: AMGP filings and Bloomberg. (1) (2) (3) (4) (5) Represents estimated 20-year treasury rate as of October 5, 2018. Represents two-year levered equity beta as of February 23, 2018, the date prior to the announcement of the Special Committee formation. Large company stock total returns minus long-term government bond income returns as computed by Duff & Phelps LLC. Source: Duff & Phelps LLC size premium based on AMGPs equity market value as of October 5, 2018. Cost of equity is calculated using CAPM (e.g. cost of equity = risk-free interest rate + levered equity beta * market risk premium + size premium). Page 56 Project Bronco | Cost of Equity ( 5)15.8% Cost of Equity As a result of its cost of equity analysis, Baird utilizes a range of 14.5% – 16.5% for purposes of its dividend discount analysis herein CAPM
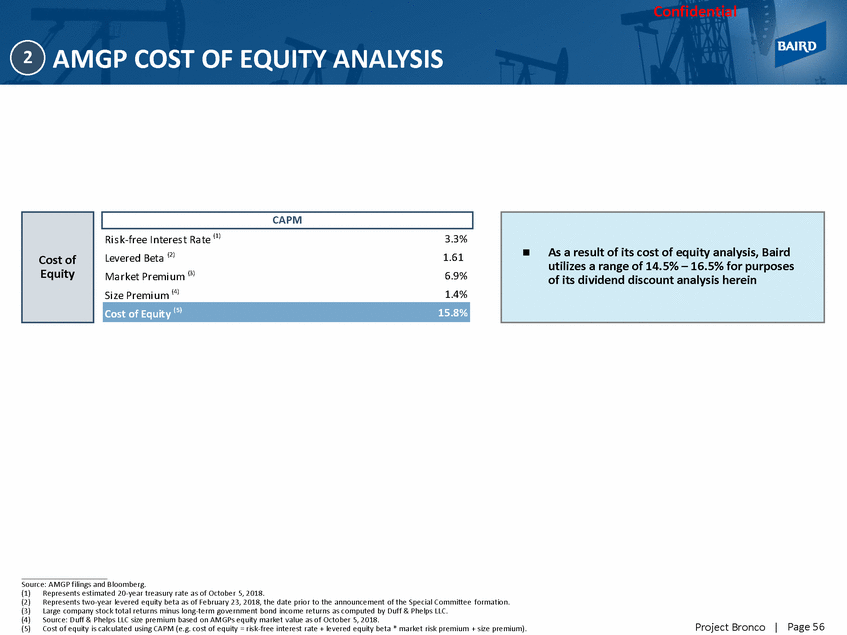
Confidential AMGP DISCOUNTED DISTRIBUTION ANALYSIS 2 ($ in millions, except per share data) Three Months Ending, Distribution Estimates 12/31/18E 2019E 2020E 2021E 2022E $0.164 $0.888 $1.340 $1.742 $2.222 Di s tri b u ti on Pe r AMGP Common Sh a re Present Value Calculation Cos t of Eq u i ty (1) Te rmi n a l Yi e l d (2) Te rmi n a l Va l u e (3) Pe ri od s to Di s cou n t 0.12 0.74 1.74 2.74 3.74 4.24 Di s cou n te d Di s tri b u ti on s Di s cou n te d Te rmi n a l Va l u e $4.45 18.36 Source: Antero management. Assumes present value date as of October 5, 2018. (1) (2) (3) Discount rate based on estimated cost of equity for AMGP (see previous page). Based on analysis of public comparables (see page 61). Based on 2022E distribution of $2.222. Page 57 Project Bronco | AMGP Modified Coverage Case Cos t of Equi ty Termi na l Yi el d 7.0% 6.5% 6.0% 16.50% 15.80% 14.50% $18.39 $19.50 $20.79 $18.81 $19.95 $21.28 $19.65 $20.84 $22.23 AMGP Management Case Cos t of Equi ty Termi na l Yi el d 7.0% 6.5% 6.0% 16.50% 15.80% 14.50% $21.00 $22.28 $23.77 $21.49 $22.80 $24.33 $22.45 $23.82 $25.43 Implied AMGP Common Share Price $22.80 6.5% 15.8% Terminal Value $34
Confidential Detailed Selected AMGP Valuation Analysis Public Trading Comparables 2 Project Bronco |
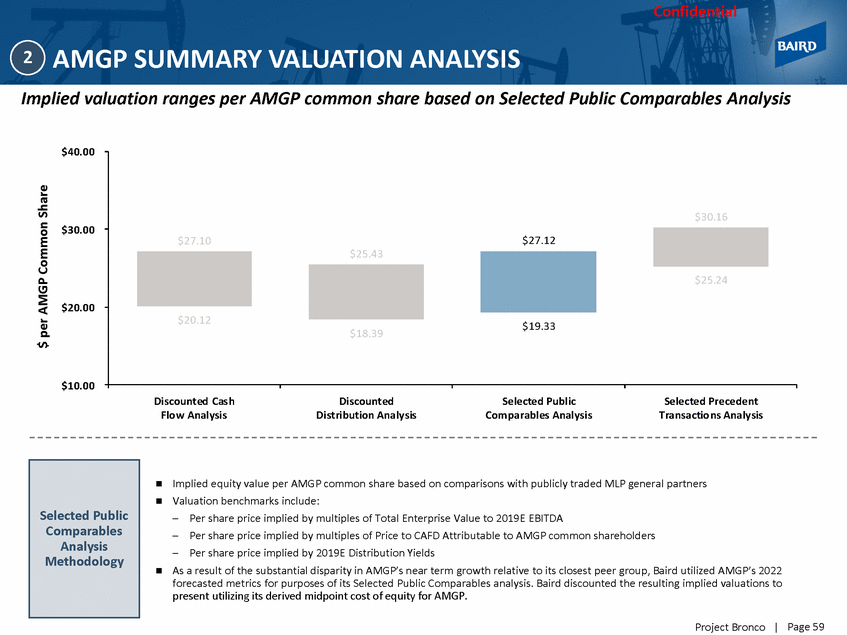
Confidential AMGP SUMMARY VALUATION ANALYSIS 2 Implied valuation ranges per AMGP common share based on Selected Public Comparables Analysis $40.00 $30.00 $20.00 $19.33 $18.39 $10.00 Di scounted Cas h Flo w Anal ysi s Di scounted Di stri bution Analy sis Selected Publ ic Comparabl es Anal ysi s Selected Precedent Transactio ns Analy sis Implied equity value per AMGP common share based on comparisons with publicly traded MLP general partners Valuation benchmarks include: – – – Per share price implied by multiples of Total Enterprise Value to 2019E EBITDA Per share price implied by multiples of Price to CAFD Attributable to AMGP common shareholders Per share price implied by 2019E Distribution Yields As a result of the substantial disparity in AMGP’s near term growth relative to its closest peer group, Baird utilized AMGP’s 2022 forecasted metrics for purposes of its Selected Public Comparables analysis. Baird discounted the resulting implied valuations to present utilizing its derived midpoint cost of equity for AMGP. Page 59 Project Bronco | $ per AMGP Common Share Selected Public Comparables Analysis Methodology $30.16 $27.10 $27.12 $25.43 $25.24 $20.12
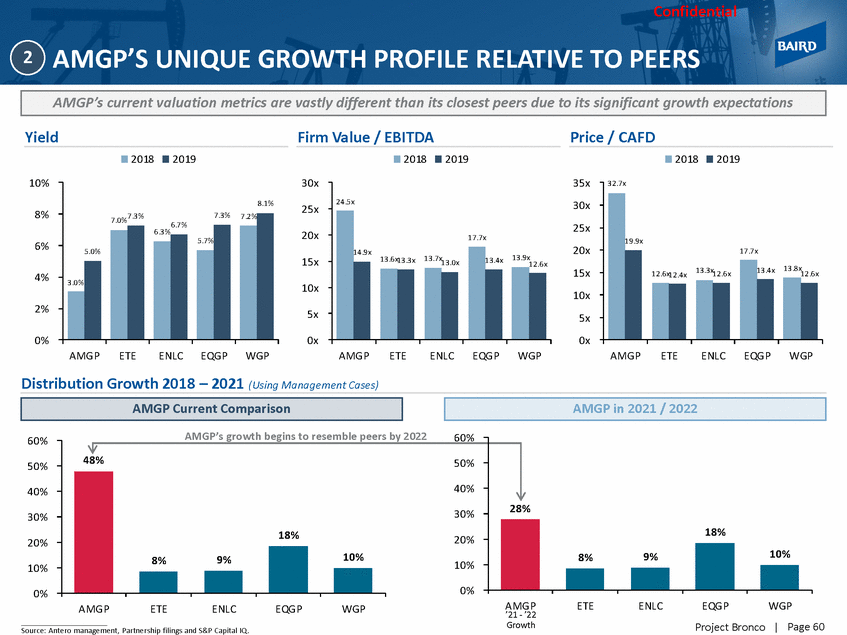
Confidential AMGP’S UNIQUE GROWTH PROFILE RELATIVE TO PEERS 2 Yield Firm Value / EBITDA Price / CAFD 2018 2019 2018 2019 2018 2019 10% 30x 35x 30x 25x 20x 15x 10x 5x 0x 25x 8% 6.3% 20x 6% 17.7x 13.6x13.3x 13.7x13.0x 15x 12.6x 13.3x12.6x 12.6x 4% 10x 2% 5x 0% 0x AMG P ETE ENLC EQG P WGP AMG P ETE ENLC EQG P WGP AMG P ETE ENLC EQG P WGP Distribution Growth 2018 – 2021 (Using Management Cases) AMGP’s growth begins to resemble peers by 2022 60% 60% 50% 50% 40% 28% 30% 20% 10% 10% 0% AMG P ’21 - ’22 Growth ETE ENLC EQG P WGP AMG P ETE ENLC EQG P WGP Page 60 Project Bronco | Source: Antero management, Partnership filings and S&P Capital IQ. 48% 40% 30% 18%20% 8% 9% 10% 0% 18% 8% 9% 10% AMGP in 2021 / 2022 AMGP Current Comparison 32.7x 19.9x 12.6x12.4x 13.4x 13.8x 24.5x 17.7x 14.9x 13.4x 13.9x 8.1% 7.0%7.3% 7.3% 7.2% 6.7% 5.0% 5.7% 3.0% AMGP’s current valuation metrics are vastly different than its closest peers due to its significant growth expectations
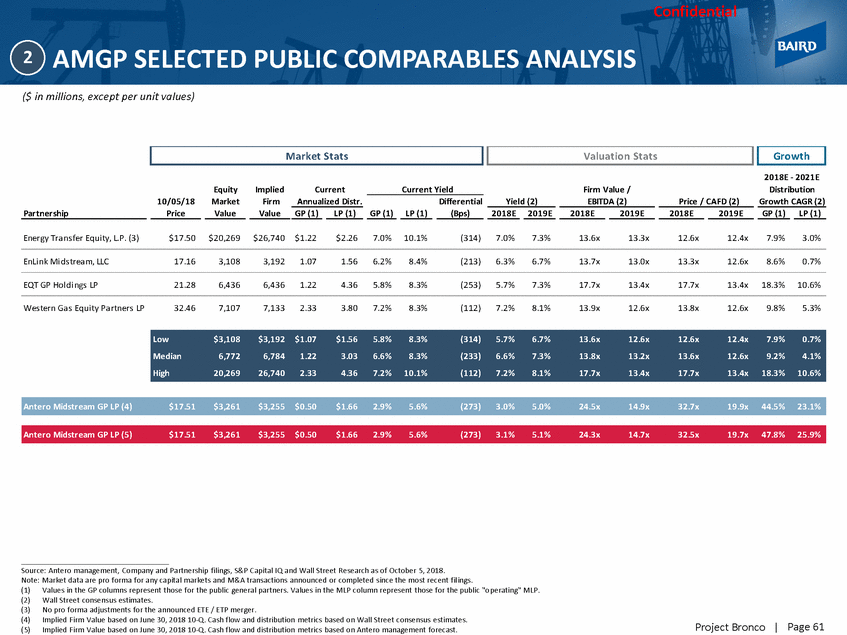
Confidential AMGP SELECTED PUBLIC COMPARABLES ANALYSIS 2 ($ in millions, except per unit values) 2018E - 2021E Distribution Equity Market Implied Current Current Yield Firm Value / 10/05/18 Firm Annualized Distr. Differential Yield (2) EBITDA (2) Price / CAFD (2) Growth CAGR (2) Partnership Price Value Value GP (1) LP (1) GP (1) LP (1) (Bps) 2018E 2019E 2018E 2019E 2018E 2019E GP (1) LP (1) Energy Tra ns fer Equi ty, L.P. (3) $17.50 $20,269 $26,740 $1.22 $2.26 7.0% 10.1% (314) 7.0% 7.3% 13.6x 13.3x 12.6x 12.4x 7.9% 3.0% EnLi nk Mi ds trea m, LLC 17.16 3,108 3,192 1.07 1.56 6.2% 8.4% (213) 6.3% 6.7% 13.7x 13.0x 13.3x 12.6x 8.6% 0.7% EQT GP Hol di ngs LP 21.28 6,436 6,436 1.22 4.36 5.8% 8.3% (253) 5.7% 7.3% 17.7x 13.4x 17.7x 13.4x 18.3% 10.6% Wes tern Ga s Equi ty Pa rtners LP 32.46 7,107 7,133 2.33 3.80 7.2% 8.3% (112) 7.2% 8.1% 13.9x 12.6x 13.8x 12.6x 9.8% 5.3% Source: Antero management, Company and Partnership filings, S&P Capital IQ and Wall Street Research as of October 5, 2018. Note: Market data are pro forma for any capital markets and M&A transactions announced or completed since the most recent fil ings. (1) (2) (3) (4) (5) Values in the GP columns represent those for the public general partners. Values in the MLP column represent those for the public "o perating" MLP. Wall Street consensus estimates. No pro forma adjustments for the announced ETE / ETP merger. Implied Firm Value based on June 30, 2018 10-Q. Cash flow and distribution metrics based on Wall Street consensus estimates. Implied Firm Value based on June 30, 2018 10-Q. Cash flow and distribution metrics based on Antero management forecast. Page 61 Project Bronco | Antero Midstream GP LP (5) $17.51 $3,261 $3,255 $0.50 $1.66 2.9% 5.6% (273) 3.1% 5.1% 24.3x 14.7x 32.5x 19.7x 47.8% 25.9% Antero Midstream GP LP (4) $17.51 $3,261 $3,255 $0.50 $1.66 2.9% 5.6% (273) 3.0% 5.0% 24.5x 14.9x 32.7x 19.9x 44.5% 23.1% Low $3,108 $3,192 $1.07 $1.56 5.8% 8.3% (314) 5.7% 6.7% 13.6x 12.6x 12.6x 12.4x 7.9% 0.7% Median 6,772 6,784 1.22 3.03 6.6% 8.3% (233) 6.6% 7.3% 13.8x 13.2x 13.6x 12.6x 9.2% 4.1% High 20,269 26,740 2.33 4.36 7.2% 10.1% (112) 7.2% 8.1% 17.7x 13.4x 17.7x 13.4x 18.3% 10.6% Market Stats Valuation Stats Growth
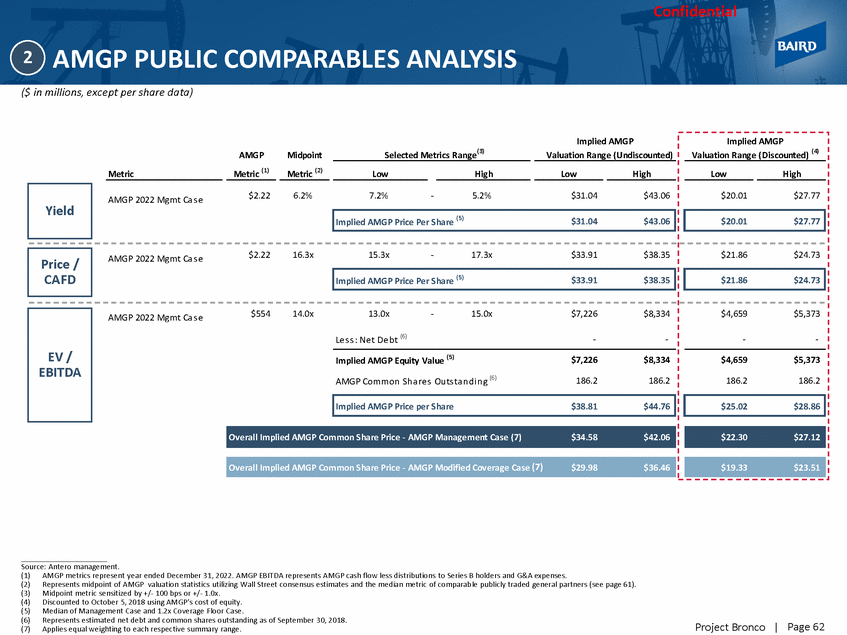
Confidential AMGP PUBLIC COMPARABLES ANALYSIS 2 ($ in millions, except per share data) AMGP 2022 Mgmt Ca s e Source: Antero management. (1) (2) (3) (4) (5) (6) (7) AMGP metrics represent year ended December 31, 2022. AMGP EBITDA represents AMGP cash flow less distributions to Series B holders and G&A expenses. Represents midpoint of AMGP valuation statistics utilizing Wall Street consensus estimates and the median metric of comparable publicly traded general partners (see page 61). Midpoint metric sensitized by +/-100 bps or +/-1.0x. Discounted to October 5, 2018 using AMGP’s cost of equity. Median of Management Case and 1.2x Coverage Floor Case. Represents estimated net debt and common shares outstanding as of September 30, 2018. Applies equal weighting to each respective summary range. Page 62 Project Bronco | Implied AMGP AMGPMidpoint Selected Metrics Range( 3) Valuation Range (Undiscounted) Metric Metric ( 1) Metric ( 2) Low High Low High AMGP 2022 Mgmt Ca s e $2.22 6.2% 7.2% - 5.2% $31.04 $43.06 Implied AMGP Valuation Range (Discounted) ( 4) Low High $20.01 $27.77 Implied AMGP Price Per Share ( 5)$31.04 $43.06 $20.01 $27.77 $2.22 16.3x 15.3x - 17.3x $33.91 $38.35 $21.86 $24.73 Implied AMGP Price Per Share ( 5)$33.91 $38.35 $21.86 $24.73 AMGP 2022 Mgmt Ca s e $554 14.0x 13.0x - 15.0x $7,226 $8,334 Le s s : Ne t De b t (6)-- $4,659 $5,373 - - $4,659 $5,373 186.2 186.2 Implied AMGP Equity Value ( 5)$7,226 $8,334 AMGP Common Sh a re s Ou ts ta n d i n g (6)186.2 186.2 Implied AMGP Price per Share $38.81 $44.76 $25.02 $28.86 Overall Implied AMGP Common Share Price - AMGP Management Case (7) $34.58 $42.06 $22.30 $27.12 Overall Implied AMGP Common Share Price - AMGP Modified Coverage Case (7)$29.98 $36.46 $19.33 $23.51 EV / EBITDA Price / CAFD Yield
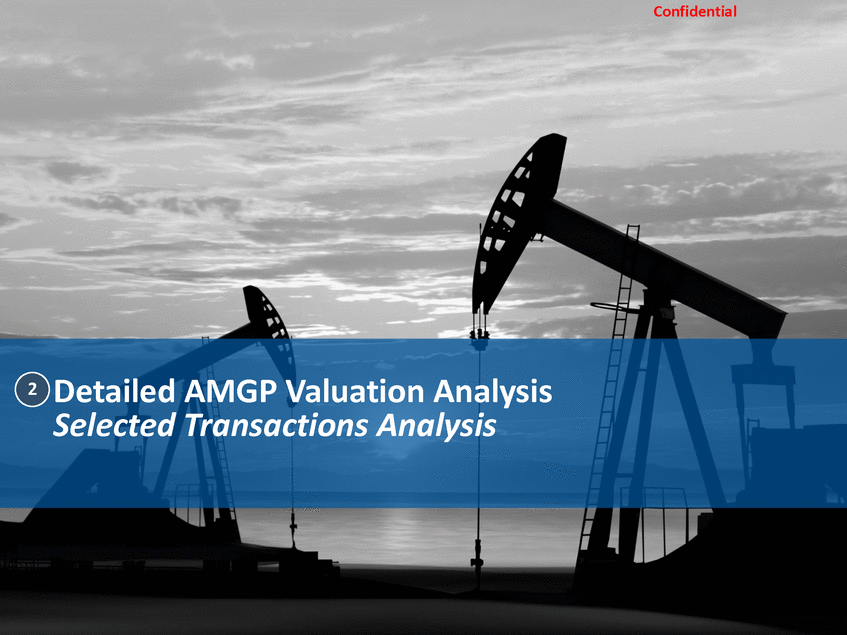
Confidential Detailed Selected AMGP Valuation Analysis Transactions Analysis 2 Project Bronco |
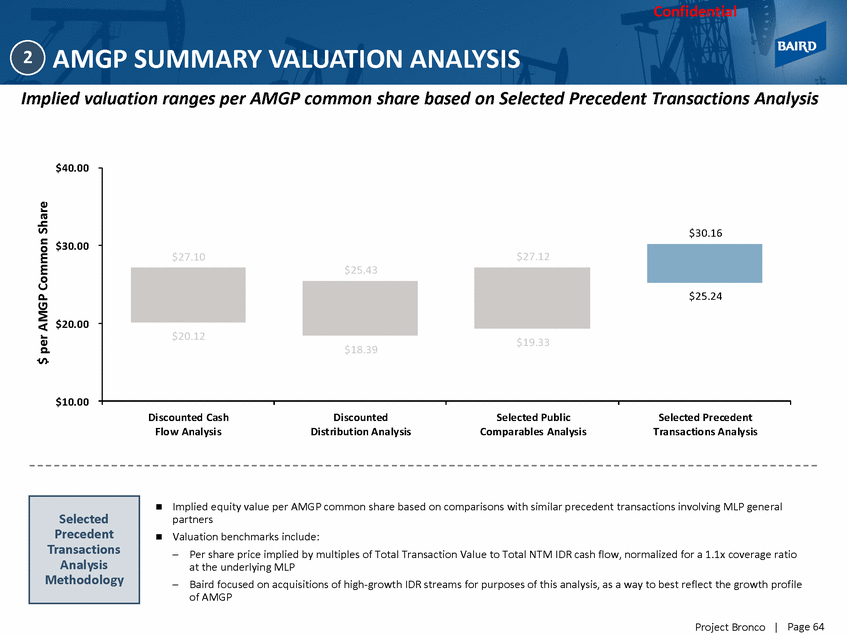
Confidential AMGP SUMMARY VALUATION ANALYSIS 2 Implied valuation ranges per AMGP common share based on Selected Precedent Transactions Analysis $40.00 $30.00 $20.00 $19.33 $18.39 $10.00 Di scounted Cas h Flo w Anal ysi s Di scounted Di stri bution Analy sis Selected Publ ic Comparabl es Anal ysi s Selected Precedent Transactio ns Analy sis Implied equity value per AMGP common share based on comparisons with similar precedent transactions involving MLP general partners Valuation benchmarks include: – Per share price implied by multiples of Total Transaction Value to Total NTM IDR cash flow, normalized for a 1.1x coverage ratio at the underlying MLP – Baird focused on acquisitions of high-growth IDR streams for purposes of this analysis, as a way to best reflect the growth profile of AMGP Page 64 Project Bronco | $ per AMGP Common Share Selected Precedent Transactions Analysis Methodology $30.16 $27.10 $27.12 $25.43 $25.24 $20.12
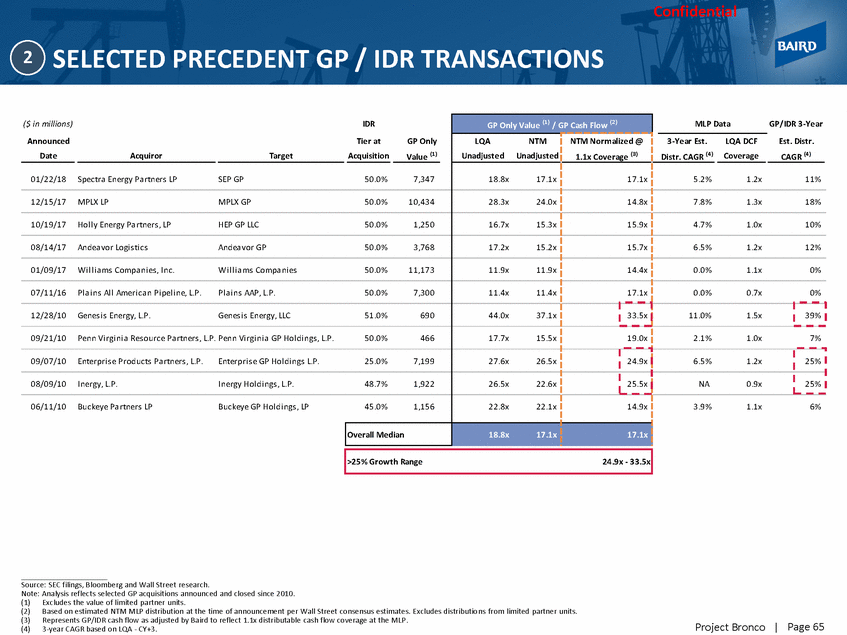
Confidential SELECTED PRECEDENT GP / IDR TRANSACTIONS 2 Source: SEC filings, Bloomberg and Wall Street research. Note: Analysis reflects selected GP acquisitions announced and closed since 2010. (1) (2) (3) (4) Excludes the value of limited partner units. Based on estimated NTM MLP distribution at the time of announcement per Wall Street consensus estimates. Excludes distributio ns from limited partner units. Represents GP/IDR cash flow as adjusted by Baird to reflect 1.1x distributable cash flow coverage at the MLP. 3-year CAGR based on LQA - CY+3. Page 65 Project Bronco | ($ in millions) IDR Announced Tier at GP Only 01/22/18 Spectra Energy Pa rtners LP SEP GP 50.0% 7,347 GP Only Value (1) / GP Cash Flow (2) MLP Data GP/IDR 3-Year 3-Year Est. LQA DCF Est. Distr. LQA NTM Unadjusted Unadjusted NTM Normalized @ 1.1x Coverage (3) Distr. CAGR (4) Coverage CAGR (4) 18.8x 17.1x 17.1x 5.2% 1.2x 11% 12/15/17 MPLX LP MPLX GP 50.0% 10,434 28.3x 24.0x 14.8x 7.8% 1.3x 18% 10/19/17 Hol l y Energy Pa rtners , LP HEP GP LLC 50.0% 1,250 16.7x 15.3x 15.9x 4.7% 1.0x 10% 08/14/17 Andea vor Logi s ti cs Andea vor GP 50.0% 3,768 17.2x 15.2x 15.7x 6.5% 1.2x 12% 01/09/17 Wi l l i a ms Compa ni es , Inc. Wi l l i a ms Compa ni es 50.0% 11,173 11.9x 11.9x 14.4x 0.0% 1.1x 0% 07/11/16 Pl a i ns Al l Ameri ca n Pi pel i ne, L.P. Pl a i ns AAP, L.P. 50.0% 7,300 11.4x 11.4x 17.1x 0.0% 0.7x 0% 12/28/10 Genes i s Energy, L.P. Genes i s Energy, LLC 51.0% 690 44.0x 37.1x 33.5x 11.0% 1.5x 39% 09/21/10 Penn Vi rgi ni a Res ource Pa rtners , L.P. Penn Vi rgi ni a GP Hol di ngs , L.P. 50.0% 466 17.7x 15.5x 19.0x 2.1% 1.0x 7% 09/07/10 Enterpri s e Products Pa rtners , L.P. Enterpri s e GP Hol di ngs L.P. 25.0% 7,199 27.6x 26.5x 24.9x 6.5% 1.2x 25% 08/09/10 Inergy, L.P. Inergy Hol di ngs , L.P. 48.7% 1,922 26.5x 22.6x 25.5x NA 0.9x 25% 06/11/10 Buckeye Pa rtners LP Buckeye GP Hol di ngs , LP 45.0% 1,156 22.8x 22.1x 14.9x 3.9% 1.1x 6% Overall Median 18.8x 17.1x 17.1x >25% Growth Range 24.9x - 33.5x Date Acquiror Target Acquisition Value (1)
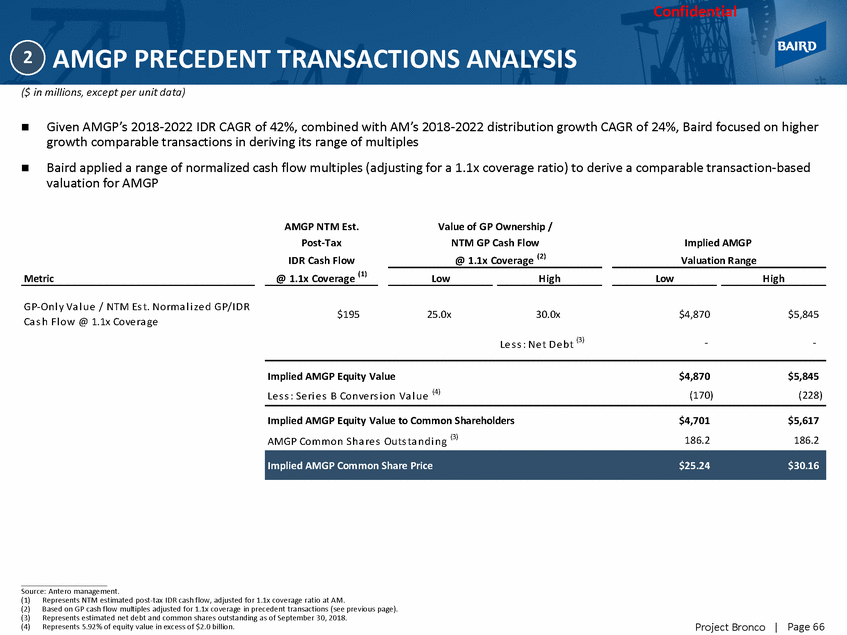
Confidential AMGP PRECEDENT TRANSACTIONS ANALYSIS 2 ($ in millions, except per unit data) Given AMGP’s 2018-2022 IDR CAGR of 42%, combined with AM’s 2018-2022 distribution growth CAGR of 24%, Baird focused on higher growth comparable transactions in deriving its range of multiples Baird applied a range of normalized cash flow multiples (adjusting for a 1.1x coverage ratio) to derive a comparable transaction-based valuation for AMGP AMGP NTM Est. Post-Tax IDR Cash Flow @ 1.1x Coverage ( 1) Value of GP Ownership / NTM GP Cash Flow @ 1.1x Coverage ( 2) Implied AMGP Valuation Range Metric Low High Low High GP-On l y Va l ue / NTM Es t. Norma l i ze d GP/I DR Ca s h Fl ow @ 1.1x Cove ra ge $195 25.0x 30.0x $4,870 $5,845 Le s s : Ne t De bt (3) - - Implied AMGP Equity Value Le s s : Se ri e s B Conve rs i on Va l ue (4) $4,870 (170) $5,845 (228) Implied AMGP Equity Value to Common Shareholders AMGP Common Sha re s Ou ts ta ndi ng (3) $4,701 186.2 $5,617 186.2 Source: Antero management. (1) (2) (3) (4) Represents NTM estimated post-tax IDR cash flow, adjusted for 1.1x coverage ratio at AM. Based on GP cash flow multiples adjusted for 1.1x coverage in precedent transactions (see previous page). Represents estimated net debt and common shares outstanding as of September 30, 2018. Represents 5.92% of equity value in excess of $2.0 billion. Page 66 Project Bronco | Implied AMGP Common Share Price $25.24 $30.16
Confidential MERGER CONSIDERATION ANALYSIS 3 Project Bronco |
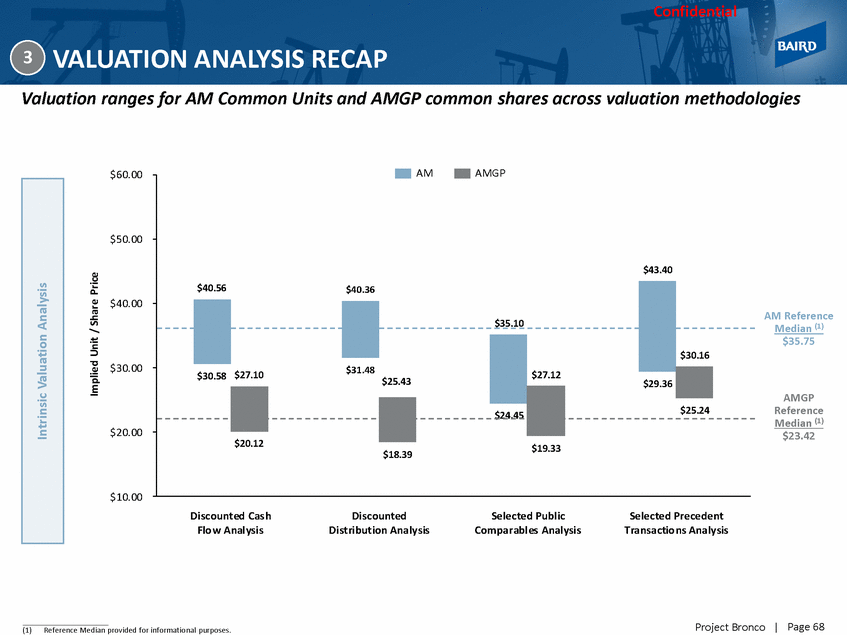
Confidential VALUATION ANALYSIS RECAP 3 Valuation ranges for AM Common Units and AMGP common shares across valuation methodologies AM AMGP $60. 00 $50. 00 $40. 00 AM Reference Median (1) $35.75 $30. 00 $29.36 AMGP Reference Median (1) $20. 00 $23.42 $19.33 $18.39 $10. 00 Di scounted Cas h Flo w Anal ysi s Di scounted Di stri bution Analy sis Selected Publ ic Comparabl es Anal ysi s Selected Precedent Transactio ns Analy sis Page 68 Project Bronco | (1)Reference Median provided for informational purposes. Implied Unit / Share Price Intrinsic Valuation Analysis $43.40 $40.56$40.36 $35.10 $30.16 $30.58 $27.10$31.48 $25.43 $27.12 $25.24 $24.45 $20.12
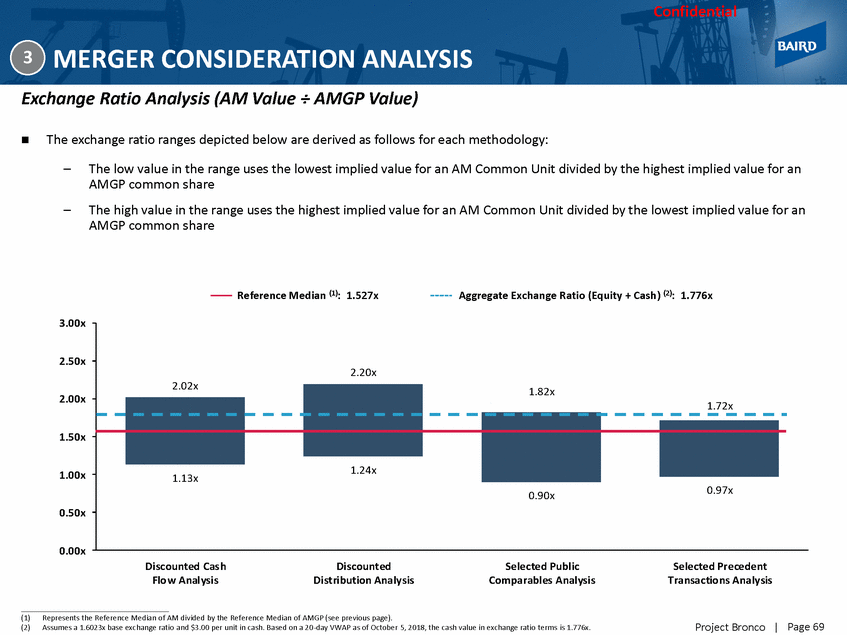
Confidential MERGER CONSIDERATION ANALYSIS 3 Exchange Ratio Analysis (AM Value ÷ AMGP Value) The exchange ratio ranges depicted below are derived as follows for each methodology: – The low value in the range uses the lowest implied value for an AM Common Unit divided by the highest implied value for an AMGP common share The high value in the range uses the highest implied value for an AM Common Unit divided by the lowest implied value for an AMGP common share – Reference Median (1): 1.527x Aggregate Exchange Ratio (Equity + Cash) (2): 1.776x 3.00x 2.50x 2.00x 1.50x 1.00x 0.50x 0.00x Di scounted Cas h Flo w Anal ysi s Di scounted Di stri bution Analy sis Selected Publ ic Comparabl es Anal ysi s Selected Precedent Transactio ns Analy sis (1) (2) Represents the Reference Median of AM divided by the Reference Median of AMGP (see previous page). Assumes a 1.6023x base exchange ratio and $3.00 per unit in cash. Based on a 20-day VWAP as of October 5, 2018, the cash value in exchange ratio terms is 1.776x. Page 69 Project Bronco | 2.20x 2.02x 1.82x 1.72x 1.24x 1.13x 0.90x 0.97x
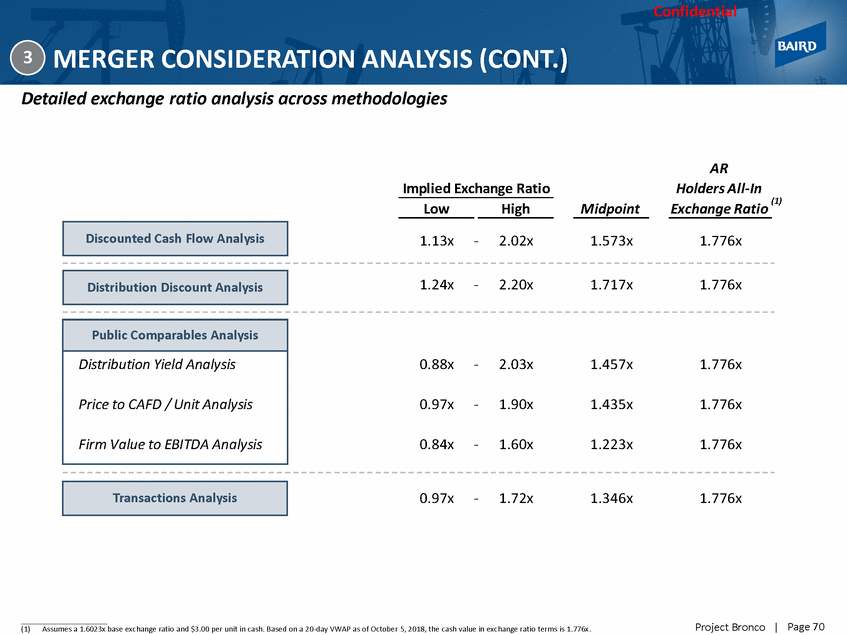
Confidential MERGER CONSIDERATION ANALYSIS (CONT.) 3 Detailed exchange ratio analysis across methodologies AR Holders All-In Implied Exchange Ratio (1) Low High Midpoint Exchange Ratio 1.13x - 2.02x 1.573x 1.776x 1.24x - 2.20x 1.717x 1.776x 0.88x - 2.03x 1.457x 1.776x 0.97x - 1.90x 1.435x 1.776x 0.84x - 1.60x 1.223x 1.776x 0.97x - 1.72x 1.346x 1.776x Page 70 Project Bronco | (1)Assumes a 1.6023x base exchange ratio and $3.00 per unit in cash. Based on a 20-day VWAP as of October 5, 2018, the cash value in exchange ratio terms is 1.776x. TransTarcatniosnasctions Analysis Public Comparables Analysis Distribution Yield Analysis Price to CAFD / Unit Analysis Firm Value to EBITDA Analysis DDisitsrtirbibuutitoionnDDisisccoouunntt Analysis DDisisccoouunntteeddCCaassh Flow Analysis
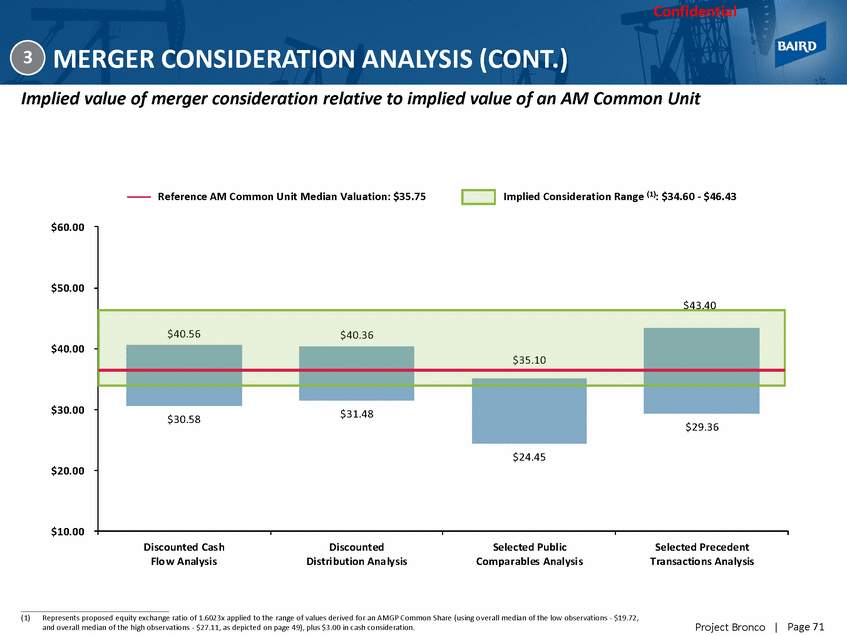
Confidential MERGER CONSIDERATION ANALYSIS (CONT.) 3 Implied value of merger consideration relative to implied value of an AM Common Unit Implied Consideration Range (1): $34.60 - $46.43 Reference AM Common Unit Median Valuation: $35.75 $60.00 $50.00 $40.00 $30.00 $20.00 $10.00 Di scounted Cas h Flo w Anal ysi s Di scounted Di stri bution Analy sis Selected Publ ic Comparabl es Anal ysi s Selected Precedent Transactio ns Analy sis (1)Represents proposed equity exchange ratio of 1.6023x applied to the range of values derived for an AMGP Common Share (using o verall median of the low observations - $19.72, and overall median of the high observations - $27.11, as depicted on page 49), plus $3.00 in cash consideration. Page 71 Project Bronco | $43.40 $40.56 $40.36 $35.10 $30.58 $31.48 $29.36 $24.45
Confidential SUPPLEMENTAL ANALYSIS 4 Project Bronco |
Confidential IMPLIED AM / AMGP EXCHANGE RATIO SINCE AMGP IPO 4 Represents the historical implied exchange ratio of AM / AMGP 1.80x 1.75x 1.70x 1.65x 1.60x 1.55x 1.50x 1.45x 1.40x 1.35x 1.30x 05/03/17 08/15/17 11/27/17 03/11/18 06/23/18 10/05/18 Page 73 Project Bronco | Source: S&P Capital IQ as of October 5, 2018. Implied Exchange Ratio Sailing Stone 13D Filing: 1/29/18 Timeframe Exchange Ratio Current1.698x AMGP IPO -13 D1.570x Since AMGP IPO1.580x Aggregate Exchange Ratio1.776x Special Committee Formation: 2/26/18
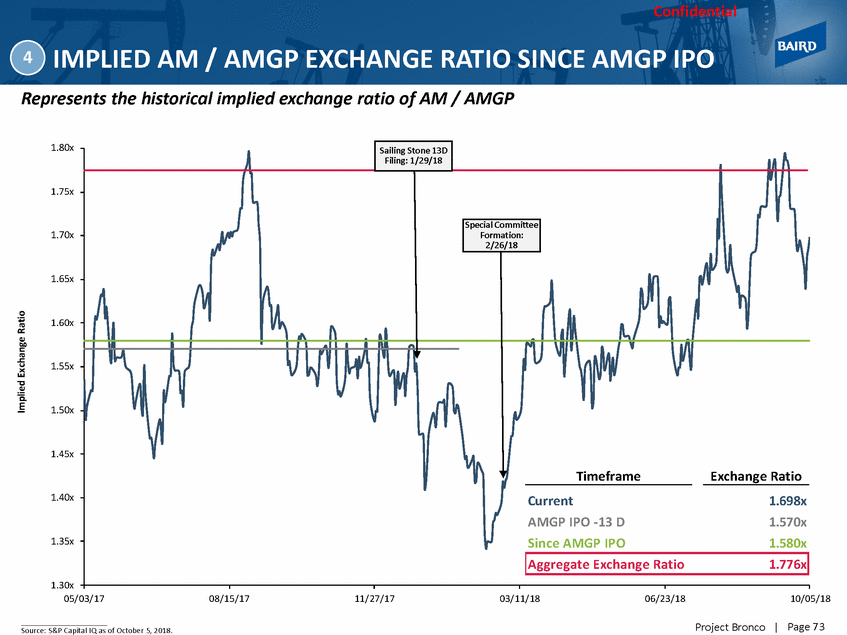
Confidential RELATIVE CONTRIBUTION ANALYSIS – USING MANAGEMENT CASES 4 Relative contribution based on forecasted distributions received in the status quo scenario IMPLIED AM / AMGP EXCHANGE RATIO ($ in millions) 1.602x 1.776x Source: Management projections. (1) (2) (3) Utilizes terminal yield values defined in prior sections of this presentation. Series B terminal value equal to the AMGP terminal value. AMGP includes only Series A cash flow. Represents implied ownership percentages if all merger consideration were in the form of equity in AMGP Corp (i.e. accounts f or cash consideration being issued to AR-held AM Common Units and AM Public Holders. All-in implied exchange ratio, including cash. Based on 20-day VWAP as of October 5, 2018. Page 74 Project Bronco | (4) % Ownership Implied PV-10%PV-15%PV-20% vs. Proposal at Equity ExchangeAll-In (3) Terminal Ownership Entity2019E2020E2021E2022EValue (1) AR-Held AM Common Units$219$282$338$405$4,857 Present Value PV-10%PV-15%PV-20% $4,230$3,575$3,049 31.2%31.2%31.3% 31.2%32.4% AM Public Holders1952523023624,336 3,7763,1922,722 27.8%27.9%28.0% 28.7%30.1% AMGP Common Shares1652493244146,366 5,1554,3323,672 38.0%37.9%37.7% 36.7%34.3% Series B Units12192633509 411345292 3.0%3.0%3.0% 3.4%3.2% Total$591$802$990$1,214$16,069$13,572 $11,443$9,735 100.0%100.0%100.0% 100.0%100.0% Implied Exchange Ratio (2) - AR2.490x2.128x1.963x1.845x1.437x1.545x1.555x1.564x 1.545x1.555x1.564x (4) Distribution Forecasts
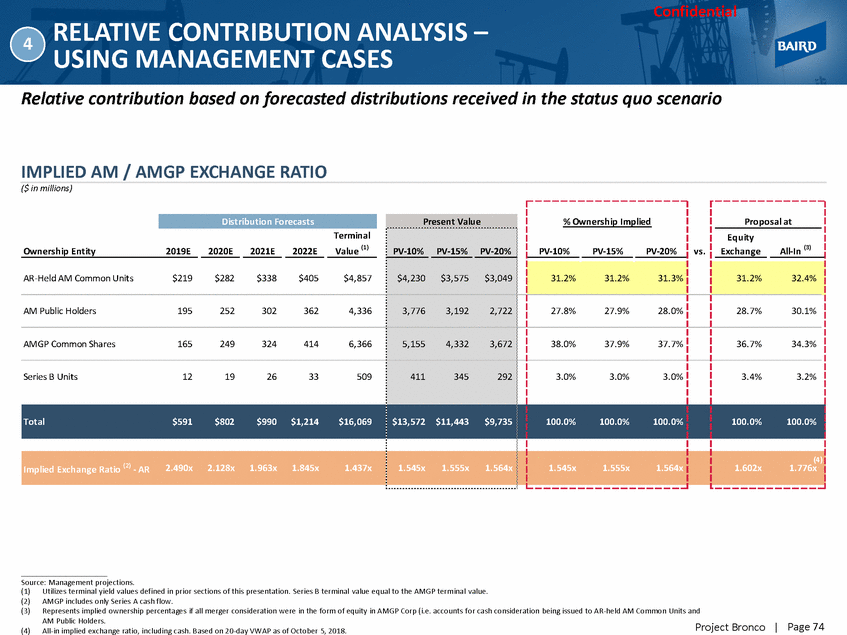
Confidential RELATIVE CONTRIBUTION ANALYSIS – USING MODIFIED COVERAGE CASES 4 Relative contribution based on forecasted distributions received in the status quo scenario IMPLIED AM / AMGP EXCHANGE RATIO ($ in millions) 1.602x 1.776x Source: Management projections. (1) (2) (3) Utilizes terminal yield values defined in prior sections of this presentation. Series B terminal value equal to the AMGP terminal value. AMGP includes only Series A cash flow. Represents implied ownership percentages if all merger consideration were in the form of equity in AMGP Corp (i.e. accounts f or cash consideration being issued to AR-held AM Common Units and AM Public Holders. All-in implied exchange ratio, including cash. Based on 20-day VWAP as of October 5, 2018. Page 75 Project Bronco | (4) % Ownership Implied PV-10%PV-15%PV-20% vs. Proposal at Equity ExchangeAll-In (3) Terminal Ownership Entity2019E2020E2021E2022EValue (1) AR-Held AM Common Units$216$266$310$364$4,362 Present Value PV-10%PV-15%PV-20% $3,832$3,243$2,769 31.6%31.7%31.8% 31.2%32.4% AM Public Holders1932372773253,893 3,4212,8952,471 28.2%28.3%28.4% 28.7%30.1% AMGP Common Shares1622282873595,519 4,5013,7863,212 37.2%37.0%36.9% 36.7%34.3% Series B Units12172228438 356299253 2.9%2.9%2.9% 3.4%3.2% Total$583$749$896$1,076$14,212$12,110 $10,222$8,705 100.0%100.0%100.0% 100.0%100.0% Implied Exchange Ratio (2) - AR2.512x2.194x2.034x1.911x1.488x1.603x1.613x1.623x 1.603x1.613x1.623x (4) Distribution Forecasts
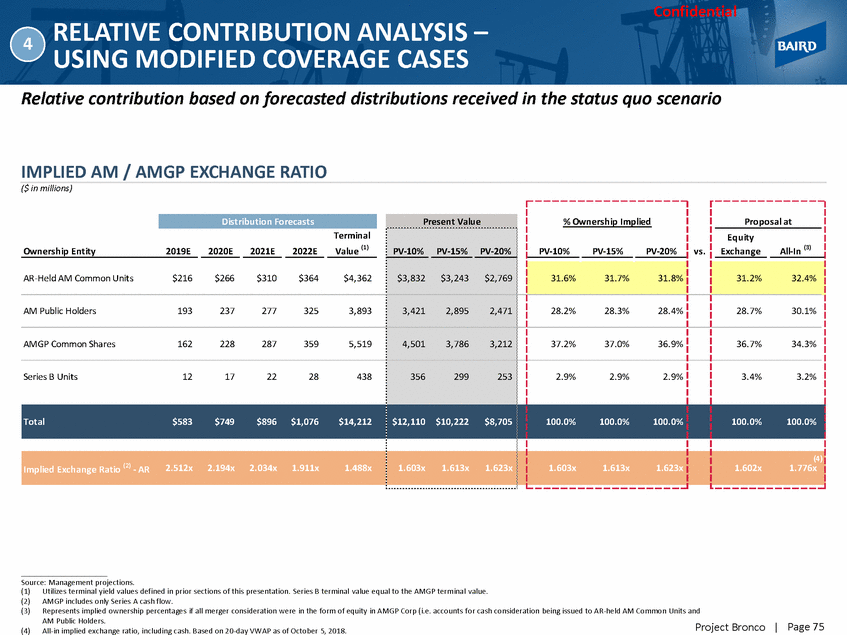
Confidential SELECT EQUITY RESEARCH ANALYST PRICE TARGETS – 4 PRIOR TO SS 13D FILING & SPECIAL COMMITTEE FORMATION Page 76 Project Bronco | Source: Wall Street research. Implied 12-Month12-MonthExchange Firm Date Price Target Price Target Ratio Raymond James 01/22/18 $36.00 $27.00 1.33x Scotia Howard Weil 01/22/18 40.00 24.00 1.67x Baird 01/19/18 43.00 35.00 1.23x Ladenburg Thalmann 01/19/18 41.00 28.00 1.46x Seaport Global 01/19/18 38.00 26.00 1.46x Wells Fargo 01/19/18 40.00 30.00 1.33x Barclays 01/18/18 37.00 23.00 1.61x Morgan Stanley 01/18/18 36.00 27.00 1.33x MUFG Securities 01/18/18 40.00 30.00 1.33x J.P. Morgan 11/21/17 39.00 25.00 1.56x Goldman Sachs 11/03/17 35.00 27.00 1.30x Low $35.00 $23.00 1.23x Median 39.00 27.00 1.44x High 43.00 35.00 1.67x
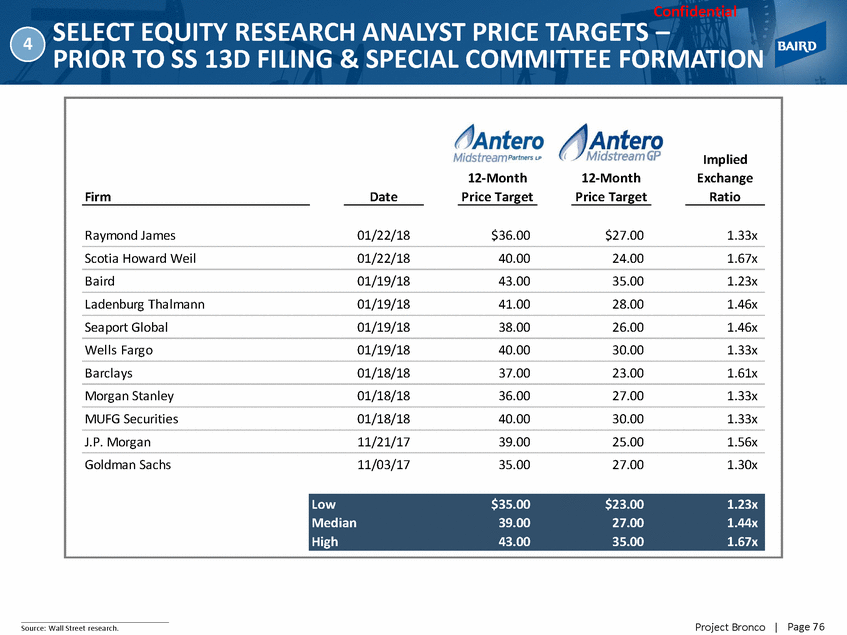
Confidential SELECTED MERGER CONSEQUENCES SUMMARY 4 Key metrics of AMGP Corp vs. status quo AM (using AM Management Case) AM Distribution Growth DCF per AM LP Unit Growth 40% $5.00 $3.75 $3.87 $4.00 30% $3.00 20% $2.00 10% $1.00 $0.00 0% 2019E 2020E 2021E 2022E 2019 2020E 2021E 2022E AM Total Coverage Ratio AM Leverage Year-end Net Debt / LTM EBITDA 4.0x 2.00x 3.0x 1.50x 2.5x 1.16x 1.11x 2.2x 2.1x 1.05x 2.0x 2.0x 1.00x 1.0x 0.50x 0.00x 0.0x 2_0_19E 2020E 2021E 2022E 2018E 2019E 2020E 2021E 2022E Source: Antero management projections. Assumes AMGP purchases 100% of AM public units (188.1 million on a fully diluted basis) with a combination of equity and cash ; AMGP issues 304.3 million shares to current AM unitholders. Also assumes that AMGP issues 17.354 million shares in exchange for 100% of the Series B units. (1)Growth rate assuming an all-in exchange ratio of 1.776x. (2)Distribution growth assuming only the base equity exchange ratio of 1.6023x to AR holders. Page 77 Project Bronco | 3.1x 2.9x 2.3x 2.7x 2.3x 2.3x 1.31x 1.32x 1.24x 1.23x 1.19x $4.29 $4.50 $3.24 $3.26 $2.75 $2.68 (1) 29% 29% 29% 29% 16% (2) 20% 20% 20% 20% Status QuoPro Forma
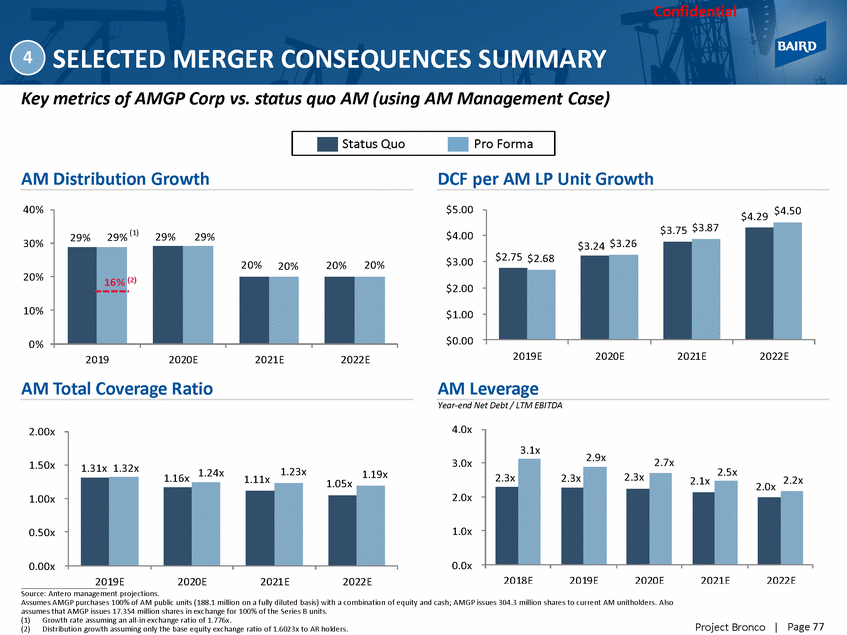
Confidential SELECTED MERGER CONSEQUENCES SUMMARY (CONT.) 4 Impact to AR across key metrics Dividend per AR-Owned AM Unit DCF per AR-Owned AM Unit Cash at Dividends $5.00 $5.00 $3.70 $4.00 $4.00 $3.24 $3.09 $3.00 $2.85 $2.75 $3.00 $2.57 $3.00 $2.00 $2.00 $1.00 $1.00 $0.00 $0.00 At Clos e 2019E 2020E 2021E 2022E 2019E 2020E 2021E 2022E Total Cash to AR from Midstream Holdings ($ in millions) $305 $282 $254 $219 $197 Source: Antero management projections. Assumes AMGP purchases 100% of AM public units (188.1 million on a fully diluted basis) with a combination of equity and cash ; AMGP issues 304.3 million shares to current AM unitholders. Also assumes that AMGP issues 17.354 million shares in exchange for 100% of the Series B units. Page 78 Project Bronco | $297 $338 $405 $366 $1,419 $1,244 $0 At Clos e 2019 2020 2021 2022 Total C ash Through 2022 $4.29 $4.41 $3.75 $3.79 $3.19 $2.63 close$4.10 $3.42 1.05x 1.19x 1.11x 1.23x $2.21 $1.99 1.16x 1.24x 1.31x 1.32x Status QuoPro Forma
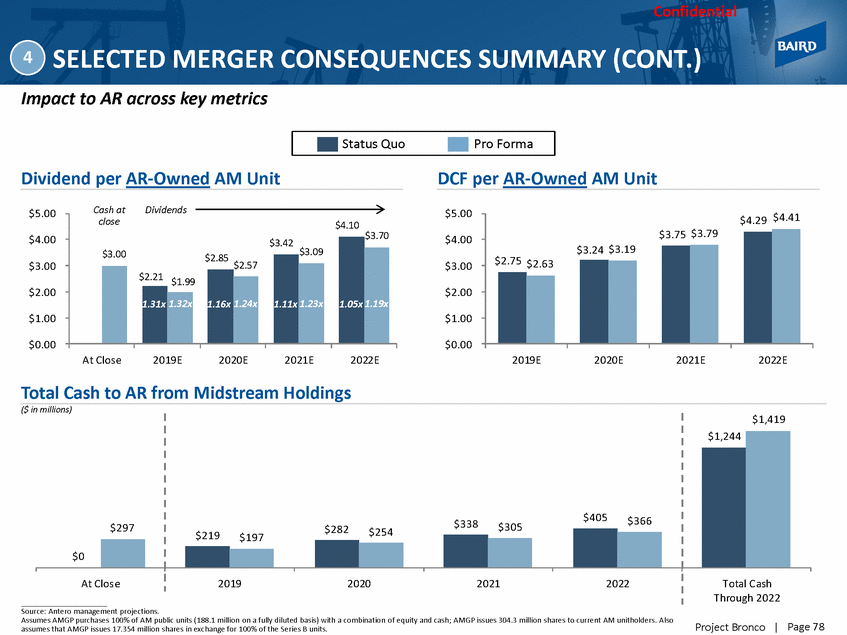
Baird Investment Advisor Co.,Ltd.,an affiliate of Robert W. Baird & Co.Incorporated. Robert W.Baird Ltd.and Baird Capital Partners Europe are authorized and regulated in the UK by the Financial Conduct Authority.
