Confidential Working Draft Presentation to the Board of Directors Project Alpine Preliminary Review March 20, 2018
Confidential Working Draft Presentation to the Board of Directors Project Alpine Preliminary Review March 20, 2018

Confidential Working Draft Project Alpine Table of Contents Executive Summary Section 1 Valuation Benchmarking Section 2 Simplification Alternatives Section 3 AMGP Acquisition of AM Appendix A AMGP Acquisition of AM – Street Case Appendix B Supporting Materials Appendix C Precedent Transactions 2
Confidential Working Draft Project Alpine Executive Summary • We have evaluated selected “simplification” strategies which would combine AM and AMGP and/or eliminate the IDR mechanism • The optimal mechanism for combining AM and AMGP is via AMGP acquiring AM – Results in a simple C-Corp structure (for tax purposes only), increasingly the vehicle preferred by the market – Provides tax basis step-up and concomitant shelter and therefore improved distributions relative to other combination alternatives – Is however taxable to AM unitholders including AR, mitigated somewhat by public unitholders’ relatively high estimated average tax basis of $23.53 per unit and AR’s $3Bn of NOLs • In this presentation we will: – Benchmark AM and AMGP trading levels and performance – Review relative attributes and financial impact of selected simplification alternatives – Analyze financial impact of AMGP buying AM – Evaluate potential trading levels of the pro forma combined entity 3
Confidential Working Draft Project Alpine Section 1 Valuation Benchmarking 4
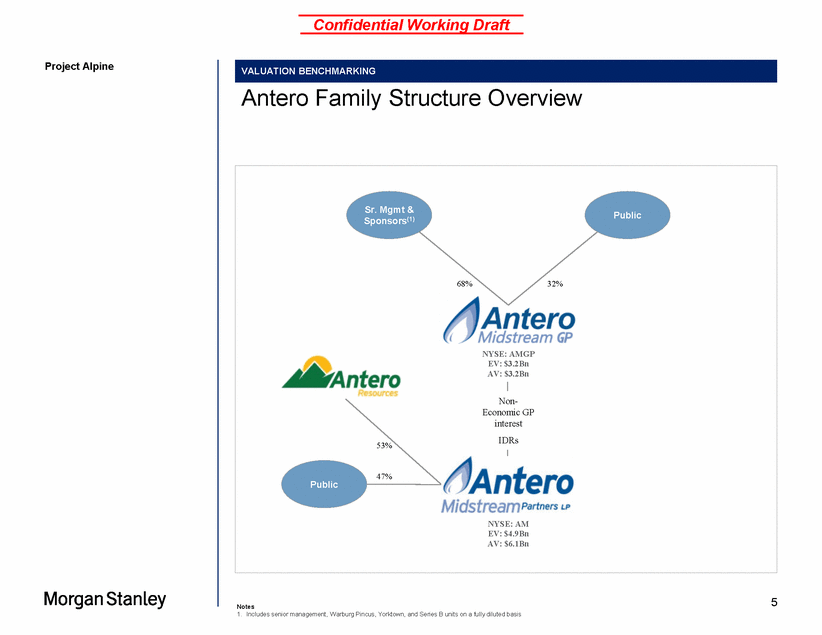
Confidential Working Draft Project Alpine Antero Family Structure Overview Sponsors(1) Public 5 Notes 1. Includes senior management, Warburg Pincus, Yorktown, and Series B units on a fully diluted basis Sr. Mgmt &Public 68%32% NYSE: AMGP EV: $3.2Bn AV: $3.2Bn Non-Economic GP interest 53%IDRs 47% NYSE: AM EV: $4.9Bn AV: $6.1Bn VALUATION BENCHMARKING
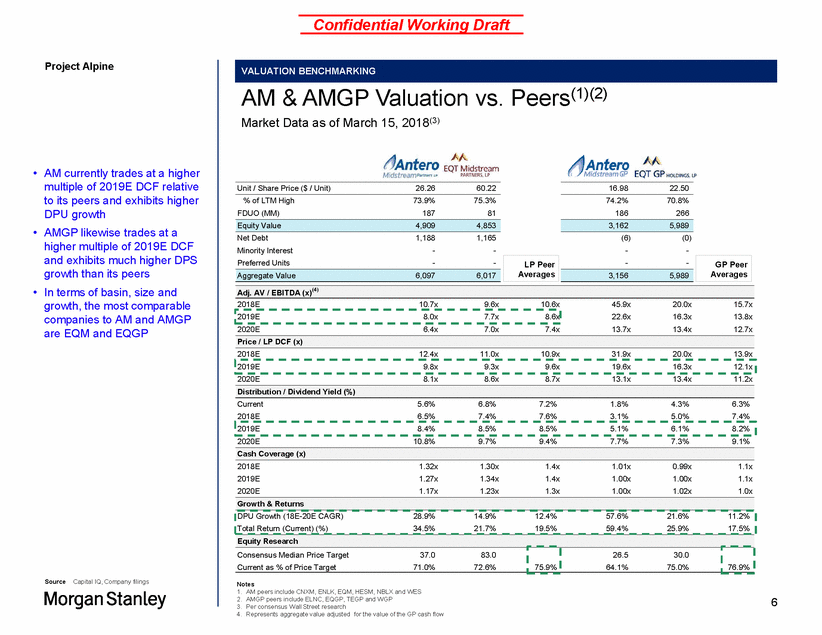
Confidential Working Draft Project Alpine Peers(1)(2) AM & AMGP Valuation vs. Market Data as of March 15, 2018(3) • AM currently trades at a higher multiple of 2019E DCF relative to its peers and exhibits higher DPU growth AMGP likewise trades at a higher multiple of 2019E DCF and exhibits much higher DPS growth than its peers In terms of basin, size and growth, the most comparable companies to AM and AMGP are EQM and EQGP Unit / Share Price ($ / Unit) 26.26 60.22 16.98 22.50 % of LTM High FDUO (MM) 73.9% 187 75.3% 81 74.2% 186 70.8% 266 • Net Debt Minority Interest 1,188 - 1,165 - (6) - (0) - • 2018E 10.7x 9.6x 10.6x 45.9x 22.6x 13.7x 20.0x 16.3x 13.4x 15.7x 13.8x 12.7x 2020E 6.4x 7.0x 7.4x 2018E 12.4x 11.0x 10.9x 31.9x 20.0x 13.9x 2020E 8.1x 8.6x 8.7x 13.1x 13.4x 11.2x Current 2018E 5.6% 6.5% 6.8% 7.4% 7.2% 7.6% 1.8% 3.1% 4.3% 5.0% 6.3% 7.4% 2020E 10.8% 9.7% 9.4% 7.7% 7.3% 9.1% 2018E 2019E 2020E 1.32x 1.27x 1.17x 1.30x 1.34x 1.23x 1.4x 1.4x 1.3x 1.01x 1.00x 1.00x 0.99x 1.00x 1.02x 1.1x 1.1x 1.0x Source Capital IQ, Company filings Notes 1. AM peers include CNXM, ENLK, EQM, HESM, NBLX and WES 2. AMGP peers include ELNC, EQGP, TEGP and WGP 3. Per consensus Wall Street research 4. Represents aggregate value adjusted for the value of the GP cash flow 6 Growth & Returns DPU Growth (18E-20E CAGR)28.9%14.9%12.4%57.6%21.6%11.2% Total Return (Current) (%)34.5%21.7%19.5%59.4%25.9%17.5% Equity Research Consensus Median Price Target37.083.0 Current as % of Price Target71.0%72.6% 75.9% 26.530.0 64.1%75.0% 76.9% Cash Coverage (x) 2019E8.4%8.5%8.5%5.1%6.1%8.2% Distribution / Dividend Yield (%) 2019E9.8x9.3x9.6x19.6x16.3x12.1x Price / LP DCF (x) 2019E8.0x7.7x8.6x Adj. AV / EBITDA (x)(4) Preferred Units--LP Peer Averages --GP Peer Averages Aggregate Value6,0976,017 3,1565,989 3,1625,989 Equity Value4,9094,853 VALUATION BENCHMARKING
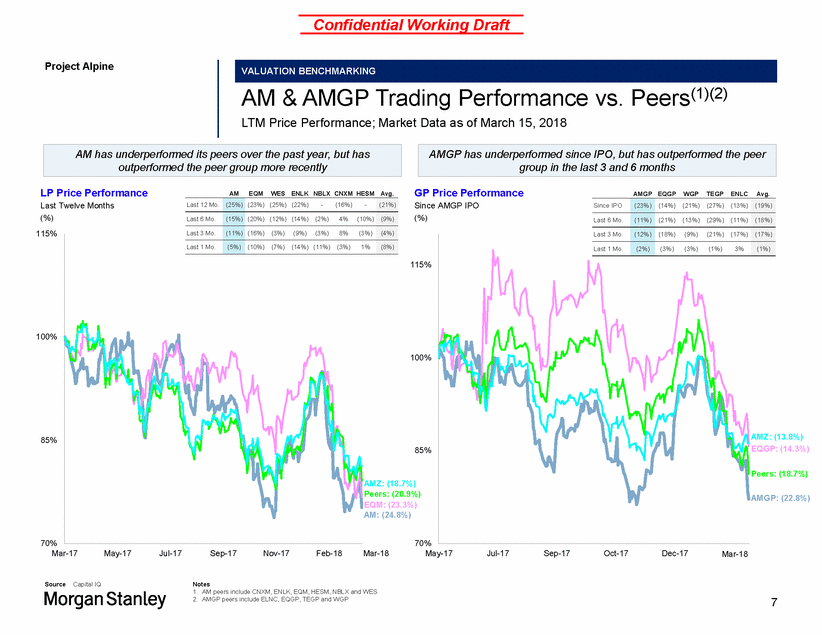
Confidential Working Draft Project Alpine Peers(1)(2) AM & AMGP Trading Performance LTM Price Performance; Market Data as of March 15, 2018 vs. LP Price Performance Last Twelve Months (%) GP Price Performance Since AMGP IPO (%) AM EQM WES ENLK NBLX CNXM HESM Avg. AMGP EQGP WGP TEGP ENLC Avg. 115% 115% 100% 100% AMZ: (13.8%) EQGP: (14.3%) 85% 85% Peers: (18.7%) AMZ: (18.7%) Peers: (20.9%) EQM: (23.3%) AM: (24.8%) AMGP: (22.8%) 70% 70% Mar-17 May-17 Jul-17 Sep-17 Nov-17 Feb-18 Mar-18 May-17 Jul-17 Sep-17 Oct-17 Dec-17 FMeabr-18 Source Capital IQ Notes 1. AM peers include CNXM, ENLK, EQM, HESM, NBLX and WES 2. AMGP peers include ELNC, EQGP, TEGP and WGP 7 Last 12 Mo. (25%) (23%) (25%) (22%)-(16%)-(21%) Last 6 Mo. (15%) (20%) (12%) (14%) (2%)4% (10%) (9%) Last 3 Mo. (11%) (16%) (3%) (9%) (3%)8%(3%) (4%) Last 1 Mo. (5%) (10%) (7%) (14%) (11%) (3%)1% (8%) Since IPO (23%) (14%) (21%) (27%) (13%) (19%) Last 6 Mo. (11%) (21%) (13%) (29%) (11%) (18%) Last 3 Mo. (12%) (18%) (9%) (21%) (17%) (17%) Last 1 Mo. (2%) (3%) (3%) (1%) 3% (1%) AMGP has underperformed since IPO, but has outperformed the peer group in the last 3 and 6 months AM has underperformed its peers over the past year, but has outperformed the peer group more recently VALUATION BENCHMARKING
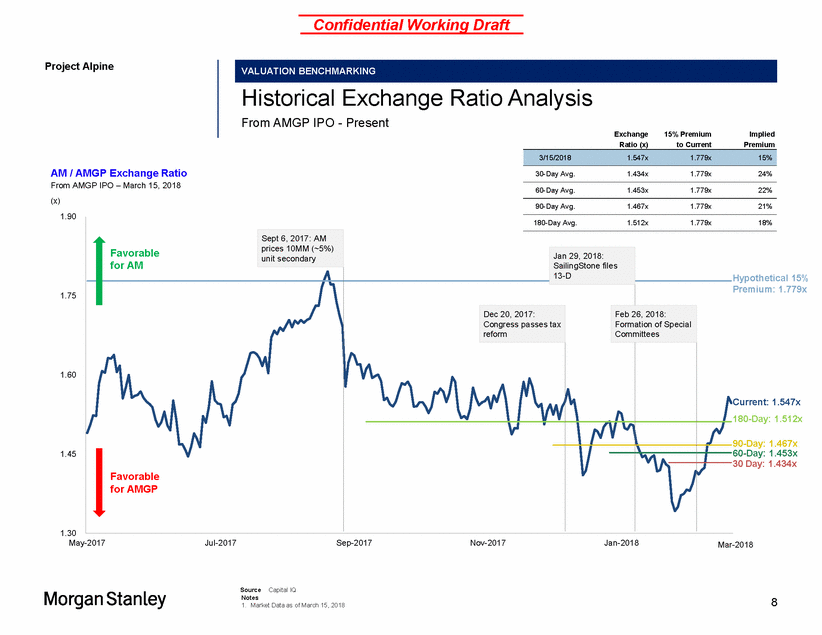
Confidential Working Draft Project Alpine Historical Exchange From AMGP IPO - Present Ratio Analysis Exchange Ratio (x) 15% Premium to Current Implied Premium AM / AMGP Exchange Ratio From AMGP IPO – March 15, 2018 (x) 30-Day Avg. 1.434x 1.779x 24% 60-Day Avg. 1.453x 1.779x 22% 90-Day Avg. 1.467x 1.779x 21% 1.90 18% for AM Hypothetical 15% Premium: 1.779x 1.75 1.60 Current: 1.547x 180-Day: 1.512x 90-Day: 1.467x 60-Day: 1.453x 30 Day: 1.434x 1.45 1.30 May-2017 Jul-2017 Sep-2017 Nov-2017 Jan-2018 Mar-2018 Source Capital IQ Notes 1. Market Data as of March 15, 2018 8 180-Day Avg.1.512x1.779x Favorable Sept 6, 2017: AM prices 10MM (~5%) unit secondary Jan 29, 2018: SailingStone files 13-D Favorable for AMGP Dec 20, 2017: Congress passes tax reform Feb 26, 2018: Formation of Special Committees 3/15/20181.547x1.779x15% VALUATION BENCHMARKING
Confidential Working Draft Project Alpine Section 2 Simplification Alternatives 9
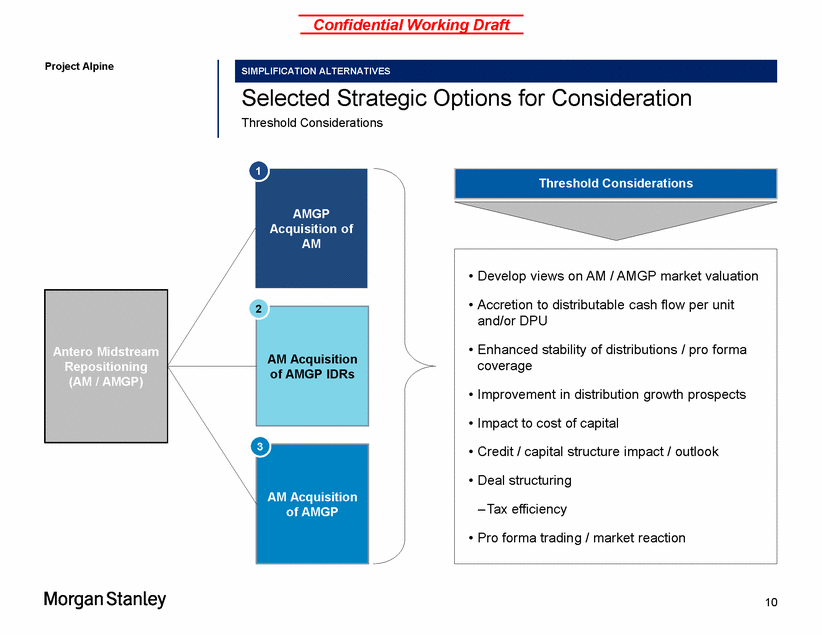
Confidential Working Draft Project Alpine Selected Strategic Threshold Considerations Options for Consideration of AMGP IDRs of AMGP 10 3 AM Acquisition Antero Midstream Repositioning (AM / AMGP) 2 AM Acquisition • Develop views on AM / AMGP market valuation • Accretion to distributable cash flow per unit and/or DPU • Enhanced stability of distributions / pro forma coverage • Improvement in distribution growth prospects • Impact to cost of capital • Credit / capital structure impact / outlook • Deal structuring – Tax efficiency • Pro forma trading / market reaction 1 AMGP Acquisition of AM Threshold Considerations SIMPLIFICATION ALTERNATIVES
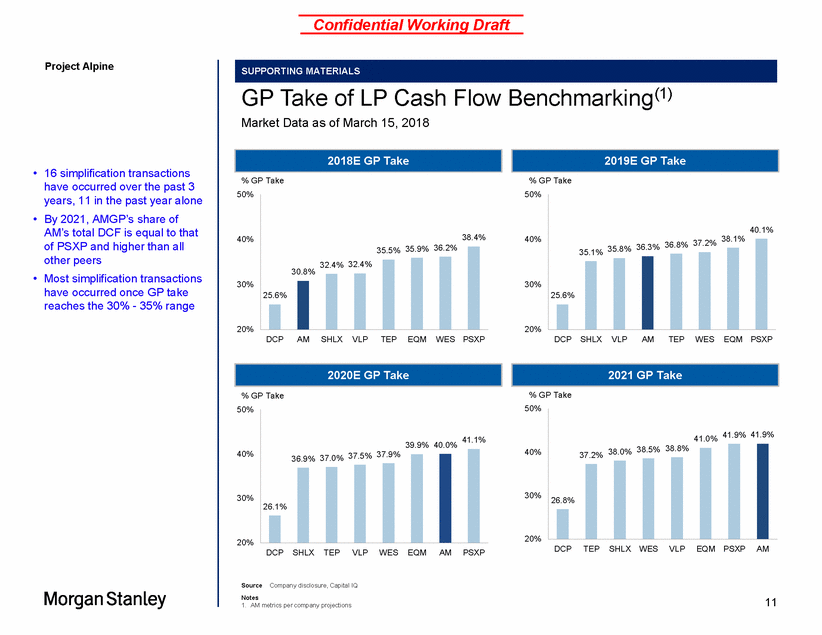
Confidential Working Draft Project Alpine Benchmarking(1) GP Take of LP Cash Market Data as of March 15, 2018 Flow • 16 simplification transactions have occurred over the past 3 years, 11 in the past year alone By 2021, AMGP’s share of AM’s total DCF is equal to that of PSXP and higher than all other peers Most simplification transactions have occurred once GP take reaches the 30% - 35% range % GP Take % GP Take 50% 50% • 40% 40% 35.1% 35.8% 36.3% 36.8% 6.2% 30.8% • 30% 30% 20% 20% DCP AM SHLX VLP TEP EQM WES PSXP DCP SHLX VLP AM TEP WES EQM PSXP % GP Take % GP Take 50% 50% 41.0% 38.5% 38.8% 40% 40% 30% 30% 20% 20% DCP TEP SHLX WESVLPEQM PSXP AM DCP SHLX TEP VLP WES EQM AM PSXP Source Company disclosure, Capital IQ Notes 1. AM metrics per company projections 11 39.9% 40.0% 41.1% 36.9% 37.0% 37.5% 37.9% 26.1% 41.9% 41.9% 37.2% 38.0% 26.8% 2020E GP Take 2021 GP Take 38.4% 35.5% 35.9% 3 32.4% 32.4% 25.6% 40.1% 37.2% 38.1% 25.6% 2018E GP Take 2019E GP Take SUPPORTING MATERIALS
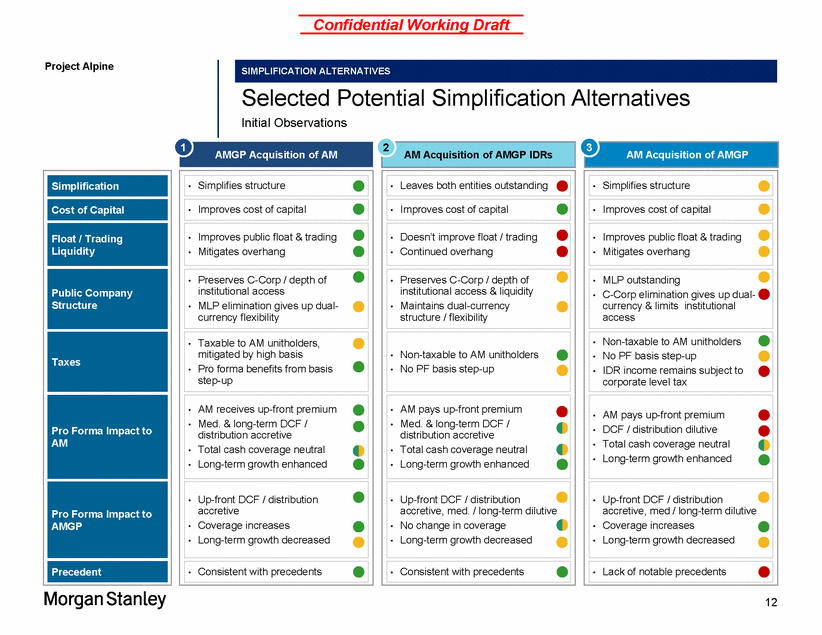
Confidential Working Draft Project Alpine Selected Potential Simplification Alternatives Initial Observations AM Acquisition of AMGP IDRs 12 AM Simplification Cost of Capital Float / Trading Liquidity Public Company Structure Taxes Pro Forma Impact to Pro Forma Impact to AMGP Precedent 2 • Long-term growth enhanced • Leaves both entities outstanding • Improves cost of capital • Doesn’t improve float / trading • Continued overhang • Preserves C-Corp / depth of institutional access & liquidity • Maintains dual-currency structure / flexibility • Non-taxable to AM unitholders • No PF basis step-up • AM pays up-front premium • Med. & long-term DCF / distribution accretive • Total cash coverage neutral • Up-front DCF / distribution accretive, med. / long-term dilutive • No change in coverage • Long-term growth decreased • Consistent with precedents 3 AM Acquisition of AMGP corporate level tax • Simplifies structure • Improves cost of capital • Improves public float & trading • Mitigates overhang • MLP outstanding • C-Corp elimination gives up dual-currency & limits institutional access • Non-taxable to AM unitholders • No PF basis step-up • IDR income remains subject to • AM pays up-front premium • DCF / distribution dilutive • Total cash coverage neutral • Long-term growth enhanced • Up-front DCF / distribution accretive, med / long-term dilutive • Coverage increases • Long-term growth decreased • Lack of notable precedents 1 AMGP Acquisition of AM • Simplifies structure • Improves cost of capital • Improves public float & trading • Mitigates overhang • Preserves C-Corp / depth of institutional access • MLP elimination gives up dual-currency flexibility • Taxable to AM unitholders, mitigated by high basis • Pro forma benefits from basis step-up • AM receives up-front premium • Med. & long-term DCF / distribution accretive • Total cash coverage neutral • Long-term growth enhanced • Up-front DCF / distribution accretive • Coverage increases • Long-term growth decreased • Consistent with precedents SIMPLIFICATION ALTERNATIVES
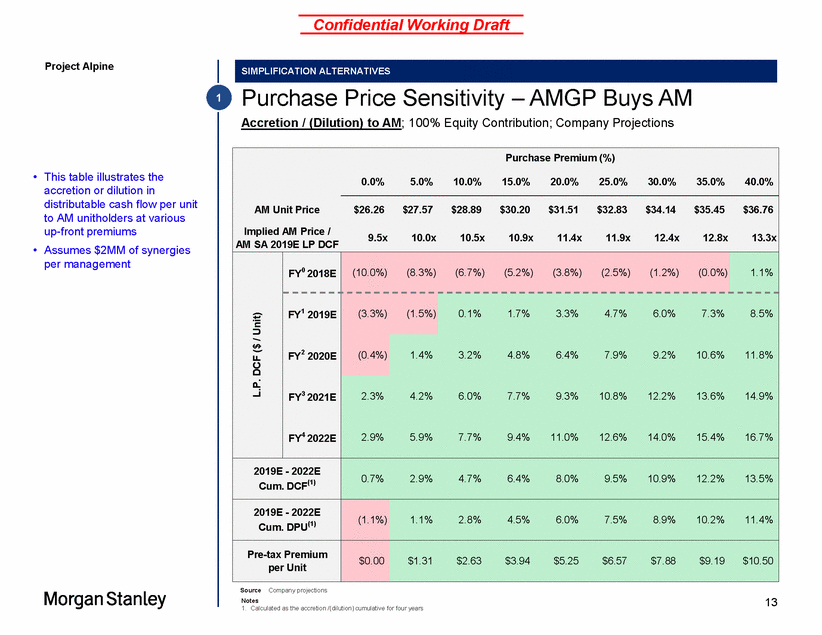
Confidential Working Draft Project Alpine Purchase Price Sensitivity – AMGP Buys AM Accretion / (Dilution) to AM; 100% Equity Contribution; Company Projections 1 • This table illustrates the accretion or dilution in distributable cash flow per unit to AM unitholders at various up-front premiums Assumes $2MM of synergies per management 9.5x 10.0x 10.5x 10.9x 11.4x 11.9x 12.4x 12.8x 13.3x AM SA 2019E LP DCF • Source Company projections Notes 1. Calculated as the accretion /(dilution) cumulative for four years 13 Purchase Premium (%) 0.0% 5.0% 10.0% 15.0% 20.0% 25.0% 30.0% 35.0% 40.0% AM Unit Price $26.26 $27.57 $28.89 $30.20 $31.51 $32.83 $34.14 $35.45 $36.76 Implied AM Price / FY0 2018E (10.0%) (8.3%) (6.7%) (5.2%) (3.8%) (2.5%) (1.2%) (0.0%) 1.1% Unit) FY1 2019E (3.3%) (1.5%) 0.1% 1.7% 3.3% 4.7% 6.0% 7.3% 8.5% DCF ($ / FY2 2020E (0.4%) 1.4% 3.2% 4.8% 6.4% 7.9% 9.2% 10.6% 11.8% L.P. FY3 2021E FY4 2022E 2.3% 4.2% 6.0% 7.7% 9.3% 10.8% 12.2% 13.6% 14.9% 2.9% 5.9% 7.7% 9.4% 11.0% 12.6% 14.0% 15.4% 16.7% 2019E - 2022E Cum. DCF(1) 0.7% 2.9% 4.7% 6.4% 8.0% 9.5% 10.9% 12.2% 13.5% 2019E - 2022E Cum. DPU(1) (1.1%) 1.1% 2.8% 4.5% 6.0% 7.5% 8.9% 10.2% 11.4% Pre-tax Premium per Unit $0.00 $1.31 $2.63 $3.94 $5.25 $6.57 $7.88 $9.19 $10.50 SIMPLIFICATION ALTERNATIVES
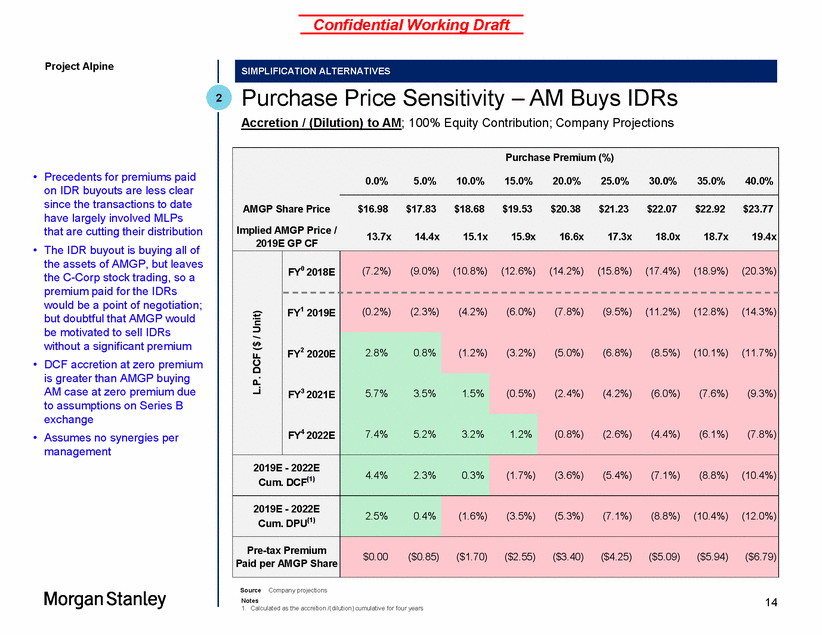
Confidential Working Draft Project Alpine Purchase Price Sensitivity – AM Buys IDRs Accretion / (Dilution) to AM; 100% Equity Contribution; Company Projections 2 • Precedents for premiums paid on IDR buyouts are less clear since the transactions to date have largely involved MLPs that are cutting their distribution The IDR buyout is buying all of the assets of AMGP, but leaves the C-Corp stock trading, so a premium paid for the IDRs would be a point of negotiation; but doubtful that AMGP would be motivated to sell IDRs without a significant premium DCF accretion at zero premium is greater than AMGP buying AM case at zero premium due to assumptions on Series B exchange Assumes no synergies per management 13.7x 14.4x 15.1x 15.9x 16.6x 17.3x 18.0x 18.7x 19.4x 2019E GP CF • • • Source Company projections Notes 1. Calculated as the accretion /(dilution) cumulative for four years 14 Purchase Premium (%) 0.0% 5.0% 10.0% 15.0% 20.0% 25.0% 30.0% 35.0% 40.0% AMGP Share Price $16.98 $17.83 $18.68 $19.53 $20.38 $21.23 $22.07 $22.92 $23.77 Implied AMGP Price / Unit) FY0 2018E (7.2%) (9.0%) (10.8%) (12.6%) (14.2%) (15.8%) (17.4%) (18.9%) (20.3%) FY1 2019E (0.2%) (2.3%) (4.2%) (6.0%) (7.8%) (9.5%) (11.2%) (12.8%) (14.3%) DCF ($ / FY2 2020E 2.8% 0.8% (1.2%) (3.2%) (5.0%) (6.8%) (8.5%) (10.1%) (11.7%) L.P. FY3 2021E 5.7% 3.5% 1.5% (0.5%) (2.4%) (4.2%) (6.0%) (7.6%) (9.3%) FY4 2022E 7.4% 5.2% 3.2% 1.2% (0.8%) (2.6%) (4.4%) (6.1%) (7.8%) 2019E - 2022E Cum. DCF(1) 4.4% 2.3% 0.3% (1.7%) (3.6%) (5.4%) (7.1%) (8.8%) (10.4%) 2019E - 2022E Cum. DPU(1) 2.5% 0.4% (1.6%) (3.5%) (5.3%) (7.1%) (8.8%) (10.4%) (12.0%) Pre-tax Premium Paid per AMGP Share $0.00 ($0.85) ($1.70) ($2.55) ($3.40) ($4.25) ($5.09) ($5.94) ($6.79) SIMPLIFICATION ALTERNATIVES
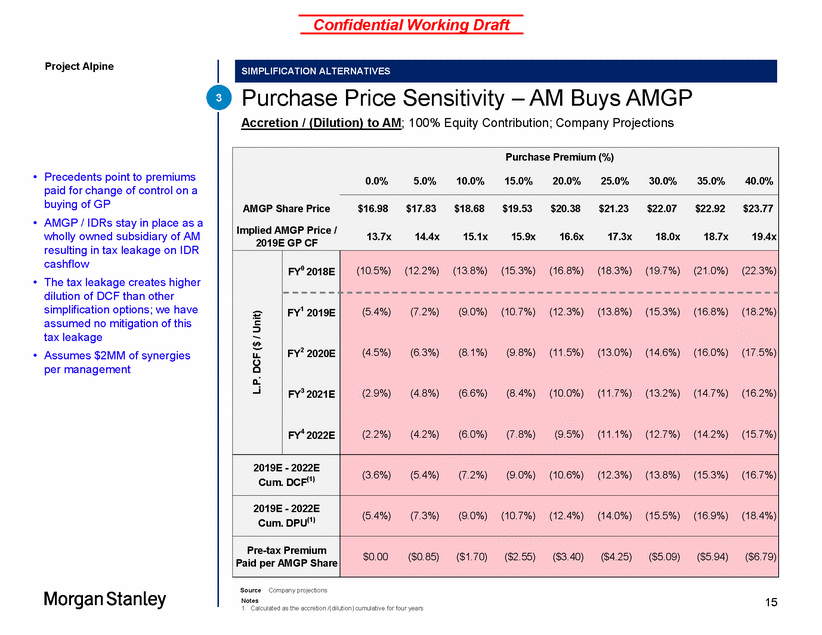
Confidential Working Draft Project Alpine Purchase Price Sensitivity – AM Buys AMGP Accretion / (Dilution) to AM; 100% Equity Contribution; Company Projections 3 • Precedents point to premiums paid for change of control on a buying of GP AMGP / IDRs stay in place as a wholly owned subsidiary of AM resulting in tax leakage on IDR cashflow The tax leakage creates higher dilution of DCF than other simplification options; we have assumed no mitigation of this tax leakage Assumes $2MM of synergies per management • • • Source Company projections Notes 1. Calculated as the accretion /(dilution) cumulative for four years 15 Purchase Premium (%) 0.0% 5.0% 10.0% 15.0% 20.0% 25.0% 30.0% 35.0% 40.0% AMGP Share Price $16.98 $17.83 $18.68 $19.53 $20.38 $21.23 $22.07 $22.92 $23.77 Implied AMGP Price / 2019E GP CF 13.7x 14.4x 15.1x 15.9x 16.6x 17.3x 18.0x 18.7x 19.4x L.P. DCF ($ / Unit) FY0 2018E (10.5%) (12.2%) (13.8%) (15.3%) (16.8%) (18.3%) (19.7%) (21.0%) (22.3%) FY1 2019E FY2 2020E FY3 2021E FY4 2022E (5.4%) (7.2%) (9.0%) (10.7%) (12.3%) (13.8%) (15.3%) (16.8%) (18.2%) (4.5%) (6.3%) (8.1%) (9.8%) (11.5%) (13.0%) (14.6%) (16.0%) (17.5%) (2.9%) (4.8%) (6.6%) (8.4%) (10.0%) (11.7%) (13.2%) (14.7%) (16.2%) (2.2%) (4.2%) (6.0%) (7.8%) (9.5%) (11.1%) (12.7%) (14.2%) (15.7%) 2019E - 2022E Cum. DCF(1) (3.6%) (5.4%) (7.2%) (9.0%) (10.6%) (12.3%) (13.8%) (15.3%) (16.7%) 2019E - 2022E Cum. DPU(1) (5.4%) (7.3%) (9.0%) (10.7%) (12.4%) (14.0%) (15.5%) (16.9%) (18.4%) Pre-tax Premium Paid per AMGP Share $0.00 ($0.85) ($1.70) ($2.55) ($3.40) ($4.25) ($5.09) ($5.94) ($6.79) SIMPLIFICATION ALTERNATIVES
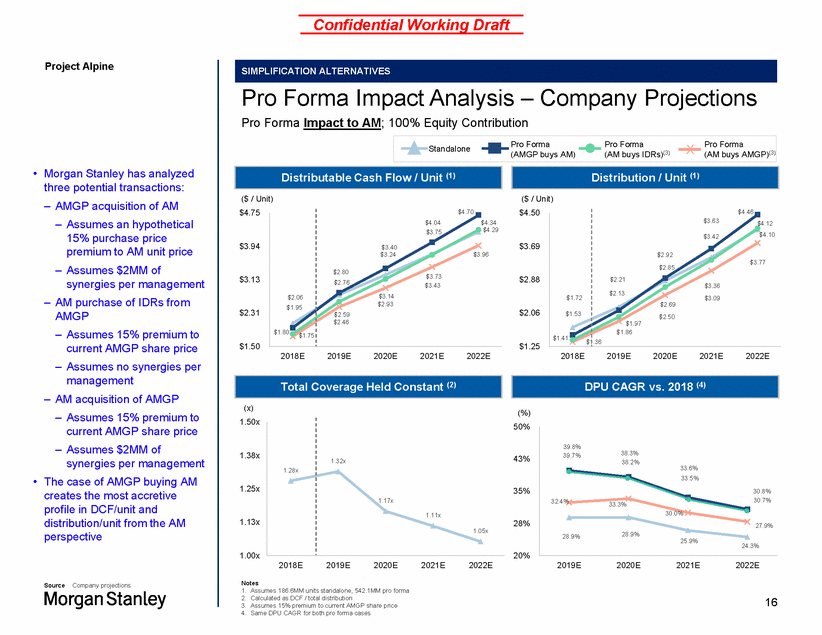
Confidential Working Draft Project Alpine Pro Forma Impact Analysis – Company Projections Pro Forma Impact to AM; 100% Equity Contribution (AM buys IDRs)(3) (AM buys AMGP)(3) • Morgan Stanley has analyzed three potential transactions: – AMGP acquisition of AM – Assumes an hypothetical 15% purchase price premium to AM unit price – Assumes $2MM of synergies per management – AM purchase of IDRs from AMGP – Assumes 15% premium to current AMGP share price – Assumes no synergies per management – AM acquisition of AMGP – Assumes 15% premium to current AMGP share price – Assumes $2MM of synergies per management The case of AMGP buying AM creates the most accretive profile in DCF/unit and distribution/unit from the AM perspective ($ / Unit) ($ / Unit) $4.75 $4.50 $3.75 $3.94 $3.69 $2.85 $3.13 $2.88 $3.43 $2.31 $2.06 .36 $1.50 $1.25 2018E 2019E 2020E 2021E 2022E 2018E 2019E 2020E 2021E 2022E (x) 1.50x (%) 50% 1.38x 43% 33.6% • 1.25x 35% 1.13x 28% 25.9% 1.00x 20% 2018E 2019E 2020E 2021E 2022E 2019E 2020E 2021E 2022E Notes 1. Assumes 186.6MM units standalone, 542.1MM pro forma 2. Calculated as DCF / total distribution 3. Assumes 15% premium to current AMGP share price 4. Same DPU CAGR for both pro forma cases Source Company projections 16 39.8% 39.7%38.3% 38.2% 33.5% 30.8% 32.4%33.3%30.7% 30.0% 27.9% 28.9%28.9% 24.3% 1.28x 1.32x 1.17x 1.11x 1.05x Total Coverage Held Constant (2) Text TitleDPU CAGR vs. 2018 (4) Text Subtitle $2.06 $1.95 $1.80 $1.75 $4.70 $4.04$4.34 $4.29 $3.40 $3.24$3.96 $2.80 $2.76$3.73 $3.14 $2.93 $2.59 $2.46 $1.72 $1.53 $1.41$1 $4.46 $3.63$4.12 $3.42$4.10 $2.92 $3.77 $2.21 $3.36 $2.13 $3.09 $2.69 $2.50 $1.97 $1.86 Standal onePro Forma (AMGP buys AM) Pro FormaX Pro Forma Distributable Cash Flow / Unit (1) Distribution / Unit (1) SIMPLIFICATION ALTERNATIVES
Confidential Working Draft Project Alpine Section 3 AMGP Acquisition of AM 17
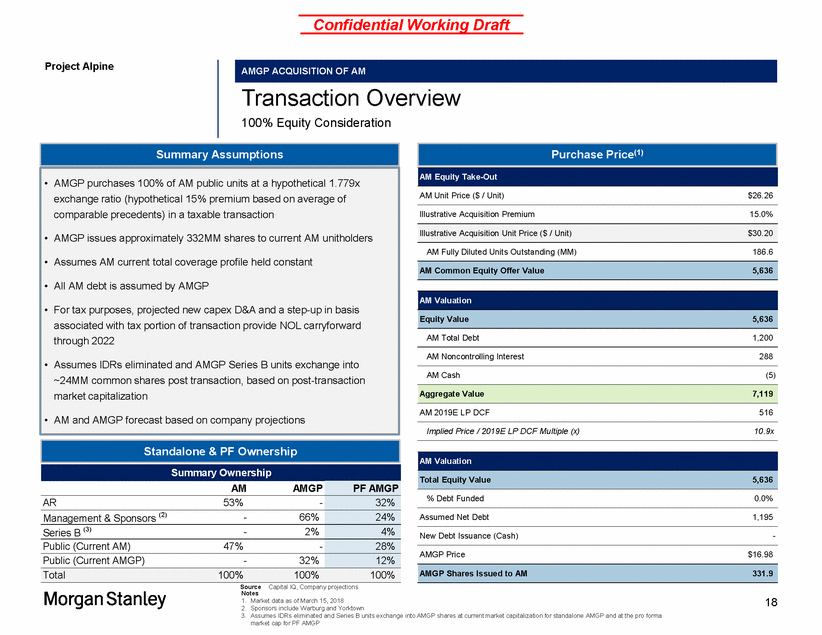
Confidential Working Draft Project Alpine Transaction Overview 100% Equity Consideration AM Unit Price ($ / Unit) $26.26 Illustrative Acquisition Premium 15.0% AM Fully Diluted Units Outstanding (MM) 186.6 AM Total Debt 1,200 AM Noncontrolling Interest 288 AM Cash (5) AM 2019E LP DCF 516 Implied Price / 2019E LP DCF Multiple (x) 10.9x % Debt Funded 0.0% Assumed Net Debt 1,195 New Debt Issuance (Cash) - AMGP Price $16.98 Source Capital IQ, Company projections Notes 1. Market data as of March 15, 2018 2. Sponsors include Warburg and Yorktown 3. Assumes IDRs eliminated and Series B units exchange into AMGP shares at current market capitalization for standalone AMGP and at the pro forma market cap for PF AMGP 18 AMGP Shares Issued to AM331.9 AM Valuation Total Equity Value5,636 Standalone & PF Ownership Summary Ownership AMAMGP PF AMGP AR 53% - 32% Management & Sponsors (2) - 66% 24% Series B (3) - 2% 4% Public (Current AM) 47% - 28% Public (Current AMGP) - 32% 12% Total 100% 100% 100% Aggregate Value7,119 AM Valuation Equity Value5,636 AM Common Equity Offer Value5,636 Illustrative Acquisition Unit Price ($ / Unit)$30.20 Summary Assumptions • AMGP purchases 100% of AM public units at a hypothetical 1.779x exchange ratio (hypothetical 15% premium based on average of comparable precedents) in a taxable transaction • AMGP issues approximately 332MM shares to current AM unitholders • Assumes AM current total coverage profile held constant • All AM debt is assumed by AMGP • For tax purposes, projected new capex D&A and a step-up in basis associated with tax portion of transaction provide NOL carryforward through 2022 • Assumes IDRs eliminated and AMGP Series B units exchange into ~24MM common shares post transaction, based on post-transaction market capitalization • AM and AMGP forecast based on company projections Purchase Price(1) AM Equity Take-Out AMGP ACQUISITION OF AM
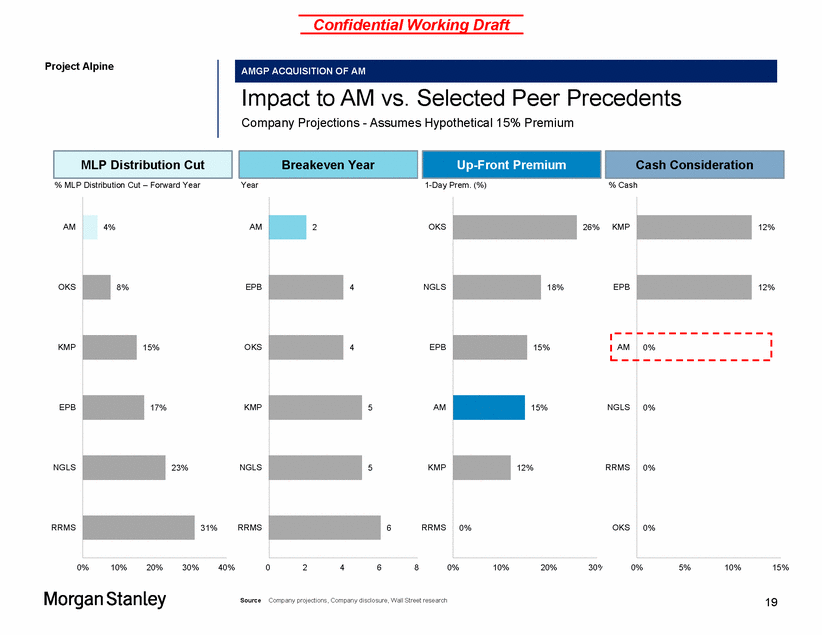
Confidential Working Draft Project Alpine Impact to AM vs. Selected Peer Precedents Company Projections - Assumes Hypothetical 15% Premium % MLP Distribution Cut – Forward Year Year 1-Day Prem. (%) % Cash AM AM OKS 26% OKS EPB NGLS KMP OKS EPB EPB KMP AM NGLS NGLS NGLS KMP RRMS RRMS RRMS RRMS 0% 10% 20% 30% 40% 0 2 4 6 8 0% 10% 20% 30% 0% 5% 10% 15% 19 Source Company projections, Company disclosure, Wall Street research KMP EPB 12% 12% AM 0% OKS 0% 0% 0% 18% 15% 15% 12% 0% 2 4 4 5 5 6 + 4% 8% 15% 17% 23% 31% Cash Consideration Up-Front Premium Breakeven Year MLP Distribution Cut AMGP ACQUISITION OF AM
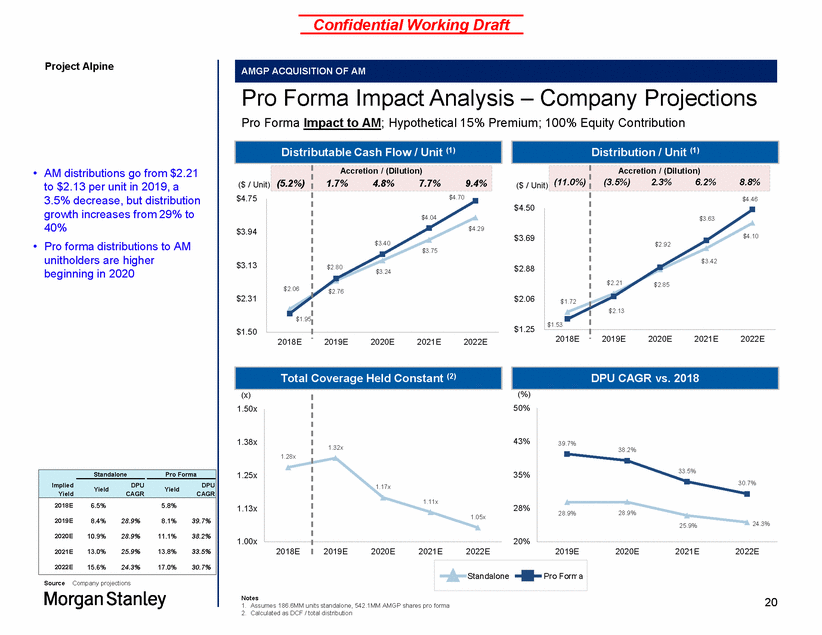
Confidential Working Draft Project Alpine Pro Forma Impact Analysis – Company Projections Pro Forma Impact to AM; Hypothetical 15% Premium; 100% Equity Contribution • AM distributions go from $2.21 to $2.13 per unit in 2019, a 3.5% decrease, but distribution growth increases from 29% to 40% Pro forma distributions to AM unitholders are higher beginning in 2020 $4.75 $4.50 • $1.25 $1.50 2018E2019E 2020E 2021E 2022E 2018E2019E 2020E 2021E 2022E (%) 50% (x) 1.50x 1.38x 43% 38.2% 1.25x 35% Yield Yield 1.13x 28% 24.3% 25.9% 1.00x 20% 2019E 2020E 2021E 2022E Source Company projections Notes 1. Assumes 186.6MM units standalone, 542.1MM AMGP shares pro forma 2. Calculated as DCF / total distribution 20 StandalonePro Forma 39.7% 33.5% 30.7% 28.9%28.9% 1.28x 1.32x 1.17x 1.11x 1.05x 2018E 2019E2020E2021E2022E Standalone Pro Forma ImpliedDPUDPU YieldCAGRCAGR 2018E6.5% 5.8% 2019E8.4% 28.9% 8.1% 39.7% 2020E10.9% 28.9% 11.1% 38.2% 2021E13.0% 25.9% 13.8% 33.5% 2022E15.6% 24.3% 17.0% 30.7% Total Coverage Held Constant (2) DPU CAGR vs. 2018 Distributable Cash Flow / Unit (1) ($ / Unit) (5.2%) Accretion / (Dilution) 1.7% 4.8% 7.7% 9.4% $4.70 $4.04 $4.29 $3.40 $3.75 $2.80$3.24 $2.76 $3.94 $3.13 $2.31 $2.06 $1.95 Distribution / Unit (1) ($ / Unit) (11.0%) Accretion / (Dilution) (3.5%)2.3%6.2%8.8% $4.46 $3.63 $4.10 $2.92 $3.42 $2.21$2.85 $2.13 $3.69 $2.88 $2.06 $1.72 $1.53 AMGP ACQUISITION OF AM
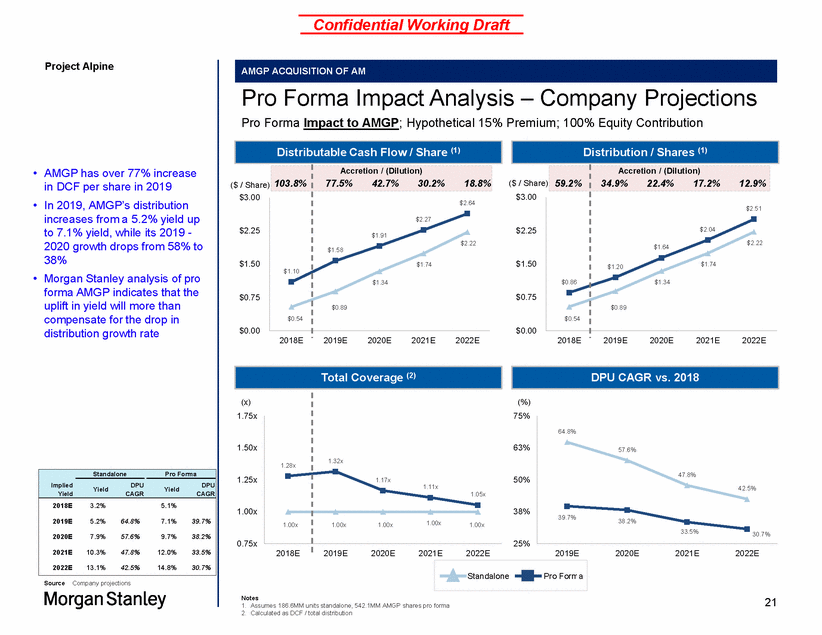
Confidential Working Draft Project Alpine Pro Forma Impact Analysis – Company Projections Pro Forma Impact to AMGP; Hypothetical 15% Premium; 100% Equity Contribution • AMGP has over 77% increase in DCF per share in 2019 In 2019, AMGP’s distribution increases from a 5.2% yield up to 7.1% yield, while its 2019 - 2020 growth drops from 58% to 38% Morgan Stanley analysis of pro forma AMGP indicates that the uplift in yield will more than compensate for the drop in distribution growth rate ($ / Share) 103.8% 18.8% ( $3.00 • • $0.00 $0.00 2018E2019E 2020E 2021E 2022E 2018E2019E 2020E 2021E 2022E (x) 1.75x (%) 75% 1.50x 63% 1.25x 50% 1.00x 38% .00x 0.75x 25% 2019E 2020E 2021E 2022E Source Company projections Notes 1. Assumes 186.6MM units standalone, 542.1MM AMGP shares pro forma 2. Calculated as DCF / total distribution 21 StandalonePro Forma 64.8% 57.6% 47.8% 42.5% 39.7%38.2% 33.5%30.7% 1.2 1 8x 1.32x 1.17x 1.11x 1.0 5x 0x 1.00x1.00x1.00x1.0 2018E 2019E2020E2021E2022E Standalone Pro Forma Implied Yield DPU Yield DPU Yield CAGR CAGR 2018E 3.2% 5.1% 2019E 5.2% 64.8% 7.1% 39.7% 2020E 7.9% 57.6% 9.7% 38.2% 2021E 10.3% 47.8% 12.0% 33.5% 2022E 13.1% 42.5% 14.8% 30.7% Total Coverage (2) DPU CAGR vs. 2018 Distributable Cash Flow / Share (1) Accretion / (Dilution) 77.5% 42.7% 30.2% $3.00 $2.25 $1.50 $0.75 $1.10 $0.54 $2.64 $2.27 $1.91 $2.22 $1.58 $1.74 $1.34 $0.89 Distribution / Shares (1) $ / Share) 59.2% Accretion / (Dilution) 34.9% 22.4% 17.2% 12.9% $2.51 $2.04 $2.22 $1.64 $1.20$1.74 $1.34 $0.89 $2.25 $1.50 $0.75 $0.86 $0.54 AMGP ACQUISITION OF AM
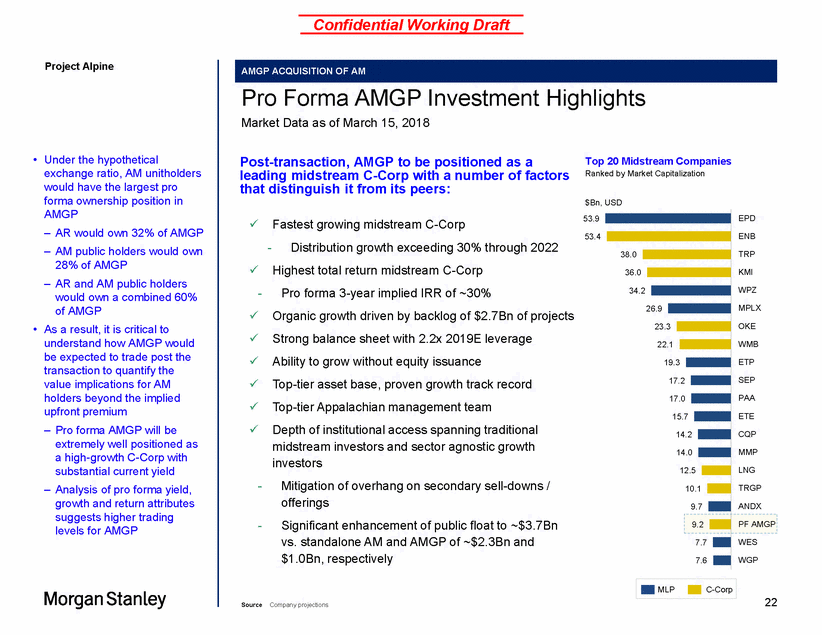
Confidential Working Draft Project Alpine Pro Forma AMGP Investment Highlights Market Data as of March 15, 2018 • Under the hypothetical exchange ratio, AM unitholders would have the largest pro forma ownership position in AMGP – AR would own 32% of AMGP – AM public holders would own 28% of AMGP – AR and AM public holders would own a combined 60% of AMGP As a result, it is critical to understand how AMGP would be expected to trade post the transaction to quantify the value implications for AM holders beyond the implied upfront premium – Pro forma AMGP will be extremely well positioned as a high-growth C-Corp with substantial current yield – Analysis of pro forma yield, growth and return attributes suggests higher trading levels for AMGP Post-transaction, AMGP to be positioned as a leading midstream C-Corp with a number of factors that distinguish it from its peers: Top 20 Midstream Companies Ranked by Market Capitalization $Bn, USD EPD 53.9 Fastest growing midstream C-Corp Distribution growth exceeding 30% through 2022 Highest total return midstream C-Corp Pro forma 3-year implied IRR of ~30% Organic growth driven by backlog of $2.7Bn of projects Strong balance sheet with 2.2x 2019E leverage Ability to grow without equity issuance Top-tier asset base, proven growth track record Top-tier Appalachian management team Depth of institutional access spanning traditional midstream investors and sector agnostic growth investors Mitigation of overhang on secondary sell-downs / offerings Significant enhancement of public float to ~$3.7Bn vs. standalone AM and AMGP of ~$2.3Bn and $1.0Bn, respectively 53.4 ENB - TRP KMI WPZ MPLX OKE • WMB ETP SEP PAA ETE CQP MMP LNG - TRGP ANDX - 22 Source Company projections MLPC-Corp 38.0 36.0 34.2 26.9 23.3 22.1 19.3 17.2 17.0 15.7 14.2 14.0 12.5 10.1 9.7 9.2PF AMGP WES WGP 7.7 7.6 AMGP ACQUISITION OF AM
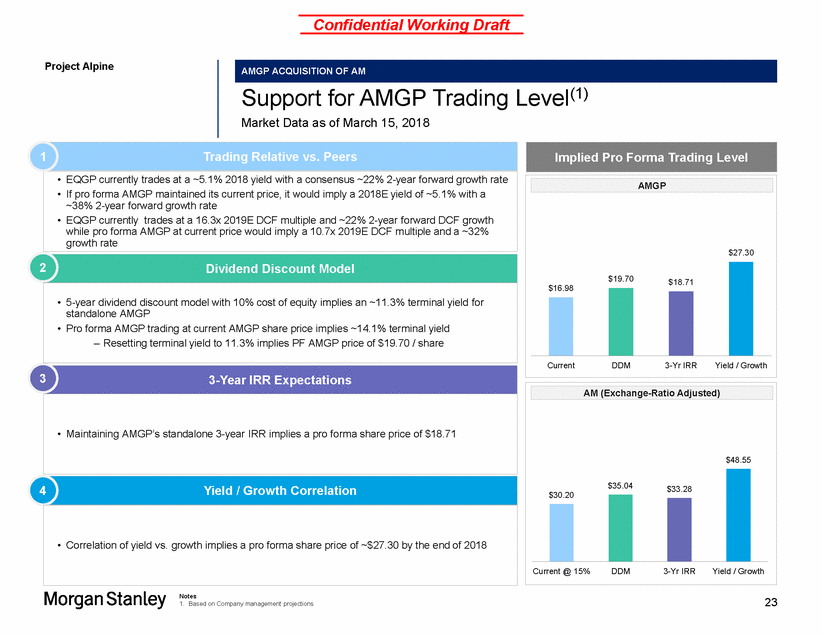
Confidential Working Draft Project Alpine Level(1) Support for AMGP Trading Market Data as of March 15, 2018 1 Trading Relative vs. Peers 2 Dividend Discount Model 3 3-Year IRR Expectations 4 Yield / Growth Correlation Notes 1. Based on Company management projections 23 $48.55 Current @ 15%DDM3-Yr IRRYield / Growth $35.04$33.28 $30.20 AM (Exchange-Ratio Adjusted) Implied Pro Forma Trading Level $27.30 $16.98 CurrentDDM3-Yr IRRYield / Growth $19.70$18.71 AMGP • EQGP currently trades at a ~5.1% 2018 yield with a consensus ~22% 2-year forward growth rate • If pro forma AMGP maintained its current price, it would imply a 2018E yield of ~5.1% with a ~38% 2-year forward growth rate • EQGP currently trades at a 16.3x 2019E DCF multiple and ~22% 2-year forward DCF growth while pro forma AMGP at current price would imply a 10.7x 2019E DCF multiple and a ~32% growth rate • 5-year dividend discount model with 10% cost of equity implies an ~11.3% terminal yield for standalone AMGP • Pro forma AMGP trading at current AMGP share price implies ~14.1% terminal yield – Resetting terminal yield to 11.3% implies PF AMGP price of $19.70 / share • Maintaining AMGP’s standalone 3-year IRR implies a pro forma share price of $18.71 • Correlation of yield vs. growth implies a pro forma share price of ~$27.30 by the end of 2018 AMGP ACQUISITION OF AM
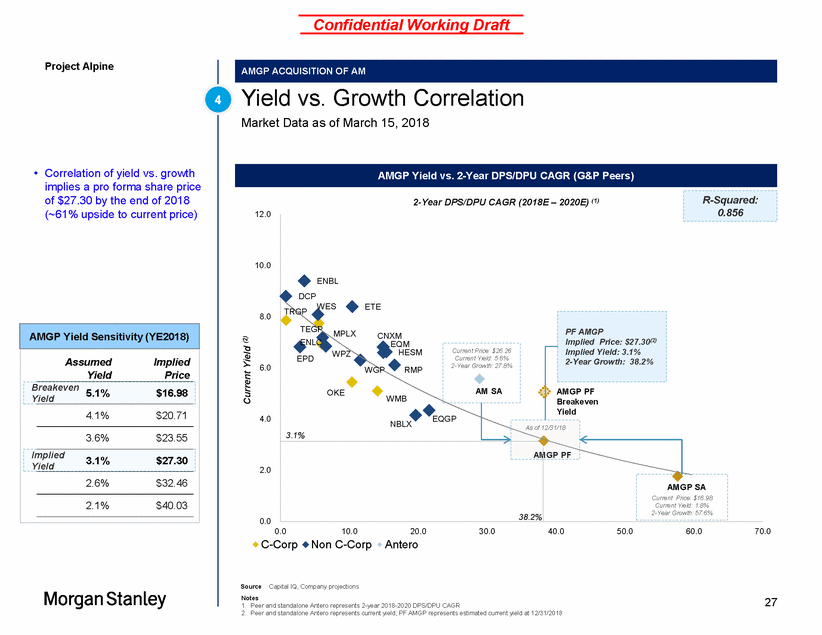
Confidential Working Draft Project Alpine Peer Trading Metrics Market Data as of March 15, 2018 1 SA PF Commentary • Pro forma AMGP would be projected to have higher growth with a similar yield as EQGP Pro forma DCF and EBITDA multiples projected to be attractive for new AMGP Pro forma AMGP projected to have minimal debt / 2019E EBITDA leverage compared to peers: – PF AMGP: 2.2x – Targa: 3.3x – ONEOK: 3.7x – EQGP: NM(1) • • supports premium valuation relative to peers Source Capital IQ, Company projections for AM & AMGP Notes 1. EQGP has no outstanding debt 24 Yield & Growth Metrics 2018E Yield 5.1% 5.6% 7.9% 3.2% 5.1% Significant coverage paired with high growth 2018E Cash Coverage Ratio 1.0x 1.2x 1.0x 1.0x 1.3x DPU Growth (18E-20E CAGR) 21.6% 10.4% 0.8% 57.6% 38.2% EBITDA Growth (18E-20E CAGR) 22.3% -4.6% 13.2% 85.9% 29.4% Equity Value / 2019E DCF 16.3x 12.6x 11.8x 19.6x 10.7x PF AMGP's peer-leading DCF growth for suggests potential for upward share price rerating post-transaction 2020E DCF 13.4x 11.1x 10.1x 13.1x 8.9x DCF Growth (18E - 20E) 22.3% 12.5% 12.2% 55.9% 31.9% Aggregate Value / 2019E EBITDA 16.3x 12.5x 11.5x 25.0x 10.9x PF AMGP's high growth results in forward multiples that are in-line or lower than peers, assuming current AMGP standalone share price 2020E EBITDA 13.4x 15.1x 10.1x 15.1x 8.9x Trading Summary Equity Value 5,989 23,258 10,143 3,162 9,205 PF AMGP becomes more in-line with C-Corp peers with minimal leverage Aggregate Value 5,989 31,482 16,619 3,156 10,827 AMGP ACQUISITION OF AM
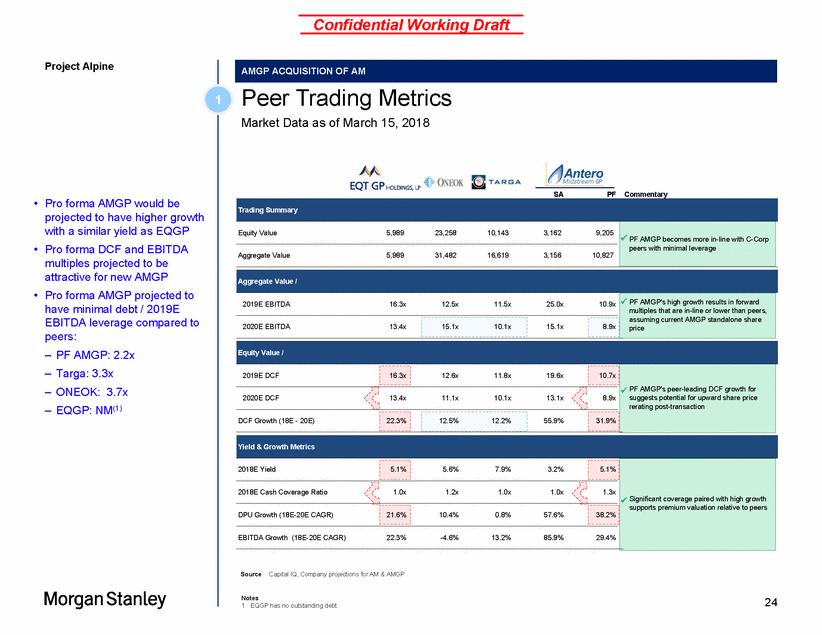
Confidential Working Draft Project Alpine Dividend Discount Method Market Data as of March 15, 2018 – AMGP Buys AM 2 • Utilizing a 10% cost of equity and Wall Street research, the current share price implies a ~11.3% terminal yield after 2022 – Holding AMGP’s current terminal yield constant would imply a pro forma share price of $19.70 (~16% upside to current price) Pro forma for the transaction, AMGP would need a ~14.1% terminal yield to hold the current share price • 25 Source Capital IQ, Company Materials 20182019202020212022 Terminal Interest Expense(63)(90)(118)(136)(149) Cash Taxes ---- - Series B Payment ---- - Maint. Capex & Other(71)(43)(67) (48)(62) Coverage13020514812372 Period1.002.003.004.005.005.00 PV @ 10.0% Cost of Equity4235376687568445,977 Terminal Value Implied Terminal Yield 14.1% Undiscounted Terminal Value9,625 Total PV @ 10.0% Cost of Equity9,205 Current Share Price$16.98 Present Value AMGP Distributions465650889 1,107 1,360 Cash Flow Available596855 1,037 1,230 1,431 PF AMGP Distributions EBITDA730989 1,222 1,413 1,642 20182019202020212022 Terminal Interest Expense ---- - Cash Taxes(34)(56)(85)(110)(140) Series B Payment (7)(12)(20) (26)(34) Maint. Capex & Other ---- - Coverage-----Period1.002.003.004.005.005.00 PV @ 10.0% Cost of Equity911371872222572,268 Terminal Value Implied Terminal Yield 11.3% Undiscounted Terminal Value3,652 Total PV @ 10.0% Cost of Equity3,162 Current Share Price$16.98 Present Value AMGP Distributions100165249324414 Cash Flow Available100165249324414 Standalone AMGP Distributions EBITDA141234353460587 Pro Forma AMGP Standalone AMGP AMGP ACQUISITION OF AM
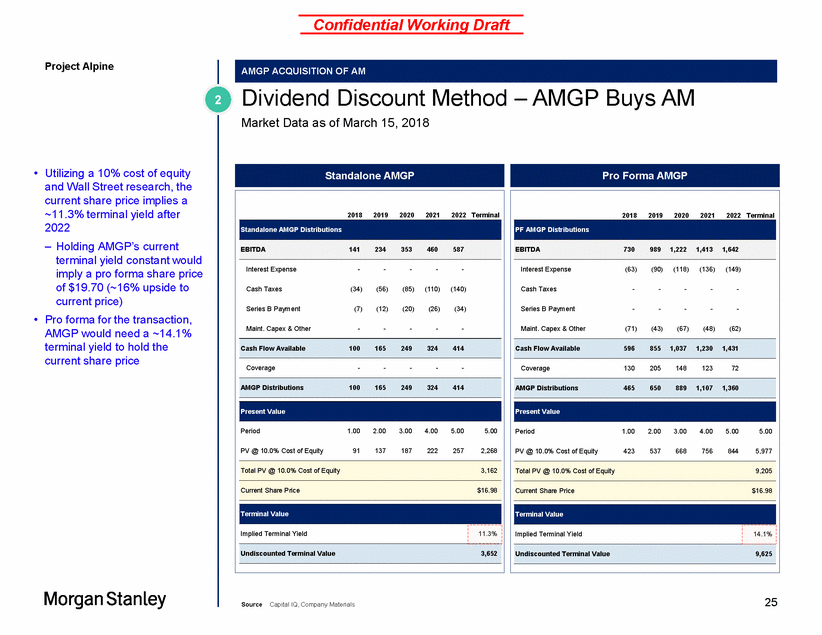
Confidential Working Draft Project Alpine IRR Method Analysis Market Data as of March 15, 2018 3 • Current implied 3-year IRR for standalone AMGP is ~29.9% – Maintaining the same AMGP IRR implies a pro forma share price of $18.71 (~10% upside to current price) 2018E Yield (%) Growth CAGR (%) Exit Growth (%) Predicted Exit Yield (%) 3 Year IRR Equity Value Price ($) Distributions per Share ($ / Share) WGP 7,628 $34.84 6.8% $2.36 $2.60 $2.94 11.6% 5.4% 7.4% 12.2% EQGP 5,989 $22.50 5.1% $1.15 $1.47 $1.70 21.6% 9.0% 6.7% 10.4% TEGP 3,509 $18.99 10.1% $1.91 $1.95 $2.13 5.6% 1.2% 8.2% 21.3% ENLC 2,704 $14.95 7.2% $1.08 $1.14 $1.21 6.0% 16.4% 5.5% 20.9% WES 7,672 $45.55 8.4% $3.83 $4.07 $4.26 5.5% 4.7% 7.5% 16.5% EQM 4,853 $60.22 7.4% $4.43 $5.09 $5.85 14.9% 7.3% 7.0% 19.7% NBLX 1,691 $47.05 4.6% $2.18 $2.61 $3.12 19.6% 19.8% 5.1% 14.8% CNXM 1,209 $19.01 7.2% $1.37 $1.58 $1.81 14.9% 7.5% 7.0% 19.0% HESM 1,061 $19.44 7.3% $1.42 $1.64 $1.89 15.4% 12.0% 6.2% 24.1% 26 Source Capital IQ, Company Materials Peer Mean 12.8% 9.2% 6.7% 17.6% Peer Median 14.9% 7.5% 7.0% 19.0% MLP Peers 2018E 2019E 2020E 2018 - 2020 2020 - 2022 Antero 2018E 2019E 2020E 2018 - 2020 2020 - 2022 AMGP SA 3,162 $16.98 3.2% $0.54 $0.89 $1.34 57.6% 28.8% 4.0% AMGP PF 10,144 4.6% $0.86 $1.20 $1.64 38.2% 23.7% 4.6% 29.9% 29.9% AM 4,909 $26.26 6.5% $1.71 $2.21 $2.80 27.8% 20.7% 5.0% 36.6% GP Peers 2018E 2019E 2020E 2018 - 2020 2020 - 2022 $18.71 3-Year IRR AMGP ACQUISITION OF AM
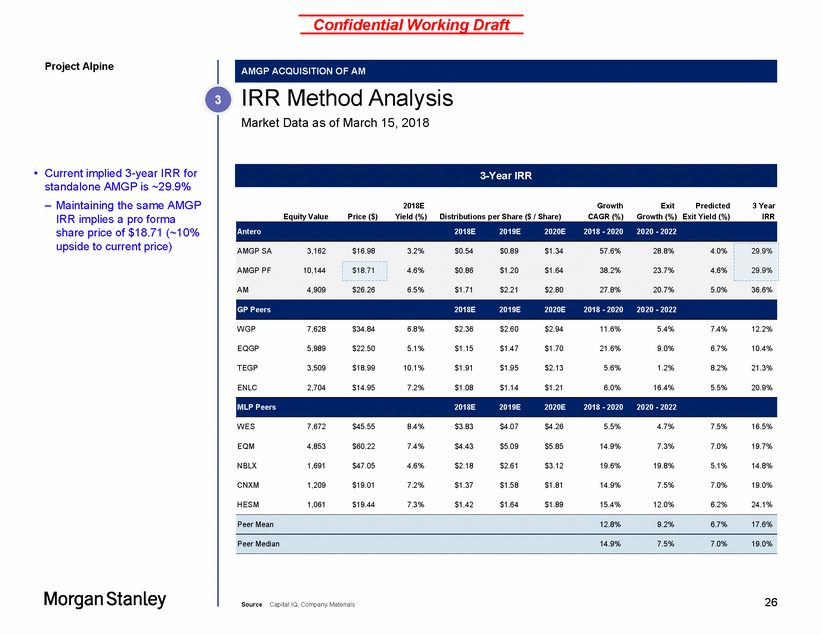
Confidential Working Draft Project Alpine Yield vs. Growth Correlation Market Data as of March 15, 2018 4 • Correlation of yield vs. growth implies a pro forma share price of $27.30 by the end of 2018 (~61% upside to current price) 2-Year DPS/DPU CAGR (2018E – 2020E) (1) 12.0 10.0 WES ETE TRGP 8.0 6.0 4.0 EQGP NBLX MGP PF 2.0 0.0 0.0 C-Corp 10.0 Non C-Corp 20.0 Antero 30.0 40.0 50.0 60.0 70.0 Source Capital IQ, Company projections Notes 1. Peer and standalone Antero represents 2-year 2018-2020 DPS/DPU CAGR 2. Peer and standalone Antero represents current yield; PF AMGP represents estimated current yield at 12/31/2018 27 Current Yield (2) AMGP Yield Sensitivity (YE2018) AssumedImplied YieldPrice Yield 4.1%$20.71 3.6%$23.55 2.6%$32.46 2.1%$40.03 Implied3.1%$27.30 Yield Breakeven 5.1%$16.98 ENBL DCP TEGP MPLXCNXM ENLCEQM PF AMGP Implied Price: $27.30(2) Implied Yield: 3.1% 2-Year Growth: 38.2% EPDWPZHESM WGPRMP OKE WMB AMGP PF Breakeven Yield 3.1% As of 12/31/18 A 38.2% AMGP SA Current Price: $16.98 Current Yield: 1.8% 2-Year Growth: 57.6% Current Price: $26.26 Current Yield: 5.6% 2-Year Growth: 27.8% AM SA R-Squared: 0.856 AMGP Yield vs. 2-Year DPS/DPU CAGR (G&P Peers) AMGP ACQUISITION OF AM
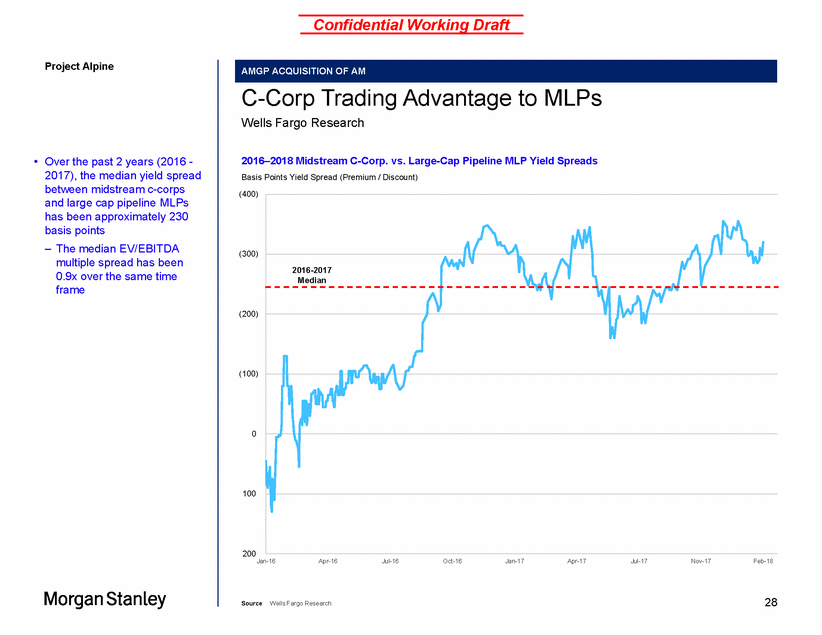
Confidential Working Draft Project Alpine C-Corp Trading Advantage to MLPs Wells Fargo Research 2016–2018 Midstream C-Corp. vs. Large-Cap Pipeline MLP Yield Spreads Basis Points Yield Spread (Premium / Discount) • Over the past 2 years (2016 - 2017), the median yield spread between midstream c-corps and large cap pipeline MLPs has been approximately 230 basis points – The median EV/EBITDA multiple spread has been 0.9x over the same time frame (400) (300) (200) (100) 0 100 200 Jan-16 Apr-16 Jul-16 Oct-16 Jan-17 Apr-17 Jul-17 Nov-17 Feb-18 28 Source Wells Fargo Research 2016-2017 Median AMGP ACQUISITION OF AM
Confidential Working Draft Project Alpine Appendix A AMGP Acquisition of AM – Street Case 29
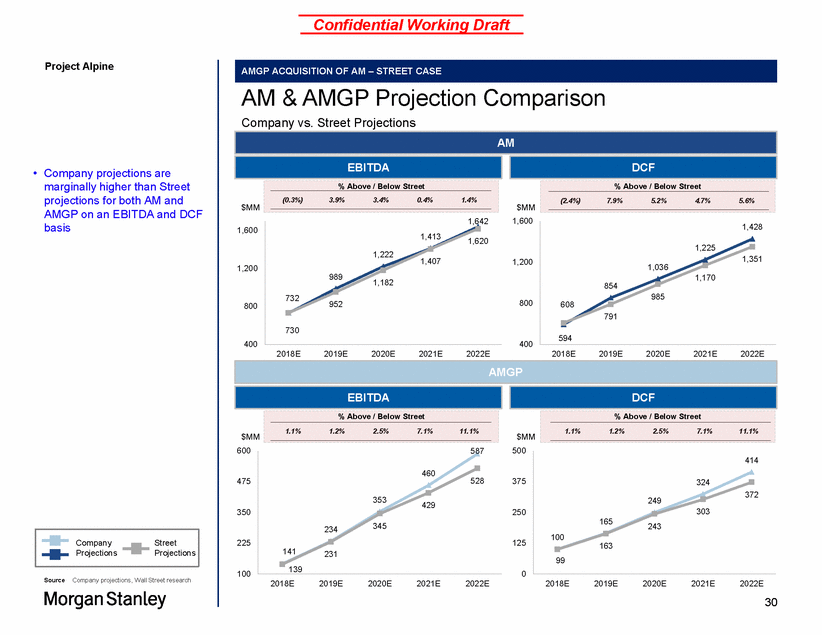
Confidential Working Draft Project Alpine AM & AMGP Projection Comparison Company vs. Street Projections • Company projections are marginally higher than Street projections for both AM and AMGP on an EBITDA and DCF basis 1,600 1,642 1,600 1,200 1,200 1,182 800 800 400 400 2018E 2019E 2020E 2021E 2022E 2018E 2019E 2020E 2021E 2022E 600 587 500 475 375 350 250 225 125 100 0 Source Company projections, Wall Street research 2018E 2019E 2020E 2021E 2022E 2018E 2019E 2020E 2021E 2022E 30 460 528 353429 234345 141231 139 414 324 372 249 303 165243 100 163 99 CompanyStreet ProjectionsProjections AMGP EBITDA $MM % Above / Below Street 1.1% 1.2% 2.5% 7.1% 11.1% DCF $MM % Above / Below Street 1.1% 1.2% 2.5% 7.1% 11.1% 1,4131,620 1,2221,407 989 732 952 730 1,428 1,225 1,351 1,036 1,170 854 985 608 791 594 AM EBITDA DCF $MM % Above / Below Street (0.3%) 3.9% 3.4% 0.4% 1.4% $MM % Above / Below Street (2.4%) 7.9% 5.2% 4.7% 5.6% AMGP ACQUISITION OF AM – STREET CASE
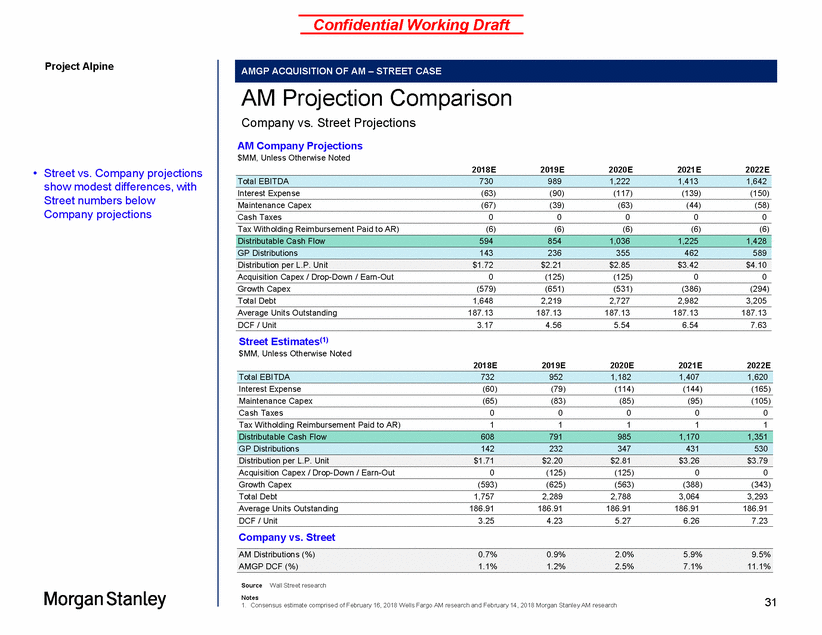
Confidential Working Draft Project Alpine AM Projection Comparison Company vs. Street Projections AM Company Projections $MM, Unless Otherwise Noted 2018E 2019E 2020E 2021E 2022E • Street vs. Company projections show modest differences, with Street numbers below Company projections Interest Expense (63) (90) (117) (139) (150) Maintenance Capex (67) (39) (63) (44) (58) Cash Taxes 0 0 0 0 0 Tax Witholding Reimbursement Paid to AR) (6) (6) (6) (6) (6) Acquisition Capex / Drop-Down / Earn-Out 0 (125) (125) 0 0 Growth Capex (579) (651) (531) (386) (294) Total Debt 1,648 2,219 2,727 2,982 3,205 Average Units Outstanding 187.13 187.13 187.13 187.13 187.13 DCF / Unit 3.17 4.56 5.54 6.54 7.63 Street Estimates(1) $MM, Unless Otherwise Noted 2018E 2019E 2020E 2021E 2022E Interest Expense (60) (79) (114) (144) (165) Maintenance Capex (65) (83) (85) (95) (105) Cash Taxes 0 0 0 0 0 Tax Witholding Reimbursement Paid to AR) 1 1 1 1 1 Acquisition Capex / Drop-Down / Earn-Out 0 (125) (125) 0 0 Growth Capex (593) (625) (563) (388) (343) Total Debt 1,757 2,289 2,788 3,064 3,293 Average Units Outstanding 186.91 186.91 186.91 186.91 186.91 DCF / Unit 3.25 4.23 5.27 6.26 7.23 Company vs. Street Source Wall Street research Notes 1. Consensus estimate comprised of February 16, 2018 Wells Fargo AM research and February 14, 2018 Morgan Stanley AM research 31 AM Distributions (%)0.7%0.9%2.0%5.9% 9.5% AMGP DCF (%)1.1%1.2%2.5%7.1%11.1% Distributable Cash Flow6087919851,1701,351 GP Distributions142232347431530 Distribution per L.P. Unit$1.71$2.20$2.81$3.26$3.79 Total EBITDA7329521,1821,4071,620 Distributable Cash Flow5948541,0361,2251,428 GP Distributions143236355462589 Distribution per L.P. Unit$1.72$2.21$2.85$3.42$4.10 Total EBITDA7309891,2221,4131,642 AMGP ACQUISITION OF AM – STREET CASE
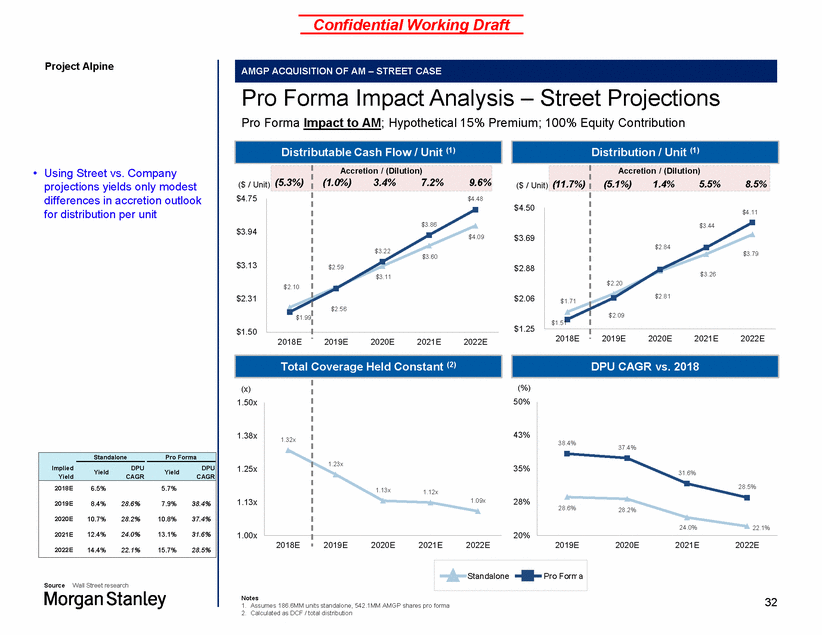
Confidential Working Draft Project Alpine Pro Forma Impact Analysis – Street Projections Pro Forma Impact to AM; Hypothetical 15% Premium; 100% Equity Contribution • Using Street vs. Company projections yields only modest differences in accretion outlook for distribution per unit $4.75 $1.25 $1.50 2018E2019E 2020E 2021E 2022E 2018E2019E 2020E 2021E 2022E (%) 50% 1.50x 43% 37.4% 35% CAGR CAGR 28% 1.00x 20% 2018E2019E 2020E 2021E 2022E 2019E 2020E 2021E 2022E Source Wall Street research Notes 1. Assumes 186.6MM units standalone, 542.1MM AMGP shares pro forma 2. Calculated as DCF / total distribution 32 StandalonePro Forma 38.4% 31.6% 28.5% 28.6%28.2% 24.0%22.1% Implied Yield StandalonePro Forma YieldDPUYieldDPU 2018E6.5% 5.7% 2019E8.4% 28.6% 7.9% 38.4% 2020E10.7% 28.2% 10.8% 37.4% 2021E12.4% 24.0% 13.1% 31.6% 2022E14.4% 22.1% 15.7% 28.5% Total Coverage Held Constant (2) (x) 1.23x 1.13x1.12x 1.09x 1.38x 1.25x 1.13x 1.32x DPU CAGR vs. 2018 Distributable Cash Flow / Unit (1) ($ / Unit) (5.3%) Accretion / (Dilution) (1.0%) 3.4% 7.2% 9.6% $4.48 $3.86 $4.09 $3.22$3.60 $2.59 $3.11 $2.56 $3.94 $3.13 $2.31 $2.10 $1.99 Distribution / Unit (1) ($ / Unit) (11.7%) Accretion / (Dilution) (5.1%) 1.4% 5.5% 8.5% $4.11 $3.44 $2.84 $3.79 $3.26 $2.20 $2.81 $2.09 $4.50 $3.69 $2.88 $2.06 $1.71 $1.51 AMGP ACQUISITION OF AM – STREET CASE
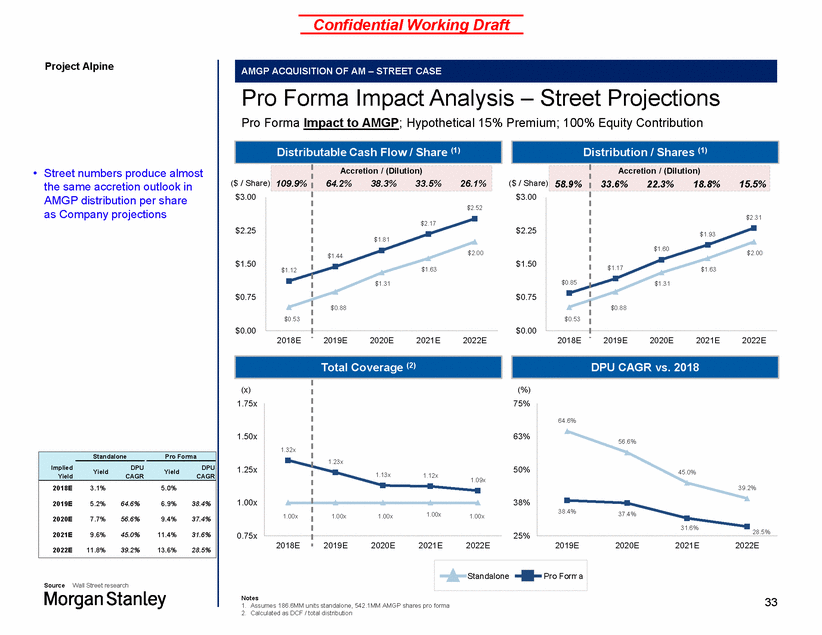
Confidential Working Draft Project Alpine Pro Forma Impact Analysis – Street Projections Pro Forma Impact to AMGP; Hypothetical 15% Premium; 100% Equity Contribution • Street numbers produce almost the same accretion outlook in AMGP distribution per share as Company projections ( ( $1.44 $0.00 $0.00 2018E2019E 2020E 2021E 2022E 2018E2019E 2020E 2021E 2022E (%) 75% 1.75x 63% 2x 50% Yield Yield CAGR CAGR 38% .00x 0.75x 25% 2018E2019E 2020E 2021E 2022E 2019E 2020E 2021E 2022E Source Wall Street research Notes 1. Assumes 186.6MM units standalone, 542.1MM AMGP shares pro forma 2. Calculated as DCF / total distribution 33 StandalonePro Forma 64.6% 56.6% 45.0% 39.2% 38.4%37.4% 31.6%28.5% Implied Yield Standalone Pro Forma DPU DPU 2018E 3.1% 5.0% 2019E 5.2% 64.6% 6.9% 38.4% 2020E 7.7% 56.6% 9.4% 37.4% 2021E 9.6% 45.0% 11.4% 31.6% 2022E 11.8% 39.2% 13.6% 28.5% Total Coverage (2) (x) 1.23x 1.13x1.12x 1.0 9x 0x 1.50x 1.25x 1.00x 1.3 1 1.00x1.00x1.00x1.0 DPU CAGR vs. 2018 Distributable Cash Flow / Share (1) $ / Share) 109.9% Accretion / (Dilution) 64.2%38.3%33.5%26.1% $2.52 $2.17 $1.81 $2.00 $1.63 $1.31 $0.88 $3.00 $2.25 $1.50 $0.75 $1.12 $0.53 Distribution / Shares (1) $ / Share) 58.9% Accretion / (Dilution) 33.6% 22.3% 18.8% 15.5% $2.31 $1.93 $1.60$2.00 $1.17$1.63 $1.31 $0.88 $3.00 $2.25 $1.50 $0.75 $0.85 $0.53 AMGP ACQUISITION OF AM – STREET CASE
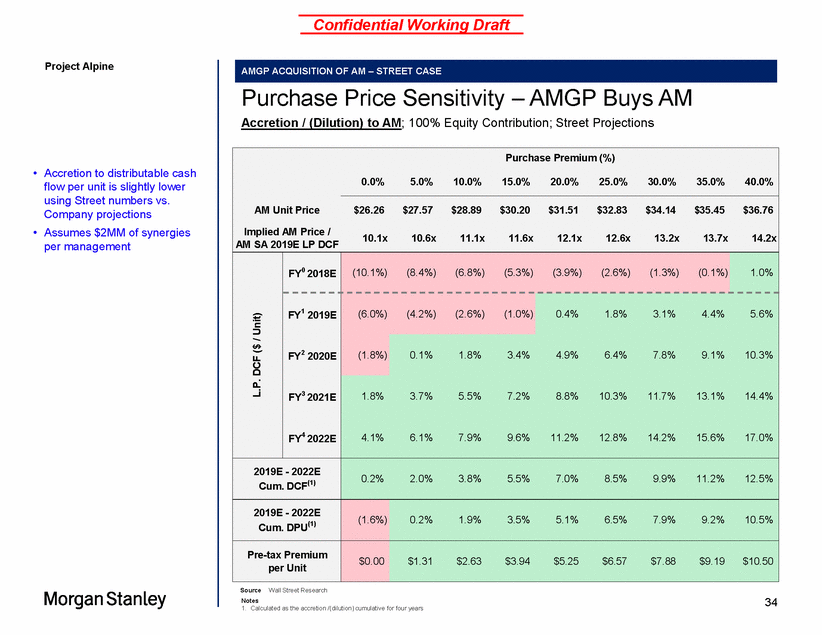
Confidential Working Draft Project Alpine Purchase Price Sensitivity – AMGP Buys AM Accretion / (Dilution) to AM; 100% Equity Contribution; Street Projections • Accretion to distributable cash flow per unit is slightly lower using Street numbers vs. Company projections Assumes $2MM of synergies per management • Source Wall Street Research Notes 1. Calculated as the accretion /(dilution) cumulative for four years 34 Purchase Premium (%) 0.0% 5.0% 10.0% 15.0% 20.0% 25.0% 30.0% 35.0% 40.0% AM Unit Price $26.26 $27.57 $28.89 $30.20 $31.51 $32.83 $34.14 $35.45 $36.76 Implied AM Price / AM SA 2019E LP DCF 10.1x 10.6x 11.1x 11.6x 12.1x 12.6x 13.2x 13.7x 14.2x FY0 2018E (10.1%) (8.4%) (6.8%) (5.3%) (3.9%) (2.6%) (1.3%) (0.1%) 1.0% Unit) FY1 2019E (6.0%) (4.2%) (2.6%) (1.0%) 0.4% 1.8% 3.1% 4.4% 5.6% DCF ($ / FY2 2020E (1.8%) 0.1% 1.8% 3.4% 4.9% 6.4% 7.8% 9.1% 10.3% L.P. FY3 2021E FY4 2022E 1.8% 3.7% 5.5% 7.2% 8.8% 10.3% 11.7% 13.1% 14.4% 4.1% 6.1% 7.9% 9.6% 11.2% 12.8% 14.2% 15.6% 17.0% 2019E - 2022E Cum. DCF(1) 0.2% 2.0% 3.8% 5.5% 7.0% 8.5% 9.9% 11.2% 12.5% 2019E - 2022E Cum. DPU(1) (1.6%) 0.2% 1.9% 3.5% 5.1% 6.5% 7.9% 9.2% 10.5% Pre-tax Premium per Unit $0.00 $1.31 $2.63 $3.94 $5.25 $6.57 $7.88 $9.19 $10.50 AMGP ACQUISITION OF AM – STREET CASE
Confidential Working Draft Project Alpine Appendix B Supporting Materials 35
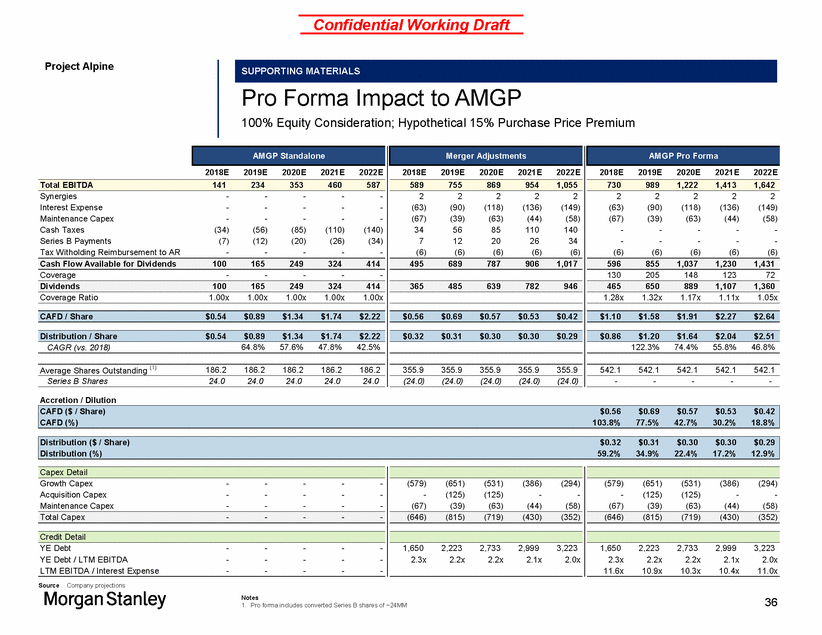
Confidential Working Draft Project Alpine Pro Forma Impact to AMGP 100% Equity Consideration; Hypothetical 15% Purchase Price Premium 2018E 2019E 2020E 2021E 2022E 2018E 2019E 2020E 2021E 2022E 2018E 2019E 2020E 2021E 2022E Synergies Interest Expense Maintenance Capex Cash Taxes Series B Payments Tax Witholding Reimbursement to AR - - - (34) (7) - - - - (56) (12) - - - - (85) (20) - - - - (110) (26) - - - - (140) (34) - 2 (63) (67) 34 7 (6) 2 (90) (39) 56 12 (6) 2 (118) (63) 85 20 (6) 2 (136) (44) 110 26 (6) 2 (149) (58) 140 34 (6) 2 (63) (67) - - (6) 2 (90) (39) - - (6) 2 (118) (63) - - (6) 2 (136) (44) - - (6) 2 (149) (58) - - (6) Coverage - - - - - 130 205 148 123 72 Coverage Ratio 1.00x 1.00x 1.00x 1.00x 1.00x 1.28x 1.32x 1.17x 1.11x 1.05x CAGR (vs. 2018) 64.8% 57.6% 47.8% 42.5% 122.3% 74.4% 55.8% 46.8% Average Shares Outstanding (1) 186.2 186.2 186.2 186.2 186.2 355.9 355.9 355.9 355.9 355.9 542.1 542.1 542.1 542.1 542.1 Series B Shares 24.0 24.0 24.0 24.0 24.0 (24.0) (24.0) (24.0) (24.0) (24.0) - - - - - Accretion / Dilution Growth Capex Acquisition Capex Maintenance Capex - - - - - - - - - - - - - - - (579) - (67) (651) (125) (39) (531) (125) (63) (386) - (44) (294) - (58) (579) - (67) (651) (125) (39) (531) (125) (63) (386) - (44) (294) - (58) YE Debt YE Debt / LTM EBITDA LTM EBITDA / Interest Expense - - - - - - - - - - - - - - - 1,650 2.3x 2,223 2.2x 2,733 2.2x 2,999 2.1x 3,223 2.0x 1,650 2.3x 11.6x 2,223 2.2x 10.9x 2,733 2.2x 10.3x 2,999 2.1x 10.4x 3,223 2.0x 11.0x Source Company projections Notes 1. Pro forma includes converted Series B shares of ~24MM 36 Credit Detail (646)(815)(719)(430)(352) (646)(815)(719)(430)(352) Total Capex-----Capex Detail Distribution ($ / Share)$0.32$0.31$0.30$0.30$0.29 Distribution (%)59.2%34.9%22.4%17.2%12.9% CAFD ($ / Share)$0.56$0.69$0.57$0.53$0.42 CAFD (%)103.8%77.5%42.7%30.2%18.8% $0.86$1.20$1.64$2.04$2.51 $0.32$0.31$0.30$0.30$0.29 Distribution / Share$0.54$0.89$1.34$1.74$2.22 $1.10$1.58$1.91$2.27$2.64 $0.56$0.69$0.57$0.53$0.42 CAFD / Share$0.54$0.89$1.34$1.74$2.22 4656508891,1071,360 365485639782946 Dividends100165249324414 5968551,0371,2301,431 4956897879061,017 Cash Flow Available for Dividends100165249324414 7309891,2221,4131,642 5897558699541,055 Total EBITDA141234353460587 AMGP Pro Forma Merger Adjustments AMGP Standalone SUPPORTING MATERIALS
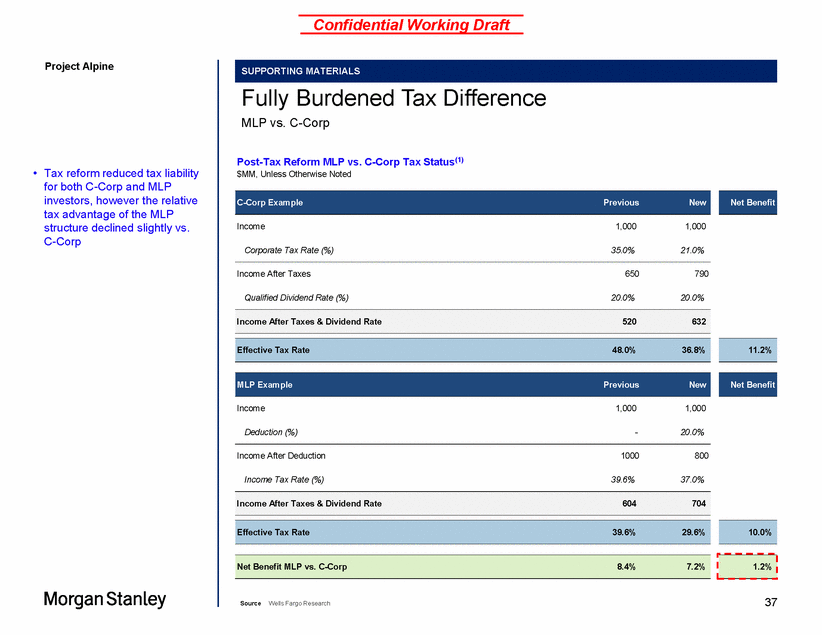
Confidential Working Draft Project Alpine Fully Burdened Tax Difference MLP vs. C-Corp Post-Tax Reform MLP vs. C-Corp Tax Status(1) $MM, Unless Otherwise Noted • Tax reform reduced tax liability for both C-Corp and MLP investors, however the relative tax advantage of the MLP structure declined slightly vs. C-Corp Income 1,000 1,000 Corporate Tax Rate (%) 35.0% 21.0% Income After Taxes 650 790 Qualified Dividend Rate (%) 20.0% 20.0% Income 1,000 1,000 Deduction (%) - 20.0% Income After Deduction 1000 800 Income Tax Rate (%) 39.6% 37.0% 37 Source Wells Fargo Research 1.2% Net Benefit MLP vs. C-Corp 8.4% 7.2% 10.0% Effective Tax Rate 39.6% 29.6% Income After Taxes & Dividend Rate 604 704 Net Benefit MLP Example Previous New 11.2% Effective Tax Rate 48.0% 36.8% Income After Taxes & Dividend Rate 520 632 Net Benefit C-Corp Example Previous New SUPPORTING MATERIALS
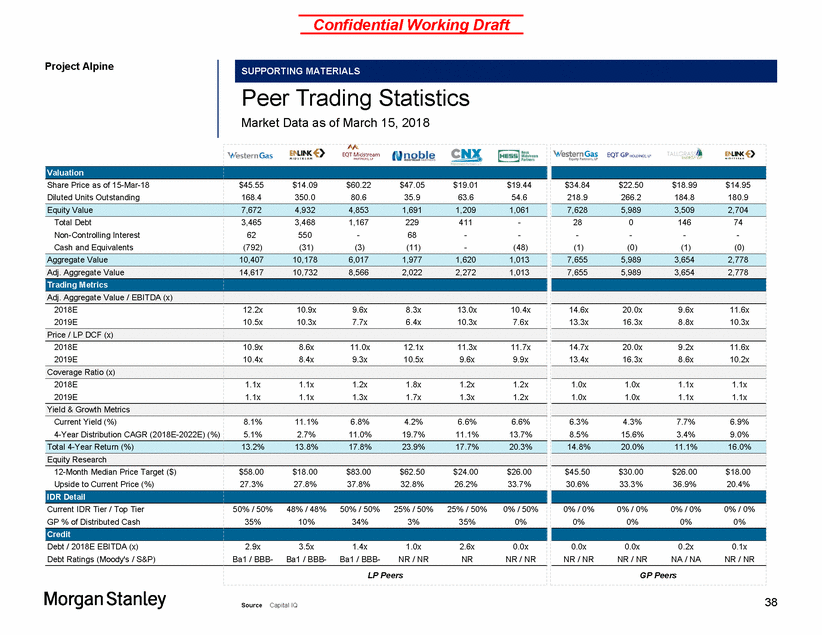
Confidential Working Draft Project Alpine Peer Trading Statistics Market Data as of March 15, 2018 38 Source Capital IQ Valuation Share Price as of 15-Mar-18 Diluted Units Outstanding $45.55 $14.09 $60.22 $47.05 $19.01 $19.44 168.4 350.0 80.6 35.9 63.6 54.6 $34.84 $22.50 $18.99 $14.95 218.9 266.2 184.8 180.9 Equity Value 7,672 4,932 4,853 1,691 1,209 1,061 7,628 5,989 3,509 2,704 Total Debt Non-Controlling Interest Cash and Equivalents 3,465 3,468 1,167 229 411 - 62 550 - 68 - - (792) (31) (3) (11) - (48) 28 0 146 74 - - - - (1) (0) (1) (0) Aggregate Value 10,407 10,178 6,017 1,977 1,620 1,013 7,655 5,989 3,654 2,778 Adj. Aggregate Value 14,617 10,732 8,566 2,022 2,272 1,013 7,655 5,989 3,654 2,778 Trading Metrics Adj. Aggregate Value / EBITDA (x) 2018E 2019E 12.2x 10.9x 9.6x 8.3x 13.0x 10.4x 10.5x 10.3x 7.7x 6.4x 10.3x 7.6x 14.6x 20.0x 9.6x 11.6x 13.3x 16.3x 8.8x 10.3x Price / LP DCF (x) 2018E 2019E 10.9x 8.6x 11.0x 12.1x 11.3x 11.7x 10.4x 8.4x 9.3x 10.5x 9.6x 9.9x 14.7x 20.0x 9.2x 11.6x 13.4x 16.3x 8.6x 10.2x Coverage Ratio (x) 2018E 2019E 1.1x 1.1x 1.2x 1.8x 1.2x 1.2x 1.1x 1.1x 1.3x 1.7x 1.3x 1.2x 1.0x 1.0x 1.1x 1.1x 1.0x 1.0x 1.1x 1.1x Yield & Growth Metrics Current Yield (%) 4-Year Distribution CAGR (2018E-2022E) (%) 8.1% 11.1% 6.8% 4.2% 6.6% 6.6% 5.1% 2.7% 11.0% 19.7% 11.1% 13.7% 6.3% 4.3% 7.7% 6.9% 8.5% 15.6% 3.4% 9.0% Total 4-Year Return (%) 13.2% 13.8% 17.8% 23.9% 17.7% 20.3% 14.8% 20.0% 11.1% 16.0% Equity Research 12-Month Median Price Target ($) Upside to Current Price (%) $58.00 $18.00 $83.00 $62.50 $24.00 $26.00 27.3% 27.8% 37.8% 32.8% 26.2% 33.7% $45.50 $30.00 $26.00 $18.00 30.6% 33.3% 36.9% 20.4% IDR Detail Current IDR Tier / Top Tier GP % of Distributed Cash 50% / 50% 48% / 48% 50% / 50% 25% / 50% 25% / 50% 0% / 50% 35% 10% 34% 3% 35% 0% 0% / 0% 0% / 0% 0% / 0% 0% / 0% 0% 0% 0% 0% Credit Debt / 2018E EBITDA (x) Debt Ratings (Moody's / S&P) 2.9x 3.5x 1.4x 1.0x 2.6x 0.0x Ba1 / BBB-Ba1 / BBB-Ba1 / BBB-NR / NR NR NR / NR 0.0x 0.0x 0.2x 0.1x NR / NR NR / NR NA / NA NR / NR LP Peers GP Peers SUPPORTING MATERIALS
Confidential Working Draft Project Alpine Appendix C Precedent Transactions 39
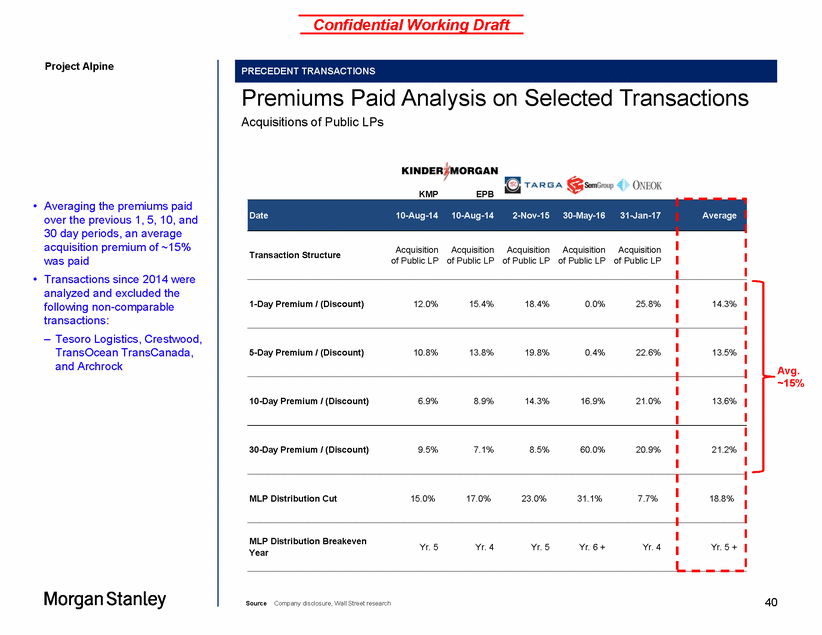
Confidential Working Draft Project Alpine Premiums Paid Acquisitions of Public LPs Analysis on Selected Transactions KMP EPB • Averaging the premiums paid over the previous 1, 5, 10, and 30 day periods, an average acquisition premium of ~15% was paid Transactions since 2014 were analyzed and excluded the following non-comparable transactions: – Tesoro Logistics, Crestwood, TransOcean TransCanada, and Archrock • Avg. ~15% 40 Source Company disclosure, Wall Street research Date10-Aug-1410-Aug-142-Nov-1530-May-1631-Jan-17 Average Transaction StructureAcquisitionAcquisitionAcquisitionAcquisitionAcquisition of Public LP of Public LP of Public LP of Public LP of Public LP 1-Day Premium / (Discount)12.0%15.4%18.4%0.0%25.8% 14.3% 5-Day Premium / (Discount)10.8%13.8%19.8%0.4%22.6% 13.5% 10-Day Premium / (Discount)6.9%8.9%14.3%16.9%21.0% 13.6% 30-Day Premium / (Discount)9.5%7.1%8.5%60.0%20.9% 21.2% MLP Distribution Cut15.0%17.0%23.0%31.1%7.7% 18.8% MLP Distribution Breakeven YearYr. 5Yr. 4Yr. 5Yr. 6 +Yr. 4 Yr. 5 + PRECEDENT TRANSACTIONS
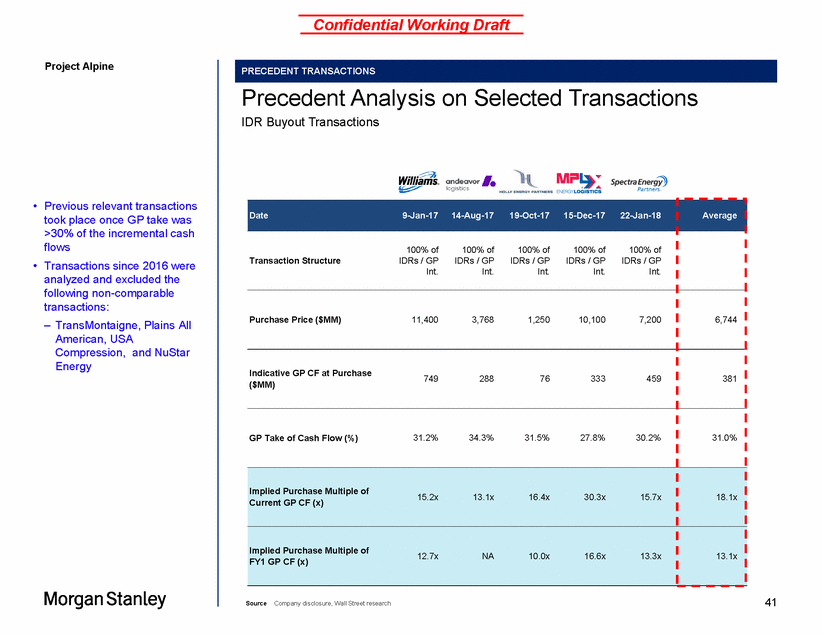
Confidential Working Draft Project Alpine Precedent Analysis IDR Buyout Transactions on Selected Transactions • Previous relevant transactions took place once GP take was >30% of the incremental cash flows Transactions since 2016 were analyzed and excluded the following non-comparable transactions: – TransMontaigne, Plains All American, USA • Compression, Energy and NuStar 41 Source Company disclosure, Wall Street research Date9-Jan-1714-Aug-1719-Oct-1715-Dec-1722-Jan-18 Average 100% of100% of 100% of100% of100% of Transaction StructureIDRs / GPIDRs / GPIDRs / GPIDRs / GPIDRs / GP Int.Int.Int.Int.Int. Purchase Price ($MM)11,4003,7681,25010,1007,200 6,744 Indicative GP CF at Purchase ($MM)74928876333459 381 GP Take of Cash Flow (%)31.2%34.3%31.5%27.8%30.2% 31.0% Implied Purchase Multiple of Current GP CF (x)15.2x13.1x16.4x30.3x15.7x 18.1x Implied Purchase Multiple of FY1 GP CF (x)12.7xNA10.0x16.6x13.3x 13.1x PRECEDENT TRANSACTIONS
Confidential Working Draft Project Alpine Disclaimer We have prepared this document solely for informational purposes. You should not definitively rely upon it or use it to form the definitive basis for any decision, contract, commitment or action whatsoever, with respect to any proposed transaction or otherwise. You and your directors, officers, employees, agents and affiliates must hold this document and any oral information provided in connection with this document in strict confidence and may not communicate, reproduce, distribute or disclose it to any other person, or refer to it publicly, in whole or in part at any time except with our prior written consent. If you are not the intended recipient of this document, please delete and destroy all copies immediately. We have prepared this document and the analyses contained in it based, in part, on certain assumptions and information obtained by us from the recipient, its directors, officers, employees, agents, affiliates and/or from other sources. Our use of such assumptions and information does not imply that we have independently verified or necessarily agree with any of such assumptions or information, and we have assumed and relied upon the accuracy and completeness of such assumptions and information for purposes of this document. Neither we nor any of our affiliates, or our or their respective officers, employees or agents, make any representation or warranty, express or implied, in relation to the accuracy or completeness of the information contained in this document or any oral information provided in connection herewith, or any data it generates and accept no responsibility, obligation or liability (whether direct or indirect, in contract, tort or otherwise) in relation to any of such information. We and our affiliates and our and their respective officers, employees and agents expressly disclaim any and all liability which may be based on this document and any errors therein or omissions therefrom. Neither we nor any of our affiliates, or our or their respective officers, employees or agents, make any representation or warranty, express or implied, that any transaction has been or may be effected on the terms or in the manner stated in this document, or as to the achievement or reasonableness of future projections, management targets, estimates, prospects or returns, if any. Any views or terms contained herein are preliminary only, and are based on financial, economic, market and other conditions prevailing as of the date of this document and are therefore subject to change. We undertake no obligation or responsibility to update any of the information contained in this document. Past performance does not guarantee or predict future performance. This document and the information contained herein do not constitute an offer to sell or the solicitation of an offer to buy any security, commodity or instrument or related derivative, nor do they constitute an offer or commitment to lend, syndicate or arrange a financing, underwrite or purchase or act as an agent or advisor or in any other capacity with respect to any transaction, or commit capital, or to participate in any trading strategies, and do not constitute legal, regulatory, accounting or tax advice to the recipient. We recommend that the recipient seek independent third party legal, regulatory, accounting and tax advice regarding the contents of this document. This document does not constitute and should not be considered as any form of financial opinion or recommendation by us or any of our affiliates. This document is not a research report and was not prepared by the research department of Morgan Stanley or any of its affiliates. Notwithstanding anything herein to the contrary, each recipient hereof (and their employees, representatives, and other agents) may disclose to any and all persons, without limitation of any kind from the commencement of discussions, the U.S. federal and state income tax treatment and tax structure of the proposed transaction and all materials of any kind (including opinions or other tax analyses) that are provided relating to the tax treatment and tax structure. For this purpose, "tax structure" is limited to facts relevant to the U.S. federal and state income tax treatment of the proposed transaction and does not include information relating to the identity of the parties, their affiliates, agents or advisors. This document is provided by Morgan Stanley & Co. LLC and/or certain of its affiliates or other applicable entities, which may include Morgan Stanley Realty Incorporated, Morgan Stanley Senior Funding, Inc., Morgan Stanley Bank, N.A., Morgan Stanley & Co. International plc, Morgan Stanley Securities Limited, M organ Stanley Bank AG, Morgan Stanley MUFG Securities Co., Ltd., Mitsubishi UFJ Morgan Stanley Securities Co., Ltd., Morgan Stanley Asia Limited, Morgan Stanley Australia Securities Limited, Morgan Stanley Australia Limited, Morgan Stanley Asia (Singapore) Pte., Morgan Stanley Services Limited, Morgan Stanley & Co. International plc Seoul Branch and/or Morgan Stanley Canada Limited Unless governing law permits otherwise, you must contact an authorized Morgan Stanley entity in your jurisdiction regarding this document or any of the information contained herein. 42 © Morgan Stanley and/or certain of its affiliates. All rights reserved.
