Antero Midstream Partners LP Board Materials Project Alpine August 9, 2018
Table of Contents Section 1 Executive Summary 3 Section 2 Pro Forma Trading Considerations 15 PROJECT ALPINE 2
SECTION 1 Executive Summary 3
Executive Summary Project Alpine • We are pleased to present our thoughts on the potential combination of AMGP and AM • We evaluated a number of potential simplification strategies involving AR, AM and AMGP over the past 6+ months and have concluded that an acquisition of AM by AMGP appears to be the optimal restructuring strategy – Results in a simple C-Corp structure, increasingly the vehicle preferred by the market and larger long-only investment complexes, while paving a path to be an eligible entity for broader market indices over time (i.e., S&P 500) – Provides tax basis step-up and associated shelter, and therefore improved distributions relative to other combination alternatives – However, is taxable to AM unitholders including AR, mitigated somewhat by public unitholders’ relatively high estimated average tax basis of ~$23-$24 per unit, and AR’s ~$3Bn of NOLs oFurthermore,~95% of AM’s public float is held by institutions, who are generally less sensitive to gain taxes vis-à-vis retail holders • Additionally, we understand that pro forma AMGP will convert to a traditional C-Corp, which will further simplify its legal structure and enhance corporate governance of the entire midstream business • In this presentation we will: – Discuss current midstream market trends and investor sentiment – Compare the current midpoint between counterproposals to precedent simplification transactions in the midstream sector – Provide observations on the potential trading levels of the combined entity PROJECT ALPINE EXECUTIVE SUMMARY 4
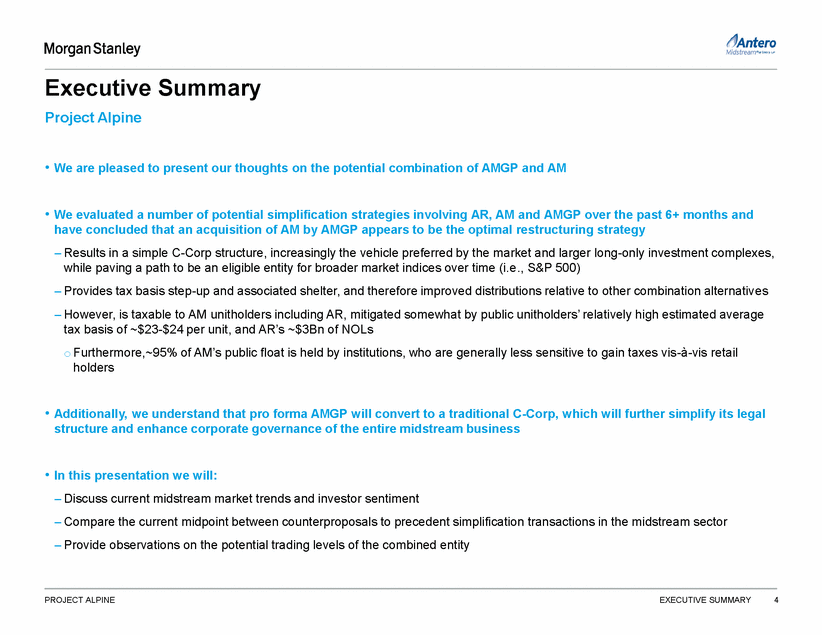
Investor Feedback to Morgan Stanley on “Midstream Model 2.0” • The 2.0 business model starts with eliminating the general partner/ limited partner structure, along with burdensome IDRs – Removing the IDR mechanism and the need to pay an ever greater share of distributions to general partners better aligns the interests of all shareholders and gives businesses more flexibility in how they allocate capital • Investors themselves are largely agnostic to base structure, though at the margin C-Corps have enjoyed enhanced liquidity and a broader addressable investor universe, which helps in markets where MLP fund flows are tight • Traditional LP structures will still have equity access in the right market backdrop, but depth and discount will continue to be beholden to MLP fund flows and sentiment PROJECT ALPINE EXECUTIVE SUMMARY 5 Other • Executives should be compensated based on normalized cash flow metrics • Coverage levels of ~1.2x viewed as generally appropriate dependent of the growth profile and a responsible balance sheet • Subordination is far less of a focus – focus is squarely on governance and IDR construct IDRs • Dedicated MLP and generalist investor community are universally opposed • Dedicated MLP investors have varying degrees of tolerance of when IDRs are addressed but feel structures that still have IDRs with a material burden will have a hard time finding new capital Governance • Governance is the primary structural grievance with the traditional MLP structure • GP / LP misalignment – sponsor history of favorable GP treatment at the expense of LP • LP board representation is a major issue and focus for new investors – investors like traditional corporate style board independence (even if a controlled company) Structural Form and Valuation Approach Zimmer • Generally indifferent to a C-Corp vs. MLP base structure, so long as IDR and governance issues addressed • At the margin, C-Corps enjoy enhanced liquidity and an expanded buyer universe • C-Corp valuation primarily AV / EBITDA focused; however the market is broadly moving to EBITDA and DCF multiples including for MLPs as generalist investors look at sector Investor Feedback
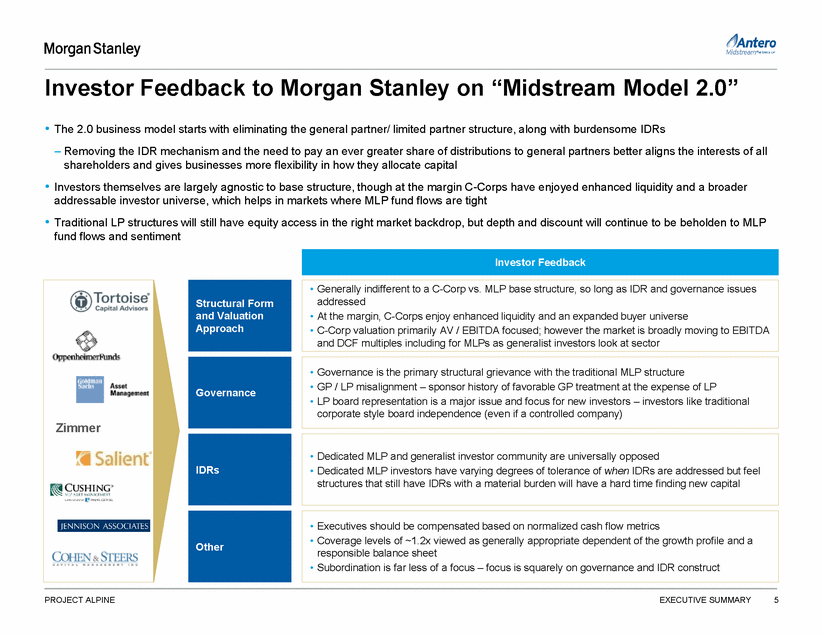
t.1Antero Midstream··•·.. Morgan Stanley What Investors are Saying Excerpts from a Recent Investor Letter in Their Own Shareholder Updates • • Has it removed its incentive distribution rights? Does it have high distribution coverage? Capital Appreciation MLP 1.0 MLP2.0 Source Cohen & Steers "Green Shoots for MLP 2 o· Investor Letter PROJECT ALPINE EXECUTIVE SUMMARY 6 Exhibit 5: The New Business Model MLP 1.0 MLP 2.0 Complex structure (GP/LP with IDRs) Simplified structure (no IDRs) Weak alignment of shareholder interests Greater shareholder alignment High leverageLower leverage Maximized distribution growth I greater risk of distribution cuts Higher distribution coverage /lower risk of distribution cuts Asset buying to drive IDR payouts Focus on core assets and return on invested capital Frequent, dilutive equity issuanceStock buybacks How to Identify a 2.0 Company: --·•Does it try to self-fund the majority of its capex? • Is the management team aligned with all investors? •Does it have an independent Board of Directors and best-in-class corporate governance? It doesn't matter if it's a corporation, an MLP or Canadian company-if it approaches its business in this way, it represents the new model of midstream. If it doesn't, it's version 1.0 and, in our view, could face significant challenges ahead. Capital Appreciation Exhibit 6: A Shifting Return Profile Focused on Total Return
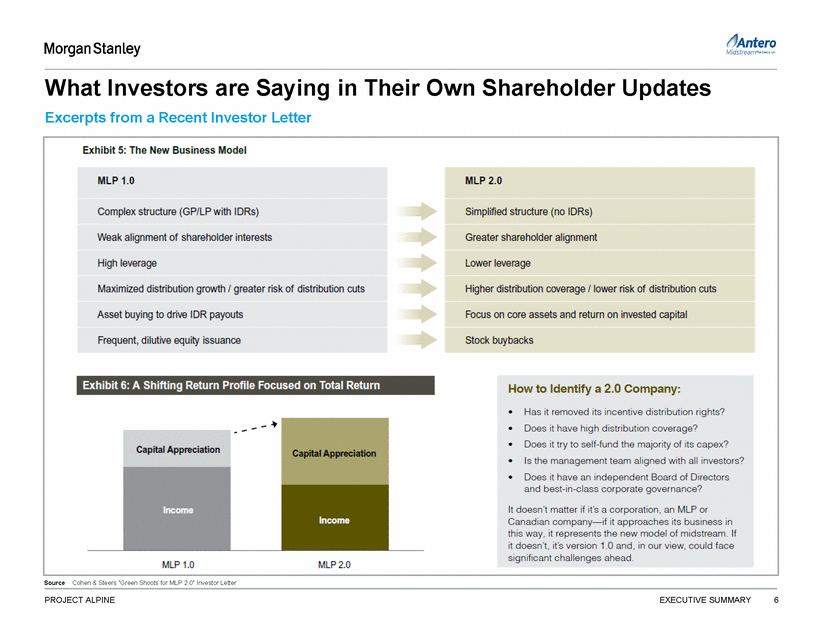
Recent Trends in C-Corp vs. LP Structures Liquidity Benchmarking (LTM) (1) Select Midstream “C-Corp” Follow-Ons (1) Select MLP Follow-Ons (1) 3Mo ADTV / Float 1.2% Discount (%) Performance (%) Discount (%) Performance (%) Pricing Date Size ($MM) All-In F/O Cost Offer / Offer / T + 1 Current Pricing Size All-In Offer / Offer / Issuer % TSO Date Issuer ($MM) % TSO F/O Cost T + 1 Current 06/26/18 CNX Midstream Partners LP 136.8 11.7 (11.9) (13.3) 2.7 11.5 1.0% 01/04/18 ONEOK Inc 1,190.8 5.6 (3.0) (4.1) 2.9 23.9 02/01/18 Shell Midstream Partners LP 680.0 13.3 (5.2) (6.1) (3.7) (20.3) LLC: 0.89% C-Corp: 0.87% LP: 0.68% 05/25/17 Targa Resources Corp 783.7 8.6 (4.9) (5.6) 2.7 12.0 09/06/17 Antero Midstream Partners LP 314.5 5.4 (6.4) (7.4) (0.7) 2.6 0.8% 02/23/17 Targa Resources Corp 400.1 3.7 (2.9) (4.3) 1.5 (6.8) 08/14/17 Energy Transfer Partners LP 1,007.1 4.9 (5.0) (5.9) (0.2) 29.2 02/23/17 Plains GP Holdings LP 1,497.3 20.0 (2.4) (3.8) 2.7 (19.5) 07/19/17 Western Gas Partners LP 726.7 8.9 0.4 (0.6) 6.9 (1.0) 01/23/17 Targa Resources Corp 530.4 5.0 (4.0) (5.1) 0.2 (10.4) 04/12/17 NuStar Energy LP 666.3 18.3 (10.0) (13.0) 3.2 (42.6) 0.6% 01/09/17 Williams Companies Inc 2,167.8 10.0 (9.2) (11.2) (1.7) 7.4 02/24/17 Hi-Crush Partners LP 424.4 37.0 (12.4) (14.8) (3.6) (26.4) 02/24/16 Enbridge Inc 1,674.4 6.5 (5.7) (9.0) 13.7 21.3 10/24/16 Buckeye Partners LP 588.7 6.8 (6.5) (7.7) 2.3 (45.0) 0.4% 03/12/15 Targa Resources Corp 340.1 8.9 (3.6) (4.5) 0.2 (43.3) 09/26/16 Sunoco Logistics Partners LP 652.1 8.1 (7.4) (8.4) 1.9 N/A 06/18/14 Enbridge Inc 368.5 0.9 (0.9) (4.9) 0.1 (23.5) 08/09/16 Phillips 66 Partners LP 301.3 6.2 (4.0) (4.9) (2.8) 6.2 06/17/14 Williams Companies Inc 3,474.2 8.9 1.8 (1.0) 0.6 (45.4) 05/18/16 Shell Midstream Partners LP 401.5 12.4 (8.6) (9.4) 0.0 (34.8) 0.2% Jun-17 Oct-17 Feb-18 Jun-18 C-Corp LLC LP Source: Bloomberg, Capital IQ Source: Dealogic Converted to “Check-The-Box” C-Corp in March 2018 Source: Dealogic Incremental C-Corp Investors (2) Monthly MLP Fund Flows Since 2014 3,500 3,000 2,500 2,000 1,500 1,000 500 0 (500) (1,000) (1,500) Jan-14 Jan-15 Jan-16 Monthly OE-Fund Flows Jan-17 Jan-18 Monthly MLP ETF / ETN Flows Monthly MLP CLEF Issuance Source: MLP Data Notes: 1. As of 8/3/18 2. Investors who don’t own AMGP or own Midstream C-Corps in materially bigger size PROJECT ALPINE EXECUTIVE SUMMARY 7 Fund Flows Weak Since January Mean 1,158.4 7.9 (3.4) (5.3) 3.0 (6.4) Median 783.7 8.6 (3.0) (4.9) 1.5 (6.8) Mean 536.3 12.1 (7.0) (8.3) 0.6 (12.1) Median 588.7 8.9 (6.5) (7.7) 0.0 (10.7) 07/31/18 Viper Energy Partners LP 315.0 8.9 (2.3) (5.1) 10.1 14.0
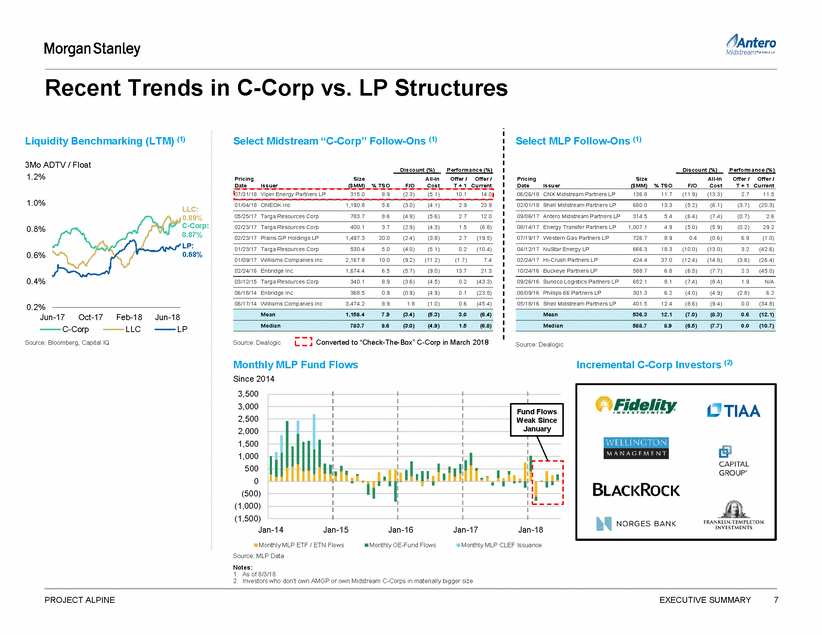
Recent Counterproposals Comparison AMGP & AM Counterproposals Dated July 20th & July 25th, Respectively • Cash consideration of $3.84 per AM common unit vesting schedule as the Series B units PROJECT ALPINE EXECUTIVE SUMMARY 8 AMGP Counterproposal (7/20) AM Counterproposal (7/25) Exchange Ratio / Cash Consideration •1.65x AMGP shares per AM unit •1.71x AMGP shares per AM unit; plus Series B Shares •All Series B units exchanged for an aggregate 18.5MM AMGP shares •Agreed, except for, new AMGP shares will be subject to the same Reorganization •AMGP will be reorganized as a Delaware corporation •Agreed •Governance terms are open IDR Treatment •All IDRs held in AM in will be canceled •Agreed Pro Forma Dividend •Expectation that AM Common Unit Holders will not realize a distribution cut from what they would have received for the first four quarters post transaction •Agreed, except for, expectation that concurrent with the announcement of the transaction, it is communicated to the public that there will be no “backdoor” distribution cut for existing AM unitholders AM Unitholder Vote •Approval by the majority of the non-affiliated AM unitholders •Agreed Other Terms •Willing to negotiate any potential Water Earn-Out separate and apart from this transaction •Agreed
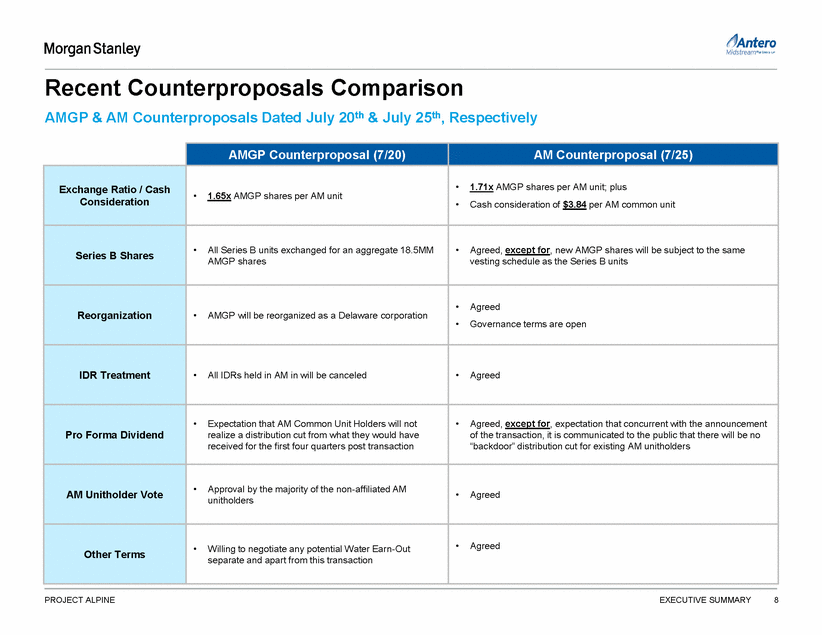
Historical Exchange Since AMGP IPO Ratio Analysis Exchange Adj. Ex. AMGP AM AM / AMGP Exchange Ratio As of 3 August 2018 2.00 Counter-Offer: 1.918x 1.90 Adj. Spot(1): 1.827x 1.80 Current: 1.745x 1.70 30 Day: 1.640x 60-Day: 1.626x 90-Day: 1.609x 1.60 180-Day: 1.558x 1.50 Spot at SailingStone Letter: 1.472x 1.40 Spot at Spec. Comm. Annouce: 1.380x 1.30 May-2017 Source: Capital IQ Notes: Jul-2017 Oct-2017 Dec-2017 Mar-2018 May-2018 Aug-2018 1. Adjusted AM / AMGP exchange ratio calculated as the AMGP unaffected market cap grossed up by the percentage of Series B 2018E distributions divided by pro forma AMGP share count (inclusive of 18.5MM share Series B conversion) 2. Implied counteroffer premium includes the stated 1.71x exchange ratio plus the $3.84 cash component (All -in exchange ratio of 1.918x) PROJECT ALPINE EXECUTIVE SUMMARY 9 Positive for AMGP Positive for AM Jan 29, 2018: SailingStone files 13-D Feb 24, 2018: Announce Special Committees (1)(2) Ratio (x) Ratio (x) Counteroffer Counteroffer Implied AMGP Offer Premium Implied Counteroffer Premium (2) Exchange Adj. Ex. Ratio (x)Ratio (x) Exchange Adj. Ex. Ratio (x)Ratio (x) 8/3/20181.745x1.827x1.650x1.918x (5%)(10%) 10%5% 30-Day Avg.1.640x1.717x1.650x1.918x 1%(4%) 17%12% 60-Day Avg.1.626x1.703x1.650x1.918x 1%(3%) 18%13% 90-Day Avg.1.609x1.685x1.650x1.918x 3%(2%) 19%14% 180-Day Avg.1.558x1.632x1.650x1.918x 6%1% 23%18% LTM1.565x1.639x1.650x1.918x 5%1% 22%17% Spot at SailingStone Letter1.472x1.541x1.650x1.918x 12%7% 28%23% Spot at Spec. Comm. Announce.1.380x1.446x1.650x1.918x 20%14% 38%33% 30 Day Avg at SailingStone Letter1.504x1.575x1.650x1.918x 10%5% 26%21%
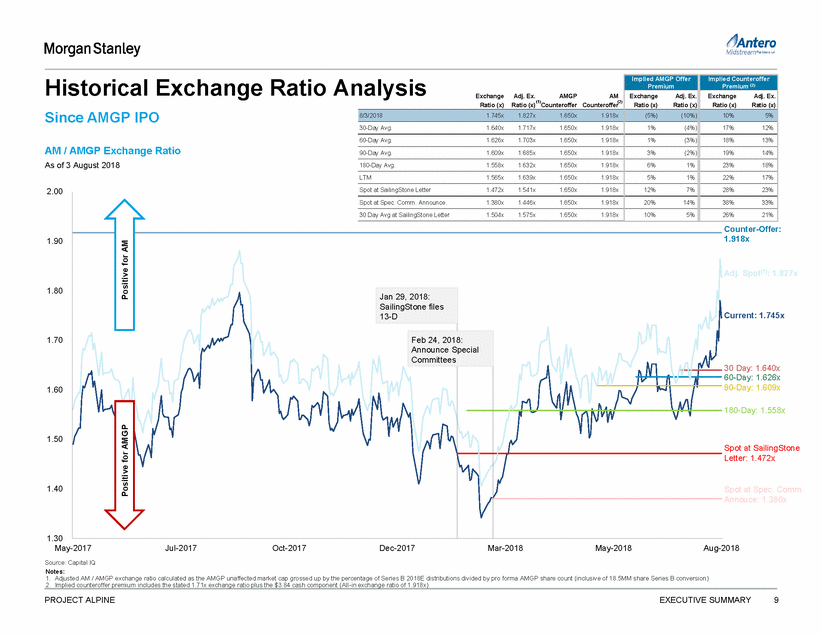
Illustrative Midpoint Offer Analysis AMGP & AM Counterproposals Dated July 20th & July 25th, Respectively Assumption • For the analysis herein, we have assumed an “illustrative midpoint” between the most recent AMGP and AM counterproposals Midpoint Offer Analysis Market data as of 3 August 2018 Pro Forma Ownership PF AM Ownership in AMGP Ratio (x)(3) Ratio (x) Adj. Series B AMGP Share Price AMGP Share Price (as of 2/23/18) ($ / share) $19.19 AMGP FDSO (MM) 186.20 '18E AM Distributions to Series B (%) 4.7% Proposed Series B Conversion (MM) 18.5 Pro Forma AMGP FDSO (MM) 204.7 Implied AMGP Share Price ($ / share) $18.32 Notes: 1. Excludes $225MM of cash funded accelerated water earn-out payment made to AM 2. Assumes cash and shares consistent with current ownership; election feature may provide a higher cash content for AR 3. Adjusted AM / AMGP exchange ratio calculated as the AMGP unaffected market cap grossed up by the percentage of Series B 2018E distributions divided by pro forma AMGP share count (inclusive of 18.5MM share Series B conversion) PROJECT ALPINE EXECUTIVE SUMMARY 10 Implied Share Price Impact (%) (4.5%) Implied AMGP Market Cap. ($MM) 3,751 AMGP Market Cap. ($MM) 3,573 Stock Exchange Ratio1.650x 1.680x 1.710x PF AM Ownership60.1% 60.6% 61.0% (2) 31.8% 32.1% 32.3% PF AMGP Public Float43.2% 43.2% 43.3% AMGP Counterproposal (7/20) Illustrative Midpoint AM Counterproposal (7/25) Spot Exchange Ratio (x) 1.65x Cash Consideration ($/Unit) - 1.68x $1.92 1.71x $3.84 All-in Exchange Ratio (x) 1.650x 1.784x 1.918x Illustrative Equity Purchase Price ($MM) 5,709 6,172 6,635 % Cash - Cash Consideration ($MM)(1) - Cash to AR ($MM) (1)(2) - AMGP Shares Issued to AM 308.6 5.8% 359 190 314.2 10.8% 718 380 319.8 Premiums Analysis: Exchange Adj. Exchange Ratio (x) Ratio (x)(3) Exchange Adj. Exchange Ratio (x) Ratio (x)(3) Exchange Adj. Exchange 8/3/2018 (5.4%) (9.7%) 30-Day Avg. 0.6% (3.9%) 60-Day Avg. 1.4% (3.1%) 90-Day Avg. 2.6% (2.1%) 180-Day Avg. 5.9% 1.1% Spot at Spec. Comm. Announce. 19.5% 14.1% 2.2% (2.1%) 8.6% 4.0% 9.5% 4.8% 10.8% 6.1% 14.6% 9.7% 29.0% 23.5% 9.9% 5.5% 16.5% 11.8% 17.5% 12.8% 19.0% 14.2% 23.3% 18.3% 38.4% 32.8%
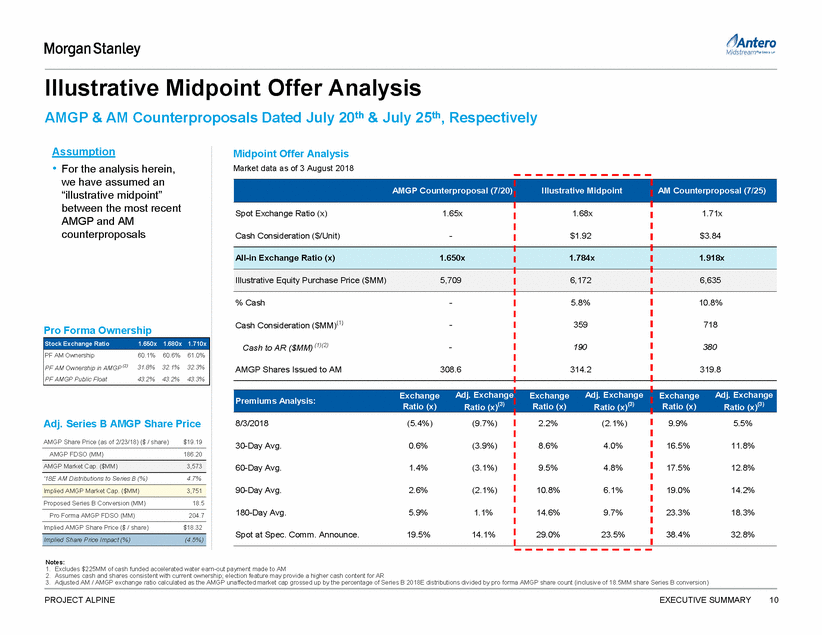
Impact to AM vs. Selected Peer Precedents Assumes Illustrative Midpoint 1.680x Exchange Ratio & $1.92 Cash Consideration Year 1-Day Prem. (%) % Cash % MLP Distribution Cut – Forward Year AM (3) EPB OKS KMP AM Adj. AM OKS NGLS NGLS KMP EPB RRMS WPZ KMP OKS NGLS ETP TEP N RRMS WPZ WPZ RRMS TEP ETP RRMS 0% 10% 20% 30% 40% 0 3 6 (10%) 5% 20% 35% 0% 5% 10% 15% Source Company projections, Company disclosure, Wall Street research Notes: 1. Represents a non-taxable LP-to-LP transaction 2. Distribution does not breakeven throughout the 5 year projection period provided by Wall Street research 3. AM – 1.680x exchange ratios plus $1.92 cash consideration per share for AM / AMGP as of 23 Feb 18 (Special Committee Announcement Date) represent a 29% spot premium to market value 4. AM (adjusted for AMGP share price reflected of Series B conversion as shown on page 10) – 1.680x exchange ratios plus $1.92 cash consideration per share for AM / AMGP as of 23 Feb 18 (Special Committee Announcement Date) represent a 23% spot premium to market value 5. WPZ – 1.500x exchange ratio for WPZ / WMB as of 8 May 18 represent a 7% spot premium to market value and an incremental 7% premium to the spot exchange ratio the day b efore FERC press release (3/15/18) 6. TEP – 10% premium to 30-day VWAP before 7 Feb 18 restructuring review announcement; premium on the day prior to 26 Mar 18 announcement was 0% PROJECT ALPINE EXECUTIVE SUMMARY 11 Premium to Unaffected 1-Day Premium 12% 12% 6% 0% 0% 0% 0% 0% 0%(1) AM 0% TEP EPB GLS ETP 0% 8% 15% 16% 17% 23% 31% 32%(1) AM 0 TEP OKS EPB KMP ETP WPZ 0 4 4 5 5 6 6+(1)(2) 6 +(2) 2% 29% 26% (2%) 23%(4) 18% 15% 12% 11% (1) 7% 14% (5) 0% 10% (6) 0% Cash Consideration Up-Front Premium DPU Breakeven Year MLP Distribution Cut
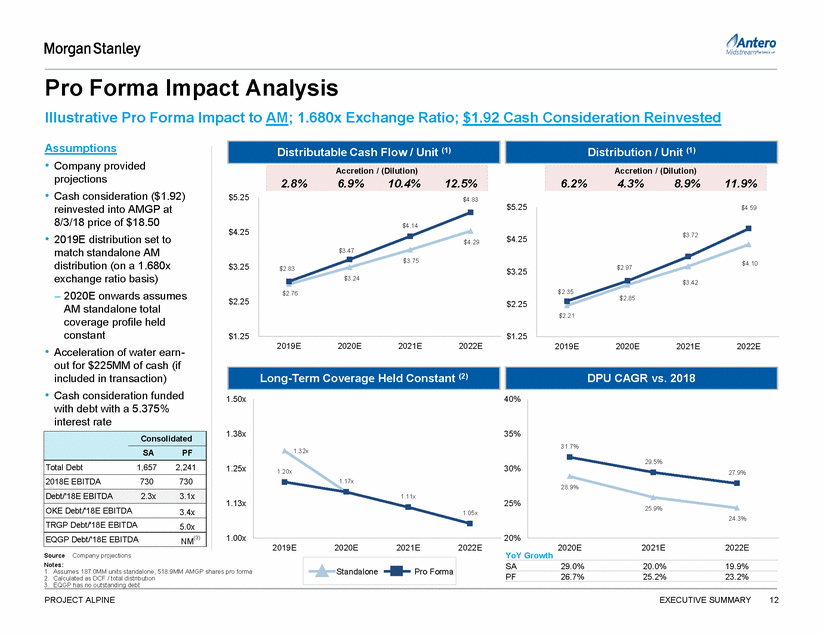
Pro Forma Impact Analysis Illustrative Pro Forma Impact to AM; 1.680x Exchange Ratio; $1.92 Cash Consideration Reinvested Assumptions • Company provided projections • Cash consideration ($1.92) reinvested into AMGP at 8/3/18 price of $18.50 • 2019E distribution set to match standalone AM distribution (on a 1.680x exchange ratio basis) – 2020E onwards assumes AM standalone total coverage profile held constant • Acceleration of water earn-out for $225MM of cash (if included in transaction) • Cash consideration funded with debt with a 5.375% interest rate $5.25 $5.25 $4.59 $4.25 $4.25 $3.25 $3.25 $2.25 $2.25 $1.25 $1.25 2019E 2020E 2021E 2022E 2019E 2020E 2021E 2022E 1.50x 40% 1.38x 35% 1.25x 30% 1.13x 25% 1.00x 20% 2019E 2020E 2021E 2022E 2020E 2021E 2022E YoY Growth Source Company projections Notes: 1. Assumes 187.0MM units standalone, 518.9MM AMGP shares pro forma 2. Calculated as DCF / total distribution SA 29.0% 20.0% 19.9% PF 26.7% 25.2% 23.2% 3. EQGP has no outstanding debt PROJECT ALPINE EXECUTIVE SUMMARY 12 StandalonePro Forma 31.7% 29.5% 27.9% 28.9% 25.9% 24.3% 1.32x 1.20x 1.17x 1.11x 1.05x Consolidated SA PF Total Debt 1,657 2,241 2018E EBITDA 730 730 Debt/'18E EBITDA 2.3x 3.1x OKE Debt/'18E EBITDA 3.4x TRGP Debt/'18E EBITDA 5.0x EQGP Debt/'18E EBITDA NM(3) Long-Term Coverage Held Constant (2) DPU CAGR vs. 2018 $3.72 $4.10 $2.97 $3.42 $2.35$2.85 $2.21 $4.83 $4.14 $4.29 $3.47 $3.75 $2.83 $3.24 $2.76 Distributable Cash Flow / Unit (1) Distribution / Unit (1) Accretion / (Dilution) 2.8% 6.9% 10.4% 12.5% Accretion / (Dilution) 6.2% 4.3% 8.9% 11.9%
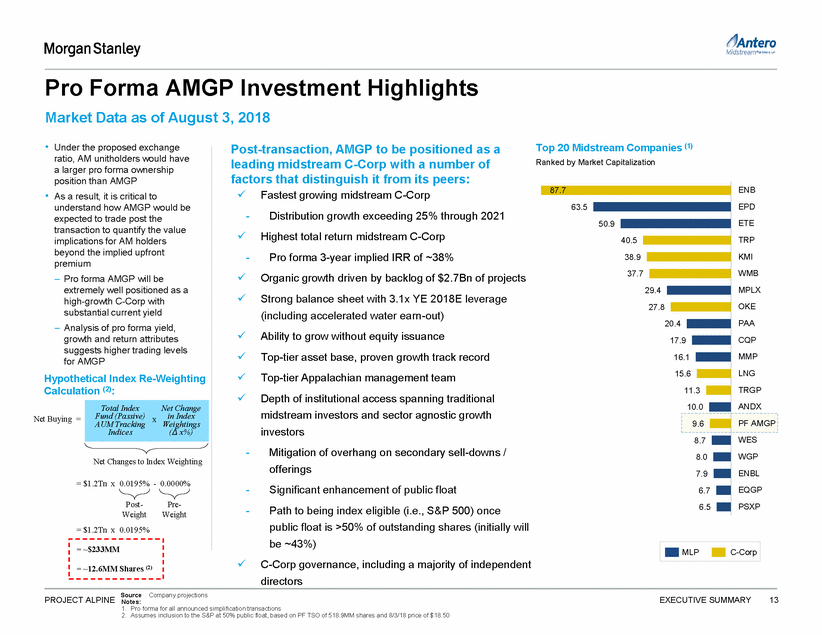
Pro Forma AMGP Investment Highlights Market Data as of August 3, 2018 • Top 20 Midstream Companies (1) Ranked by Market Capitalization Under the proposed exchange ratio, AM unitholders would have a larger pro forma ownership position than AMGP As a result, it is critical to understand how AMGP would be expected to trade post the transaction to quantify the value implications for AM holders beyond the implied upfront premium – Pro forma AMGP will be extremely well positioned as a high-growth C-Corp with substantial current yield – Analysis of pro forma yield, growth and return attributes suggests higher trading levels for AMGP Post-transaction, AMGP to be positioned as a leading midstream C-Corp with a number of factors that distinguish it from its peers: ENB EPD ETE TRP KMI WMB MPLX OKE PAA CQP MMP LNG TRGP ANDX Fastest growing midstream C-Corp • -Distribution growth exceeding 25% through 2021 Highest total return midstream C-Corp -Pro forma 3-year implied IRR of ~38% Organic growth driven by backlog of $2.7Bn of projects Strong balance sheet with 3.1x YE 2018E leverage (including accelerated water earn-out) Ability to grow without equity issuance Top-tier asset base, proven growth track record Top-tier Appalachian management team Depth of institutional access spanning traditional midstream investors and sector agnostic growth investors Hypothetical Index Re-Weighting Calculation (2): Net Buying = AUM Tracking Weightings - Mitigation of overhang on secondary sell-downs / offerings Significant enhancement of public float Path to being index eligible (i.e., S&P 500) once public float is >50% of outstanding shares (initially will be ~43%) C-Corp governance, including a majority of independent directors Net Changes to Index Weighting = $1.2Tn x 0.0195% - 0.0000% - - Post-Weight = $1.2Tn x 0.0195% Pre-Weight Source Company projections Notes: 1. Pro forma for all announced simplification transactions 2. Assumes inclusion to the S&P at 50% public float, based on PF TSO of 518.9MM shares and 8/3/18 price of $18.50 PROJECT ALPINE EXECUTIVE SUMMARY 13 = ~$233MM = ~12.6MM Shares (2) MLPC-Corp Total IndexNet Change Fund (Passive) xin Index Indices( x%) 87.7 63.5 50.9 40.5 38.9 37.7 29.4 27.8 20.4 17.9 16.1 15.6 11.3 10.0 9.6 PF AMGP WES WGP ENBL EQGP PSXP 8.7 8.0 7.9 6.7 6.5
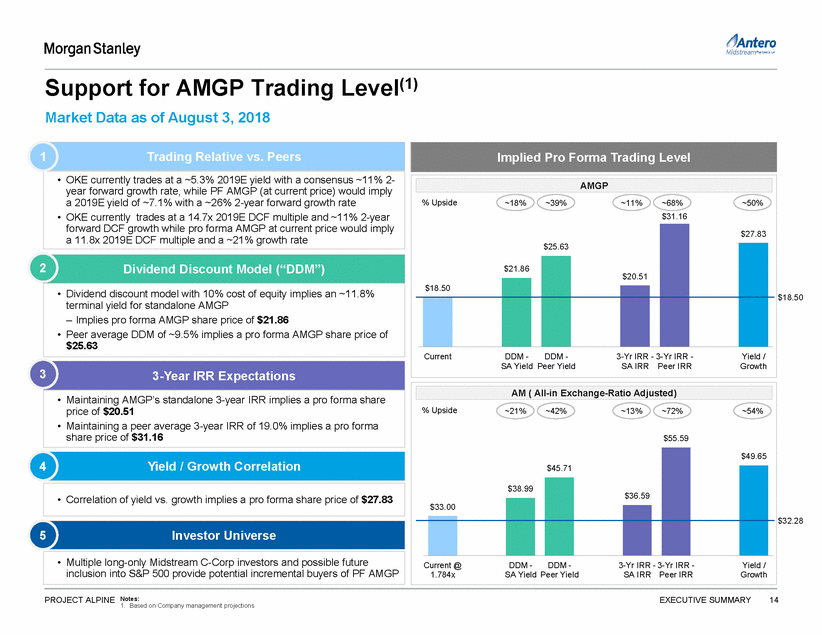
Support for AMGP Trading Market Data as of August 3, 2018 Level(1) 1 Trading Relative vs. Peers 2 Dividend Discount Model (“DDM”) $18.50 3 3-Year IRR Expectations 4 Yield / Growth Correlation $32.28 5 Investor Universe inclusion into S&P 500 provide potential incremental buyers of PF AMGP PROJECT ALPINE Notes: EXECUTIVE SUMMARY 14 1. Based on Company management projections • Multiple long-only Midstream C-Corp investors and possible future • Correlation of yield vs. growth implies a pro forma share price of $27.83 % Upside~21%~42%~13%~72%~54% $55.59 $45.71 $49.65 $38.99 $36.59 $33.00 Current @DDM -DDM -3-Yr IRR - 3-Yr IRR -Yield / 1.784xSA Yield Peer YieldSA IRR Peer IRRGrowth AM ( All-in Exchange-Ratio Adjusted) • Maintaining AMGP’s standalone 3-year IRR implies a pro forma share price of $20.51 • Maintaining a peer average 3-year IRR of 19.0% implies a pro forma share price of $31.16 • Dividend discount model with 10% cost of equity implies an ~11.8% terminal yield for standalone AMGP – Implies pro forma AMGP share price of $21.86 • Peer average DDM of ~9.5% implies a pro forma AMGP share price of $25.63 Implied Pro Forma Trading Level % Upside~18%~39%~11%~68%~50% $31.16 $25.63 $27.83 $21.86 $20.51 $18.50 CurrentDDM -DDM -3-Yr IRR - 3-Yr IRR - Yield / SA Yield Peer YieldSA IRR Peer IRRGrowth AMGP • OKE currently trades at a ~5.3% 2019E yield with a consensus ~11% 2-year forward growth rate, while PF AMGP (at current price) would imply a 2019E yield of ~7.1% with a ~26% 2-year forward growth rate • OKE currently trades at a 14.7x 2019E DCF multiple and ~11% 2-year forward DCF growth while pro forma AMGP at current price would imply a 11.8x 2019E DCF multiple and a ~21% growth rate
SECTION 2 Pro Forma Trading Considerations 15
Peer Trading Metrics 1 Market Data as of August 3, 2018 • Pro forma AMGP would be projected to have higher growth with a similar yield as OKE • Pro forma DCF and EBITDA multiples projected to be attractive for new AMGP • Assumes illustrative midpoint transaction structure and early settlement of water earn-out • Pro forma AMGP projected to have a healthy total debt / 2018E EBITDA leverage compared to peers: – PF AMGP: 3.1x(1) – Targa: 5.0x – ONEOK: 3.4x – EQGP: NM(2) peers with minimal leverage multiples that are in-line or lower than peers, uggests potential for upward share price supports premium valuation relative to peers metrics to support self-funding Source Capital IQ, Company projections for AM & AMGP Notes: 1. Assumes 2018E YE total debt inclusive of $584MM of debt used to fund the cash consideration and water earn -out 2. EQGP has no outstanding debt PROJECT ALPINE PRO FORMA TRADING CONSIDERATIONS 16 Trading Summary Equity Value6,68827,75211,3323,4459,599 Aggregate Value6,68735,92619,0603,43011,817 PF AMGP becomes more in-line with C-Corp Aggregate Value / 2019E EBITDA13.2x14.4x13.2x15.9x12.0x PF AMGP's high growth results in forward assuming current AMGP standalone share price 2020E EBITDA 10.8x12.9x11.6x 10.7x 9.7x Equity Value / 2019E DCF13.2x 14.7x 13.1x21.3x 11.8x PF AMGP's peer-leading DCF growth for s rerating post-transaction 2020E DCF10.8x13.5x11.2x14.3x9.7x DCF Growth (19E - 21E) 14.8% 10.5% 14.1% 33.1% 20.8% Yield & Growth Metrics 2019E Yield7.6% 5.3% 7.1%4.8% 7.1% Significant coverage paired with high growth 2019E Cash Coverage Ratio1.0x1.3x1.1x1.0x1.2x DPU Growth (19E-21E CAGR)14.7% 10.7% 1.4%40.1% 26.0% EBITDA Growth (19E-21E CAGR)14.8%11.1%12.1%33.1%19.6% Credit Metrics Debt / 2018E EBITDANM3.4x5.0x0.0x3.1x Healthy pro forma balance sheet / credit
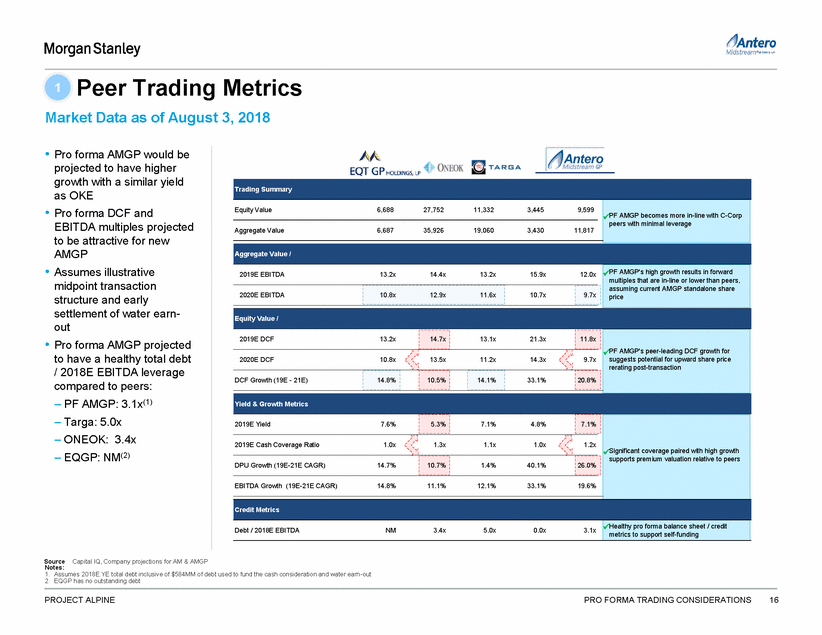
Dividend Discount Method – AMGP Buys AM 2 Market Data as of August 3, 2018 • Utilizing a 10% cost of equity and Wall Street research, the current share price implies a ~11.8% terminal yield after 2022 A• Pro forma for the transaction, AMGP would need a ~15.0% terminal yield to hold the current share price Source Capital IQ, Company Materials PROJECT ALPINE PRO FORMA TRADING CONSIDERATIONS 17 2019 2020 2021 2022 Terminal PF AMGP Distributions EBITDA 989 1,222 1,413 1,642 Interest Expense (121) (147) (162) (176) Cash Taxes - - - - Series B Payment - - - - Maint. Capex & Other (43) (67) (48) (62) Cash Flow Available 824 1,009 1,203 1,405 Coverage 142 144 120 70 AMGP Distributions 683 865 1,083 1,334 Present Value PV @ 10.0% Cost of Equity 651 750 853 956 6,389 Total PV @ 10.0% Cost of Equity 9,599 Current Share Price $18.50 Terminal Value Implied Terminal Yield 15.0% Undiscounted Terminal Value 8,919 2019 2020 2021 2022 Terminal Standalone AMGP Distributions EBITDA 234 353 460 587 Interest Expense - - - - Cash Taxes (56) (85) (110) (140) Series B Payment (12) (20) (26) (34) Maint. Capex & Other - - - - Cash Flow Available 165 249 324 413 Coverage - - - - AMGP Distributions 165 249 324 413 Present Value PV @ 10.0% Cost of Equity 157 216 255 296 2,520 Total PV @ 10.0% Cost of Equity 3,445 Current Share Price $18.50 Terminal Value Implied Terminal Yield 11.8% Undiscounted Terminal Value 3,517 A Pro Forma AMGP – Implied Terminal Yield Standalone AMGP
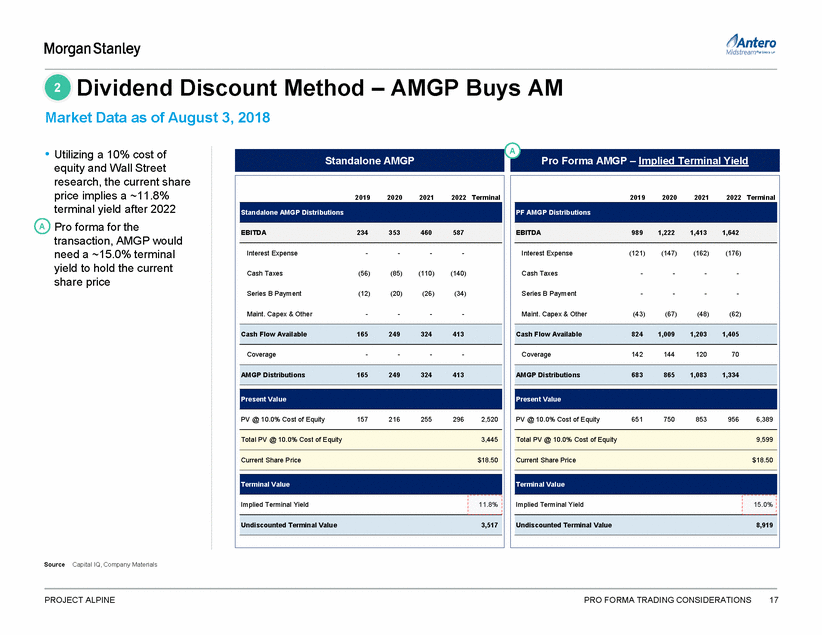
Dividend Discount Method – AMGP Buys AM (Cont’d) 2 Market Data as of August 3, 2018 B B• Holding AMGP’s current terminal yield constant would imply a pro forma share price of $21.86 (~18% upside to current price) C• Using peer average breakeven yield of 9.5%, implied pro forma AMGP would be $25.63 (~39% upside to current price) – Using OKE’s implied terminal yield of 6.4%, pro forma AMGP price would be $34.97 (~89% upside to current price) Source Capital IQ, Company Materials PROJECT ALPINE PRO FORMA TRADING CONSIDERATIONS 18 2019 2020 2021 2022 Terminal PF AMGP Distributions EBITDA 989 1,222 1,413 1,642 Interest Expense (121) (147) (162) (176) Cash Taxes - - - - Series B Payment - - - - Maint. Capex & Other (43) (67) (48) (62) Cash Flow Available 824 1,009 1,203 1,405 Coverage 142 144 120 70 AMGP Distributions 683 865 1,083 1,334 Present Value PV @ 10.0% Cost of Equity 651 750 853 956 10,088 Total PV @ 10.0% Cost of Equity 13,298 Current Share Price $25.63 Terminal Value Implied Terminal Yield 9.5% Undiscounted Terminal Value 14,083 2019 2020 2021 2022 Terminal PF AMGP Distributions EBITDA 989 1,222 1,413 1,642 Interest Expense (121) (147) (162) (176) Cash Taxes - - - - Series B Payment - - - - Maint. Capex & Other (43) (67) (48) (62) Cash Flow Available 824 1,009 1,203 1,405 Coverage 142 144 120 70 AMGP Distributions 683 865 1,083 1,334 Present Value PV @ 10.0% Cost of Equity 651 750 853 956 8,132 Total PV @ 10.0% Cost of Equity 11,342 Current Share Price $21.86 Terminal Value Implied Terminal Yield 11.8% Undiscounted Terminal Value 11,352 C Pro Forma AMGP – Assuming Avg. Peer Yield Pro Forma AMGP – Assuming Standalone Yield
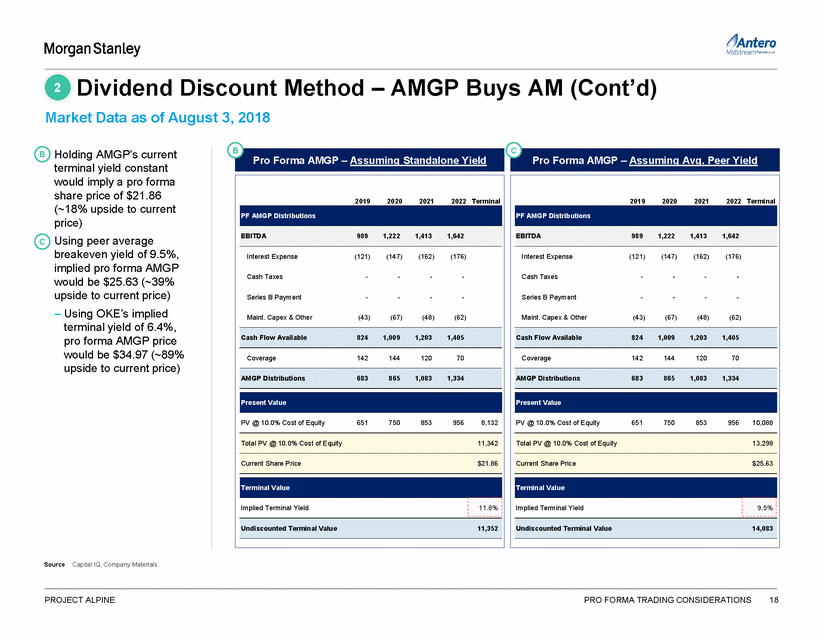
IRR Method Analysis 3 Market Data as of August 3, 2018 A• Current implied 3-year IRR for standalone AMGP is ~37.6% – Maintaining the same AMGP IRR implies a pro forma share price of $20.51 (~11% upside to current price) B• Current peer median 3-year IRR is 19.0% – Maintaining the same for AMGP implies a pro forma share price of $31.16 (~68% upside to current) C• Holding current AMGP price of $18.50 constant implies 3-year IRR of over 42% 2019E Yield (%) Growth CAGR (%) Exit Growth (%) Predicted Exit Yield (%) 3 Year IRR Equity Value Price ($) Distributions per Share ($ / Share) A B C WGP 7,984 $36.47 7.1% $2.60 $2.93 $3.16 10.2% 8.5% 6.3% 18.5% EQGP 6,688 $22.11 7.6% $1.68 $2.05 $2.20 14.7% 6.0% 6.7% 22.2% ENLC 3,159 $17.45 6.9% $1.20 $1.36 $1.52 12.5% 7.2% 6.5% 17.5% WES 8,714 $52.46 7.8% $4.07 $4.26 $4.46 4.7% 4.5% 6.9% 14.8% EQM 6,197 $51.46 10.1% $5.22 $6.00 $6.35 10.3% 4.4% 6.9% 30.8% NBLX 2,130 $53.70 4.9% $2.61 $3.12 $3.74 19.7% 19.8% 4.8% 18.0% CNXM 1,298 $20.40 7.7% $1.57 $1.81 $2.07 14.8% 15.0% 5.4% 30.5% HESM 1,239 $22.71 7.2% $1.63 $1.87 $2.11 13.8% 11.4% 5.9% 23.5% TRGP 11,332 $51.63 7.1% $3.64 $3.64 $3.74 1.4% 4.3% 6.9% 8.5% OKE 27,752 $67.51 5.3% $3.60 $3.95 $4.42 10.7% 6.7% 6.5% 5.8% PROJECT ALPINE PRO FORMA TRADING CONSIDERATIONS 19 Source Capital IQ, Company Materials Peer Mean 11.3% 8.8% 6.3% 19.0% Peer Median 11.6% 7.0% 6.5% 18.2% Operating C-Corp 2019E 2020E 2021E 2019 - 2021 2021 - 2022 MLP Peers 2019E 2020E 2021E 2019 - 2021 2021 - 2022 Antero 2019E 2020E 2021E 2019 - 2021 2021 - 2022 AMGP SA 3,445 $18.50 4.8% $0.89 $1.34 $1.74 40.1% 27.6% 4.1% 37.6% AMGP PF 10,644 6.4% $1.32 $1.67 $2.09 26.0% 23.2% 4.5% AMGP PF 16,170 4.2% $1.32 $1.67 $2.09 26.0% 23.2% 4.5% AMGP PF 9,599 7.1% $1.32 $1.67 $2.09 26.0% 23.2% 4.5% 37.6% 19.0% 42.7% AM 6,041 $32.28 6.8% $2.21 $2.85 $3.42 24.4% 19.9% 4.8% 36.5% GP Peers 2019E 2020E 2021E 2019 - 2021 2021 - 2022 $20.51 $31.16 $18.50 3-Year IRR
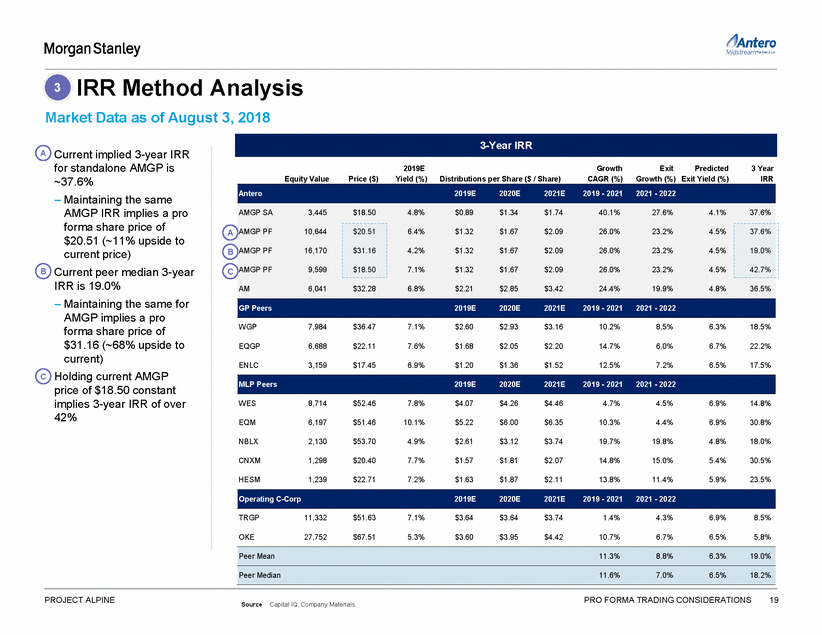
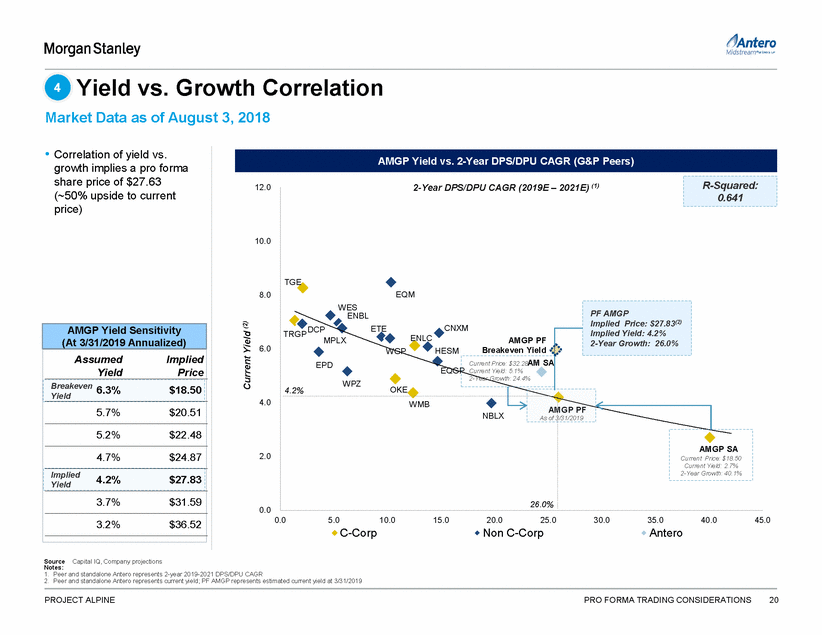
Yield vs. Growth Correlation 4 Market Data as of August 3, 2018 • Correlation of yield vs. growth implies a pro forma share price of $27.63 (~50% upside to current price) 2-Year DPS/DPU CAGR (2019E – 2021E) (1) 12.0 10.0 8.0 (2) CNXM ETE DCP 6.0 Current Price: $32.28AM SA P 6.3% $18.50 4.0 MGP PF 2.0 4.2% $27.83 Yield 0.0 0.0 5.0 10.0 15.0 20.0 25.0 30.0 35.0 Antero 40.0 45.0 C-Corp Non C-Corp Source Capital IQ, Company projections Notes: 1. Peer and standalone Antero represents 2-year 2019-2021 DPS/DPU CAGR 2. Peer and standalone Antero represents current yield; PF AMGP represents estimated current yield at 3/31/2019 PROJECT ALPINE PRO FORMA TRADING CONSIDERATIONS 20 Current Yield (2) AMGP Yield Sensitivity (At 3/31/2019 Annualized) Assumed Implied Yield Price Breakeven Yield 5.7% $20.51 5.2% $22.48 4.7% $24.87 Implied 3.7% $31.59 3.2% $36.52 TGE EQM WES ENBL PF AMGP Implied Price: $27.83 Implied Yield: 4.2% 2-Year Growth: 26.0% TRGPMPLXENLCAMGP PF WGPHESMBreakeven Yield EPDEQG WPZ Current Yield: 5.1% 2-Year Growth: 24.4% 4.2%OKE WMB NBLX A As of 3/31/2019 26.0% AMGP SA Current Price: $18.50 Current Yield: 2.7% 2-Year Growth: 40.1% R-Squared: 0.641 AMGP Yield vs. 2-Year DPS/DPU CAGR (G&P Peers)
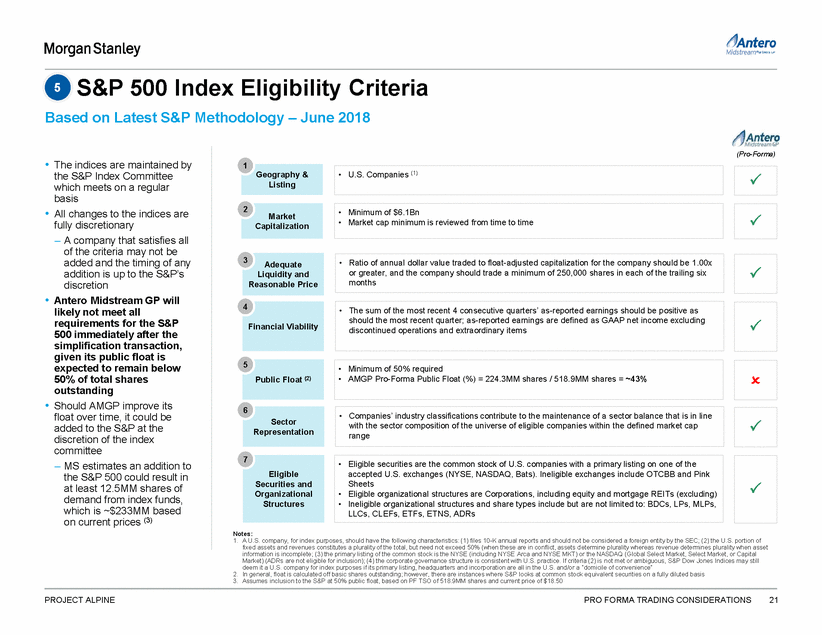
S&P 500 Index Eligibility Criteria 5 Based on Latest S&P Methodology – June 2018 (Pro-Forma) • The indices are maintained by the S&P Index Committee which meets on a regular basis • All changes to the indices are fully discretionary – A company that satisfies all of the criteria may not be added and the timing of any addition is up to the S&P’s discretion • Antero Midstream GP will likely not meet all requirements for the S&P 500 immediately after the simplification transaction, given its public float is expected to remain below 50% of total shares outstanding • Should AMGP improve its float over time, it could be added to the S&P at the discretion of the index committee – MS estimates an addition to the S&P 500 could result in at least 12.5MM shares of demand from index funds, which is ~$233MM based on current prices (3) Notes: 1. A U.S. company, for index purposes, should have the following characteristics: (1) files 10-K annual reports and should not be considered a foreign entity by the SEC; (2) the U.S. portion of fixed assets and revenues constitutes a plurality of the total, but need not exceed 50% (when these are in conflict, assets d etermine plurality whereas revenue determines plurality when asset information is incomplete; (3) the primary listing of the common stock is the NYSE (including NYSE Arca and NYSE MKT) or the NASDAQ (Global Select Market, Select Market, or Capital Market) (ADRs are not eligible for inclusion); (4) the corporate governance structure is consistent with U.S. practice. If criteria (2) is not met or ambiguous, S&P Dow Jones Indices may still deem it a U.S. company for index purposes if its primary listing, headquarters and incorporation are all in the U.S. and/or a “domicile of convenience” 2. In general, float is calculated off basic shares outstanding; however, there are instances where S&P looks at common stock eq uivalent securities on a fully diluted basis 3. Assumes inclusion to the S&P at 50% public float, based on PF TSO of 518.9MM shares and current price of $18.50 PROJECT ALPINE PRO FORMA TRADING CONSIDERATIONS 21 7 Eligible Securities and Organizational Structures P • Eligible securities are the common stock of U.S. companies with a primary listing on one of the accepted U.S. exchanges (NYSE, NASDAQ, Bats). Ineligible exchanges include OTCBB and Pink Sheets • Eligible organizational structures are Corporations, including equity and mortgage REITs (excluding) • Ineligible organizational structures and share types include but are not limited to: BDCs, LPs, MLPs, LLCs, CLEFs, ETFs, ETNS, ADRs 6 Sector Representation P • Companies’ industry classifications contribute to the maintenance of a sector balance that is in line with the sector composition of the universe of eligible companies within the defined market cap range 5 Public Float (2) O • Minimum of 50% required • AMGP Pro-Forma Public Float (%) = 224.3MM shares / 518.9MM shares = ~43% 4 Financial Viability P • The sum of the most recent 4 consecutive quarters’ as-reported earnings should be positive as should the most recent quarter; as-reported earnings are defined as GAAP net income excluding discontinued operations and extraordinary items 3Adequate Liquidity and Reasonable Price P • Ratio of annual dollar value traded to float-adjusted capitalization for the company should be 1.00x or greater, and the company should trade a minimum of 250,000 shares in each of the trailing six months 2Market Capitalization P • Minimum of $6.1Bn • Market cap minimum is reviewed from time to time 1 Geography & Listing P • U.S. Companies (1)
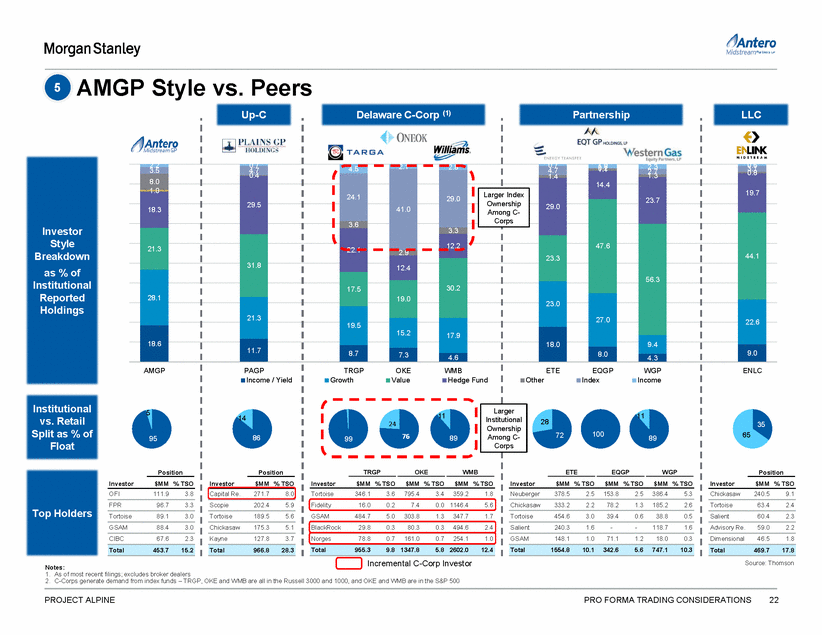
AMGP Style vs. Peers 5 Up-C Delaware C-Corp (1) Partnership LLC 2.8 Among C-3.6 Investor Style Breakdown as % of Institutional Reported Holdings Institutional vs. Retail Split as % of Float on Investor $MM % TSO % TSO OFI 9.1 FPR 2.4 Top Holders Tortois 2.3 GSAM 2.2 CIBC 1.8 Incremental C-Corp Investor Source: Thomson Notes: 1. As of most recent filings; excludes broker dealers 2. C-Corps generate demand from index funds – TRGP, OKE and WMB are all in the Russell 3000 and 1000, and OKE and WMB are in the S&P 500 PROJECT ALPINE PRO FORMA TRADING CONSIDERATIONS 22 Total 17.8 3.5 4.7 4.5 4.7 3.1 14.4 2.7 19.7 41.0 29.0 29.5 8.0 24.1 29.0 23.7 18.3 Larger Index Ownership Corps 47.6 44.1 56.3 3.3 21.3 22.1 31.8 23.3 12.2 2.9 12.4 30.2 28.1 17.5 19.0 23.0 27.0 21.3 22.6 19.5 17.9 15.2 18.0 18.6 9.4 11.7 8.0 9.0 8.7 7.3 4.6 4.3 AMGP 5 95 Position 111.93.8 96.73.3 e89.13.0 88.43.0 67.62.3 453.715.2 PAGP Income / Yield 14 86 Position Investor $MM % TSO Capital Re. 271.7 8.0 Scopie202.45.9 Tortoise189.55.6 Chickasaw175.35.1 Kayne127.83.7 TRGPOKEWMB GrowthValueHedge Fund ETEEQGP WGP OtherIndexIncome ENLC 35 65 Positi Investor $MM Chickasaw240.5 Tortoise63.4 Salient60.4 Advisory Re.59.0 Dimensional46.5 Total469.7 11 24 997689 Larger Institutional Ownership Among C-Corps 11 28 7210089 TRGP OKE WMB Investor $MM % TSO $MM % TSO $MM % TSO Tortoise 346.1 3.6 795.4 3.4 359.2 1.8 Fidelity16.00.27.40.0 1146.45.6 GSAM484.75.0 303.81.3 347.71.7 BlackRock29.80.380.30.3 494.62.4 Norges78.80.7 161.00.7 254.11.0 ETE EQGP WGP Investor $MM % TSO $MM % TSO $MM % TSO Neuberger 378.5 2.5 153.8 2.5 386.4 5.3 Chickasaw333.22.278.21.3 185.22.6 Tortoise454.63.039.40.638.80.5 Salient240.31.6--118.71.6 GSAM148.11.071.11.218.00.3 Total1554.810.1 342.65.6 747.110.3 Total966.828.3 Total955.39.8 1347.85.8 2602.012.4
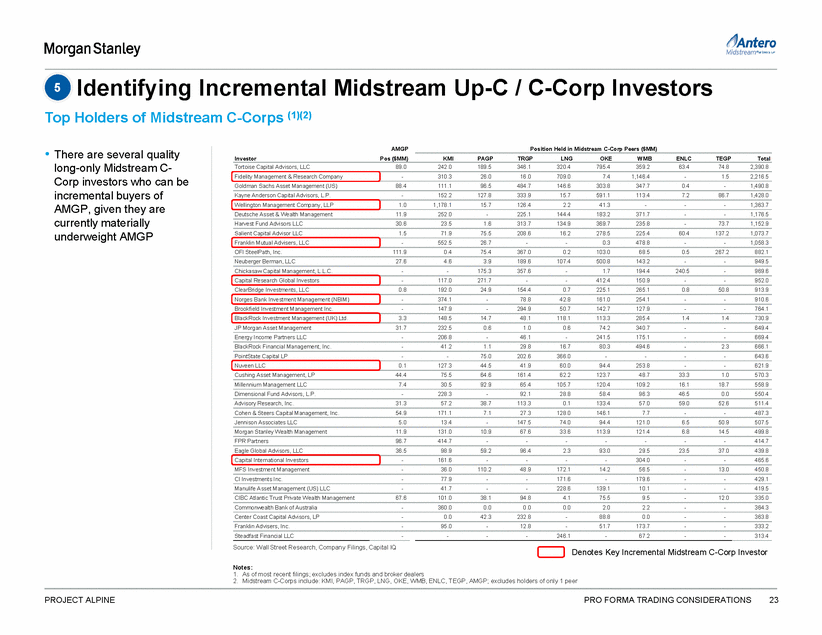
Identifying Incremental Midstream Up-C / C-Corp Investors 5 Top Holders of Midstream C-Corps (1)(2) AMGP Pos ($MM) Position Held in Midstream C-Corp Peers ($MM) • There are several quality long-only Midstream C-Corp investors who can be incremental buyers of AMGP, given they are currently materially underweight AMGP Investor KMI PAGP TRGP LNG OKE WMB ENLC TEGP Total Tortoise Capital Advisors, LLC 89.0 242.0 189.5 346.1 320.4 795.4 359.2 63.4 74.8 2,390.8 Fidelity Management & Research Company - 310.3 26.0 16.0 709.0 7.4 1,146.4 - 1.5 2,216.5 Goldman Sachs Asset Management (US) 88.4 111.1 96.5 484.7 146.6 303.8 347.7 0.4 - 1,490.8 Kayne Anderson Capital Advisors, L.P. - 152.2 127.8 333.9 15.7 591.1 113.4 7.2 86.7 1,428.0 Wellington Management Company, LLP 1.0 1,178.1 15.7 126.4 2.2 41.3 - - - 1,363.7 Deutsche Asset & Wealth Management 11.9 252.0 - 225.1 144.4 183.2 371.7 - - 1,176.5 Harvest Fund Advisors LLC 30.6 23.5 1.6 313.7 134.9 369.7 235.8 - 73.7 1,152.9 Salient Capital Advisor LLC 1.5 71.9 75.5 208.6 16.2 278.5 225.4 60.4 137.2 1,073.7 Franklin Mutual Advisers, LLC - 552.5 26.7 - - 0.3 478.8 - - 1,058.3 OFI SteelPath, Inc. 111.9 0.4 75.4 367.0 0.2 103.0 68.5 0.5 267.2 882.1 Neuberger Berman, LLC 27.6 4.6 3.9 189.6 107.4 500.8 143.2 - - 949.5 Chickasaw Capital Management, L.L.C. - - 175.3 357.6 - 1.7 194.4 240.5 - 969.6 Capital Research Global Investors - 117.0 271.7 - - 412.4 150.9 - - 952.0 ClearBridge Investments, LLC 0.8 192.0 24.9 154.4 0.7 225.1 265.1 0.8 50.8 913.9 Norges Bank Investment Management (NBIM) - 374.1 - 78.8 42.8 161.0 254.1 - - 910.6 Brookfield Investment Management Inc. - 147.9 - 294.9 50.7 142.7 127.9 - - 764.1 BlackRock Investment Management (UK) Ltd. 3.3 148.5 14.7 48.1 118.1 113.3 285.4 1.4 1.4 730.9 JP Morgan Asset Management 31.7 232.5 0.6 1.0 0.6 74.2 340.7 - - 649.4 Energy Income Partners LLC - 206.8 - 46.1 - 241.5 175.1 - - 669.4 BlackRock Financial Management, Inc. - 41.2 1.1 29.8 16.7 80.3 494.6 - 2.3 666.1 PointState Capital LP - - 75.0 202.6 366.0 - - - - 643.6 Nuveen LLC 0.1 127.3 44.5 41.9 60.0 94.4 253.8 - - 621.9 Cushing Asset Management, LP 44.4 75.5 64.6 161.4 62.2 123.7 48.7 33.3 1.0 570.3 Millennium Management LLC 7.4 30.5 92.9 65.4 105.7 120.4 109.2 16.1 18.7 558.9 Dimensional Fund Advisors, L.P. - 228.3 - 92.1 28.8 58.4 96.3 46.5 0.0 550.4 Advisory Research, Inc. 31.3 57.2 38.7 113.3 0.1 133.4 57.0 59.0 52.6 511.4 Cohen & Steers Capital Management, Inc. 54.9 171.1 7.1 27.3 128.0 146.1 7.7 - - 487.3 Jennison Associates LLC 5.0 13.4 - 147.5 74.0 94.4 121.0 6.5 50.9 507.5 Morgan Stanley Wealth Management 11.9 131.0 10.9 67.6 33.6 113.9 121.4 6.8 14.5 499.8 FPR Partners 96.7 414.7 - - - - - - - 414.7 Eagle Global Advisors, LLC 36.5 98.9 59.2 96.4 2.3 93.0 29.5 23.5 37.0 439.8 Capital International Investors - 161.6 - - - - 304.0 - - 465.6 MFS Investment Management - 36.0 110.2 48.9 172.1 14.2 56.5 - 13.0 450.8 CI Investments Inc. - 77.9 - - 171.6 - 179.6 - - 429.1 Manulife Asset Management (US) LLC - 41.7 - - 228.6 139.1 10.1 - - 419.5 CIBC Atlantic Trust Private Wealth Management 67.6 101.0 38.1 94.8 4.1 75.5 9.5 - 12.0 335.0 Commonwealth Bank of Australia - 360.0 0.0 0.0 0.0 2.0 2.2 - - 364.3 Center Coast Capital Advisors, LP - 0.0 42.3 232.8 - 88.8 0.0 - - 363.8 Franklin Advisers, Inc. - 95.0 - 12.8 - 51.7 173.7 - - 333.2 Steadfast Financial LLC - - - - 246.1 - 67.2 - - 313.4 Source: Wall Street Research, Company Filings, Capital IQ Denotes Key Incremental Midstream C-Corp Investor Notes: 1. As of most recent filings; excludes index funds and broker dealers 2. Midstream C-Corps include: KMI, PAGP, TRGP, LNG, OKE, WMB, ENLC, TEGP, AMGP; excludes holders of only 1 peer PROJECT ALPINE PRO FORMA TRADING CONSIDERATIONS 23
Legal Disclaimer We have prepared this document solely for informational purposes. You should not definitively rely upon it or use it to form the definitive basis for any decision, contract, commitment or action whatsoever, with respect to any proposed transaction or otherwise. You and your directors, officers, employees, agents and affiliates must hold this document and any oral information provided in connection with this document in strict confidence and may not communicate, reproduce, distribute or disclose it to any other person, or refer to it publicly, in whole or in part at any time except with our prior written consent. If you are not the intended recipient of this document, please delete and destroy all copies immediately. We have prepared this document and the analyses contained in it based, in part, on certain assumptions and information obtained by us from the recipient, its directors, officers, employees, agents, affiliates and/or from other sources. Our use of such assumptions and information does not imply that we have independently verified or necessarily agree with any of such assumptions or information, and we have assumed and relied upon the accuracy and completeness of such assumptions and information for purpos es of this document. Neither we nor any of our affiliates, or our or their respective officers, employees or agents, make any representation or warranty, express or implied, in relation to the accuracy or completeness of the information contained in this document or any oral information provided in connection herewith, or any data it generates and accept no responsibility, obligation or liability (whether direct or indirect, in contract, tort or otherwise) in relation to any of such information. We and our affiliates and our and their respective officers, employees and agents expressly disclaim any and all liability which may be based on this document and any errors therein or omissions therefrom. Neither we nor any of our affiliates, or our or their respective officers, employees or agents, make any representation or warranty, express or implied, that any transaction has been or may be effected on the terms or in the manner stated in this document, or as to the achievement or reasonableness of future projections, management targets, estimates, prospects or returns, if any. Any views or terms contained herein are preliminary only, and are based on financial, economic, market and other conditions prevailing as of the date of this document and are therefore subject to change. We undertake no obligation or responsibility to update any of the information contained in this document. Past performance does not guarantee or predict future performance. This document and the information contained herein do not constitute an offer to sell or the solicitation of an offer to buy any security, commodity or instrument or related derivative, nor do they constitute an offer or commitment to lend, syndicate or arrange a financing, underwrite or purchase or act as an agent or advisor or in any other capacity with respect to any transaction, or commit capital, or to participate in any trading strategies, and do not constitute legal, regulatory, accounting or tax advice to the recipient. We recommend that the recipient seek independent third party legal, regulatory, accounting and tax advice regarding the contents of this document. This document does not constitute and should not be considered as any form of financial opinion or recommendation by us or any of our affiliates. This document is not a research report and was not prepared by the research department of Morgan Stanley or any of its affiliates. Notwithstanding anything herein to the contrary, each recipient hereof (and their employees, representatives, and other agents) may disclose to any and all persons, without limitation of any kind from the commencement of discussions, the U.S. federal and state income tax treatment and tax structure of the proposed trans action and all materials of any kind (including opinions or other tax analyses) that are provided relating to the tax treatment and tax structure. For this purpose, "tax structure" is limited to facts relevant to the U.S. federal and state income tax treatment of the proposed transaction and does not include information relating to the identity of the parties, their affiliates, agents or advisors. This document is provided by Morgan Stanley & Co. LLC and/or certain of its affiliates or other applicable entities, which may include Morgan Stanley Realty Incorporated, Morgan Stanley Senior Funding, Inc., Morgan Stanley Bank, N.A., Morgan Stanley & Co. International plc, Morgan Stanley Securities Limited, Morgan Stanley Bank AG, Morgan Stanley MUFG Securities Co., Ltd., Mitsubishi UFJ Morgan Stanley Securities Co., Ltd., Morgan Stanley Asia Limited, Morgan Stanley Australia Securities Limited, Morgan Stanley Australia Limited, Morgan Stanley Asia (Singapore) Pte., Morgan Stanley Services Limited, Morgan Stanley & Co. International plc Seoul Branch and/or Morgan Stanley Canada Limited Unless governing law permits otherwise, you must contact an authorized Morgan Stanley entity in your jurisdiction regarding this document or any of the information contained herein. © Morgan Stanley and/or certain of its affiliates. All rights reserved. PROJECT ALPINE 24
