ProjectSlidingRock: ARSpecialCommittee Discussion M A R C H 2 2 , 2 0 1 8

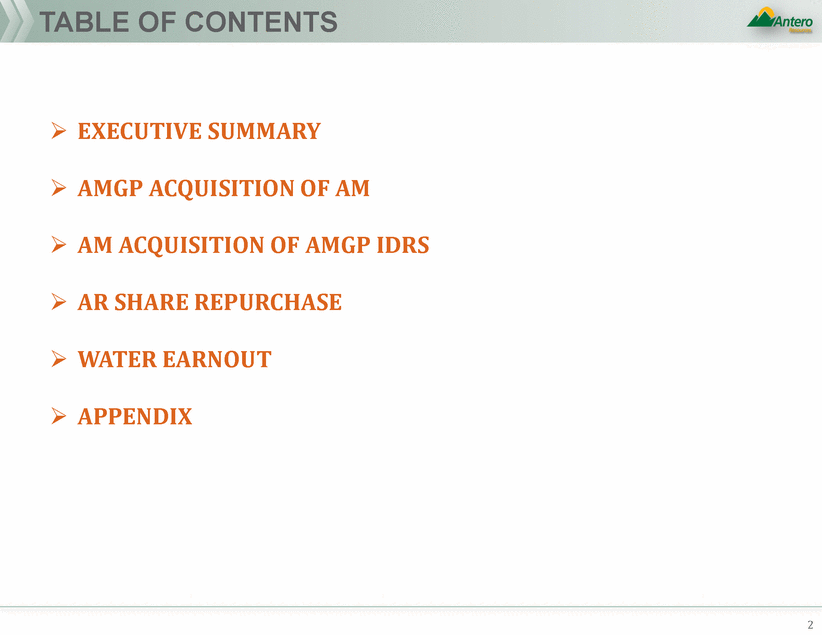
TABLE OF CONTENTS EXECUTIVE SUMMARY AMGP ACQUISITION OF AM AM ACQUISITION OF AMGP IDRS AR SHARE REPURCHASE WATER EARNOUT APPENDIX 2
ExecutiveSummary
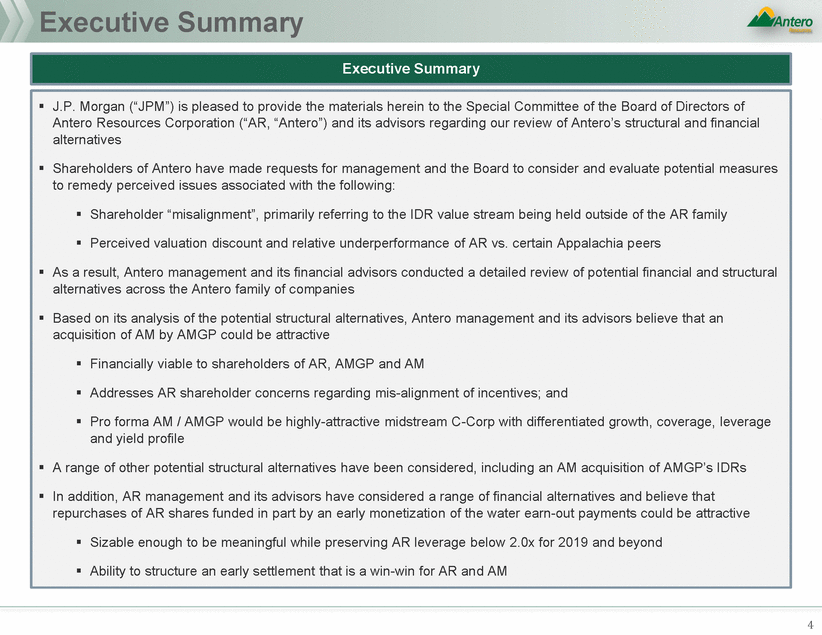
Executive Summary 4 J.P. Morgan (“JPM”) is pleased to provide the materials herein to the Special Committee of the Board of Directors of Antero Resources Corporation (“AR, “Antero”) and its advisors regarding our review of Antero’s structural and financial alternatives Shareholders of Antero have made requests for management and the Board to consider and evaluate potential measures to remedy perceived issues associated with the following: Shareholder “misalignment”, primarily referring to the IDR value stream being held outside of the AR family Perceived valuation discount and relative underperformance of AR vs. certain Appalachia peers As a result, Antero management and its financial advisors conducted a detailed review of potential financial and structural alternatives across the Antero family of companies Based on its analysis of the potential structural alternatives, Antero management and its advisors believe that an acquisition of AM by AMGP could be attractive Financially viable to shareholders of AR, AMGP and AM Addresses AR shareholder concerns regarding mis-alignment of incentives; and Pro forma AM / AMGP would be highly-attractive midstream C-Corp with differentiated growth, coverage, leverage and yield profile A range of other potential structural alternatives have been considered, including an AM acquisition of AMGP’s IDRs In addition, AR management and its advisors have considered a range of financial alternatives and believe that repurchases of AR shares funded in part by an early monetization of the water earn-out payments could be attractive Sizable enough to be meaningful while preserving AR leverage below 2.0x for 2019 and beyond Ability to structure an early settlement that is a win-win for AR and AM Executive Summary
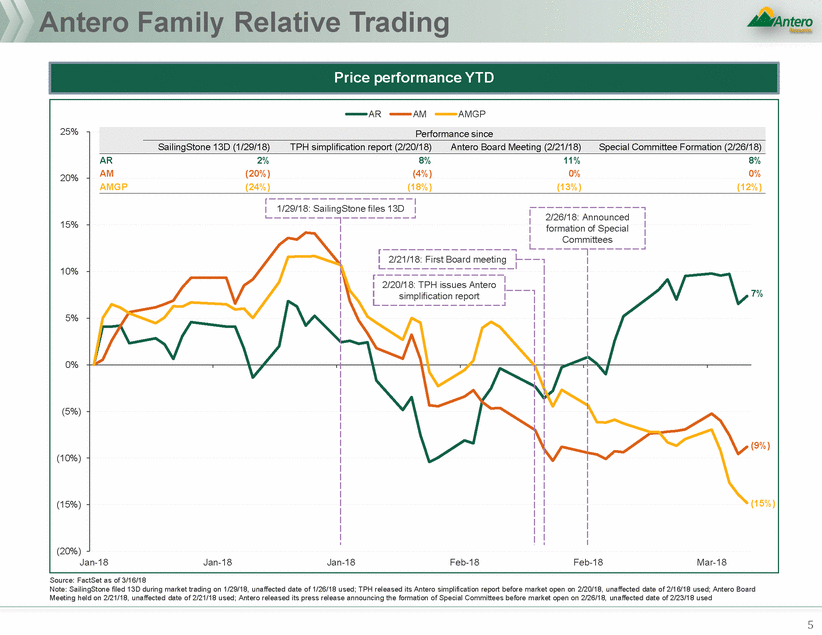
Antero Family Relative Trading Source: FactSet as of 3/16/18 Note: SailingStone filed 13D during market trading on 1/29/18, unaffected date of 1/26/18 used; TPH released its Antero simplification report before market open on 2/20/18, unaffected date of 2/16/18 used; Antero Board Meeting held on 2/21/18, unaffected date of 2/21/18 used; Antero released its press release announcing the formation of Special Committees before market open on 2/26/18, unaffected date of 2/23/18 used 5 ARAMAMGP 25% 8% 20%0% 15% 10% simplification report 5% 0% (5%) %) (10%) (15%)%) (20%) Jan-18Jan-18Jan-18Feb-18Feb-18Mar-18 Performance since SailingStone 13D (1/29/18)TPH simplification report (2/20/18)Antero Board Meeting (2/21/18)Special Committee Formation (2/26/18) AR2%8%11% AM(20%)(4%)0% %) 7% (9 (15 AMGP(24%)(18%)(13%)(12 1/29/18: SailingStone files 13D 2/26/18: Announced formation of Special Committees 2/21/18: First Board meeting 2/20/18: TPH issues Antero Price performance YTD
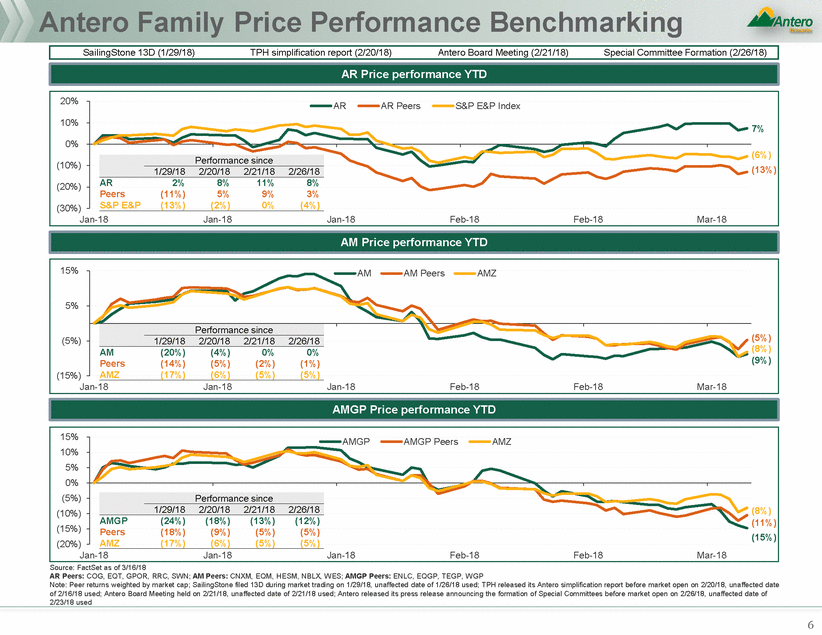
Antero Family Price Performance Benchmarking (10%) (13%) (8%) (11%) (15%) (20%) Source: FactSet as of 3/16/18 AR Peers: COG, EQT, GPOR, RRC, SWN; AM Peers: CNXM, EQM, HESM, NBLX, WES; AMGP Peers: ENLC, EQGP, TEGP, WGP Note: Peer returns weighted by market cap; SailingStone filed 13D during market trading on 1/29/18, unaffected date of 1/26/18 used; TPH released its Antero simplification report before market open on 2/20/18, unaffected date of 2/16/18 used; Antero Board Meeting held on 2/21/18, unaffected date of 2/21/18 used; Antero released its press release announcing the formation of Special Committees before market open on 2/26/18, unaffected date of 2/23/18 used 6 15% 10% 5% 0% (5%) (10%)(8%) (15%) Jan-18Jan-18Jan-18Feb-18Feb-18Mar-18 AMGPAMGP PeersAMZ Performance since 1/29/182/20/182/21/182/26/18 AMGP(24%)(18%)(13%)(12%) Peers(18%)(9%)(5%)(5%) AMZ (17%) (6%) (5%) (5%) AMGP Price performance YTD 15% 5% (5%)(5%) (9%) (15%)AMZ (17%) (6%) (5%) (5%) Jan-18Jan-18Jan-18Feb-18Feb-18Mar-18 AMAM PeersAMZ Performance since 1/29/182/20/182/21/182/26/18 AM(20%)(4%)0%0% Peers(14%)(5%)(2%)(1%) AM Price performance YTD 20% 10%7% 0% (6%) (20%) (30%) Jan-18Jan-18Jan-18Feb-18Feb-18Mar-18 ARAR PeersS&P E&P Index Performance since 1/29/182/20/182/21/182/26/18 AR2%8%11%8% Peers(11%)5%9% 3% S&P E&P (13%) (2%) 0% (4%) AR Price performance YTD SailingStone 13D (1/29/18)TPH simplification report (2/20/18)Antero Board Meeting (2/21/18)Special Committee Formation (2/26/18)
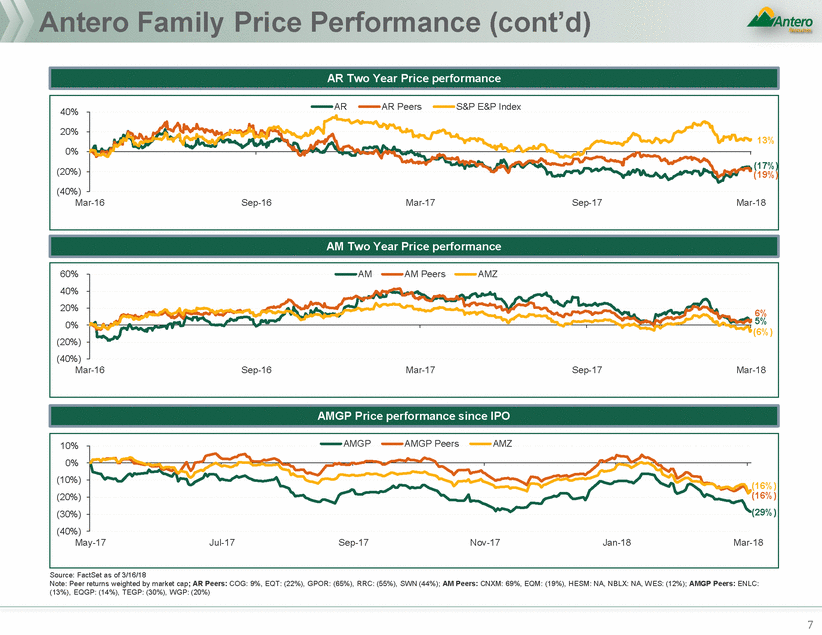
Antero Family Price Performance (cont’d) 13% (19%) 5% 0% Source: FactSet as of 3/16/18 Note: Peer returns weighted by market cap; AR Peers: COG: 9%, EQT: (22%), GPOR: (65%), RRC: (55%), SWN (44%); AM Peers: CNXM: 69%, EQM: (19%), HESM: NA, NBLX: NA, WES: (12%); AMGP Peers: ENLC: (13%), EQGP: (14%), TEGP: (30%), WGP: (20%) 7 10%AMGPAMGP PeersAMZ 0% (10%)(16%) (20%)(16%) (30%)(29%) (40%) May-17Jul-17Sep-17Nov-17Jan-18Mar-18 AMAGMPGPPriPcericpeerpfoermoarmncaencseinYcTeDIPO 60%AMAM PeersAMZ 40% 20%6% (6%) (20%) (40%) Mar-16Sep-16Mar-17Sep-17Mar-18 AMATMwPorYiceeapr ePrrfiocrempaenrcfoerYmTaDnce 40%ARAR PeersS&P E&P Index 20% 0% (20%)(17%) (40%) Mar-16Sep-16Mar-17Sep-17Mar-18 ARATRwPorYiceeapr ePrrfiocrempaenrcfoerYmTaDnce
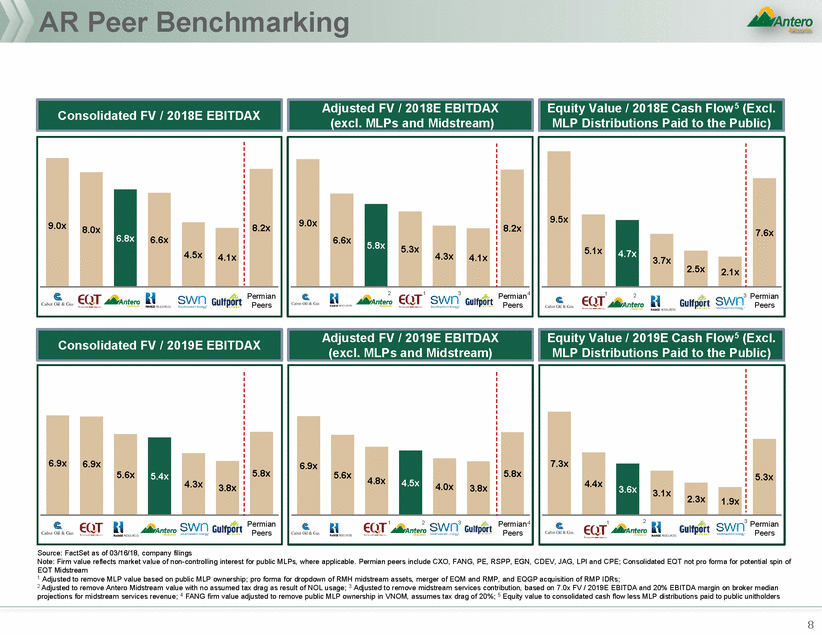
AR Peer Benchmarking MLP Distributions Paid to the Public) MLP Distributions Paid to the Public) Source: FactSet as of 03/16/18, company filings Note: Firm value reflects market value of non-controlling interest for public MLPs, where applicable. Permian peers include CXO, FANG, PE, RSPP, EGN, CDEV, JAG, LPI and CPE; Consolidated EQT not pro forma for potential spin of EQT Midstream 1 Adjusted to remove MLP value based on public MLP ownership; pro forma for dropdown of RMH midstream assets, merger of EQM and RMP, and EQGP acquisition of RMP IDRs; 2 Adjusted to remove Antero Midstream value with no assumed tax drag as result of NOL usage; 3 Adjusted to remove midstream services contribution, based on 7.0x FV / 2019E EBITDA and 20% EBITDA margin on broker median projections for midstream services revenue; 4 FANG firm value adjusted to remove public MLP ownership in VNOM, assumes tax drag of 20%; 5 Equity value to consolidated cash flow less MLP distributions paid to public unitholders 8 Equity Value / 2019E Cash Flow5 (Excl. 123 Permian Peers 7.3x 5.3x 4.4x 3.6x 3.1x 2.3x 1.9x Consolidated FV / 2019E EBITDAX Permian Peers 6.9x 6.9x 5.6x 5.8x 5.4x 4.3x 3.8x Adjusted FV / 2019E EBITDAX (excl. MLPs and Midstream) 3.8x 123Permian 4 Peers 6.9x 5.6x 5.8x 4.8x 4.5x 4.0x 123 Permian Peers 9.5x 7.6x 5.1x 4.7x 3.7x 2.5x 2.1x Permian Peers 9.0x 8.2x 8.0x 6.8x 6.6x 4.5x 4.1x 213Permian 4 Peers 9.0x 8.2x 6.6x 5.8x 5.3x 4.3x 4.1x Equity Value / 2018E Cash Flow5 (Excl. Adjusted FV / 2018E EBITDAX (excl. MLPs and Midstream) Consolidated FV / 2018E EBITDAX
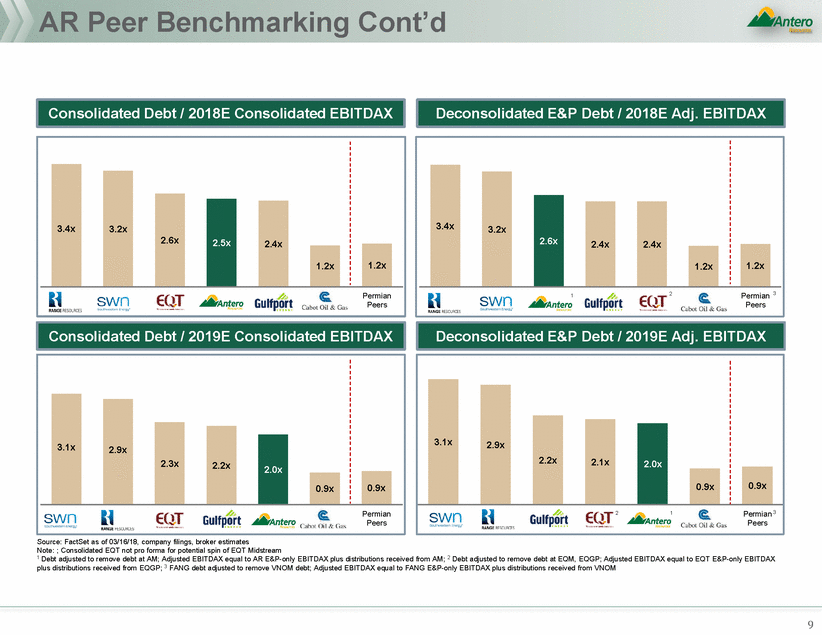
AR Peer Benchmarking Cont’d Source: FactSet as of 03/16/18, company filings, broker estimates Note: ; Consolidated EQT not pro forma for potential spin of EQT Midstream 1 Debt adjusted to remove debt at AM; Adjusted EBITDAX equal to AR E&P-only EBITDAX plus distributions received from AM; 2 Debt adjusted to remove debt at EQM, EQGP; Adjusted EBITDAX equal to EQT E&P-only EBITDAX plus distributions received from EQGP; 3 FANG debt adjusted to remove VNOM debt; Adjusted EBITDAX equal to FANG E&P-only EBITDAX plus distributions received from VNOM 9 3.1x 2.9x 2.3x 2.2x 2.0x 0.9x 0.9x Permian Peers 3.1x 2.9x 2.2x 2.1x 2.0x 0.9x 0.9x 21Permian 3 Peers Consolidated Debt / 2019E Consolidated EBITDAX Deconsolidated E&P Debt / 2019E Adj. EBITDAX 3.4x 3.2x 2.6x 2.5x 2.4x 1.2x 1.2x Permian Peers 3.4x 3.2x 2.6x 2.4x 2.4x 1.2x 1.2x 12Permian 3 Peers Deconsolidated E&P Debt / 2018E Adj. EBITDAX Consolidated Debt / 2018E Consolidated EBITDAX
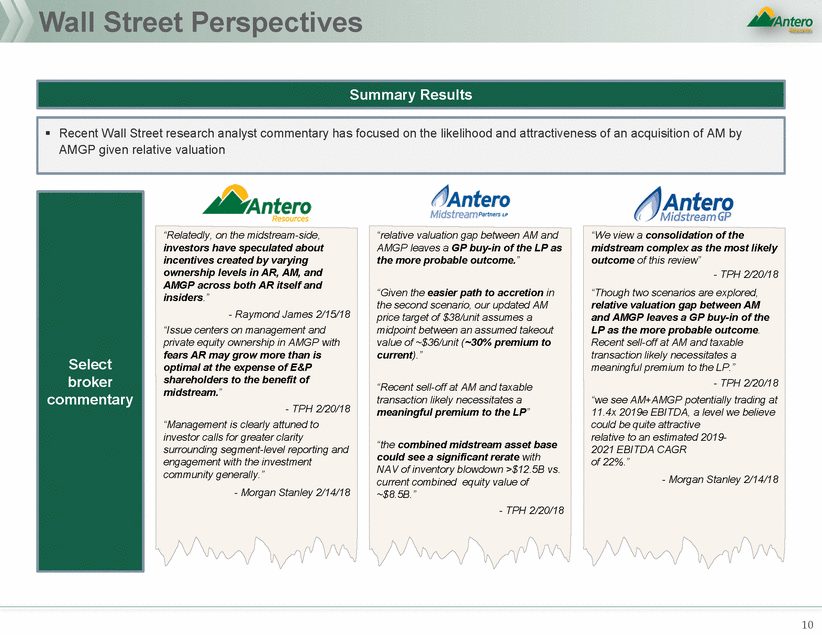
Wall Street Perspectives “Relatedly, on the midstream-side, investors have speculated about incentives created by varying ownership levels in AR, AM, and AMGP across both AR itself and insiders.” - Raymond James 2/15/18 “Issue centers on management and private equity ownership in AMGP with fears AR may grow more than is optimal at the expense of E&P shareholders to the benefit of midstream.” - TPH 2/20/18 “Management is clearly attuned to investor calls for greater clarity surrounding segment-level reporting and engagement with the investment community generally.” - Morgan Stanley 2/14/18 “relative valuation gap between AM and AMGP leaves a GP buy-in of the LP as the more probable outcome.” “We view a consolidation of the midstream complex as the most likely outcome of this review” - TPH 2/20/18 “Though two scenarios are explored, relative valuation gap between AM and AMGP leaves a GP buy-in of the LP as the more probable outcome. Recent sell-off at AM and taxable transaction likely necessitates a meaningful premium to the LP.” - TPH 2/20/18 “we see AM+AMGP potentially trading at 11.4x 2019e EBITDA, a level we believe could be quite attractive relative to an estimated 2019-2021 EBITDA CAGR of 22%.” - Morgan Stanley 2/14/18 “Given the easier path to accretion in the second scenario, our updated AM price target of $38/unit assumes a midpoint between an assumed takeout value of ~$36/unit (~30% premium to current).” “Recent sell-off at AM and taxable transaction likely necessitates a meaningful premium to the LP” “the combined midstream asset base could see a significant rerate with NAV of inventory blowdown >$12.5B vs. current combined equity value of ~$8.5B.” - TPH 2/20/18 10 Select broker commentary Recent Wall Street research analyst commentary has focused on the likelihood and attractiveness of an acquisition of AM by AMGP given relative valuation Summary Results
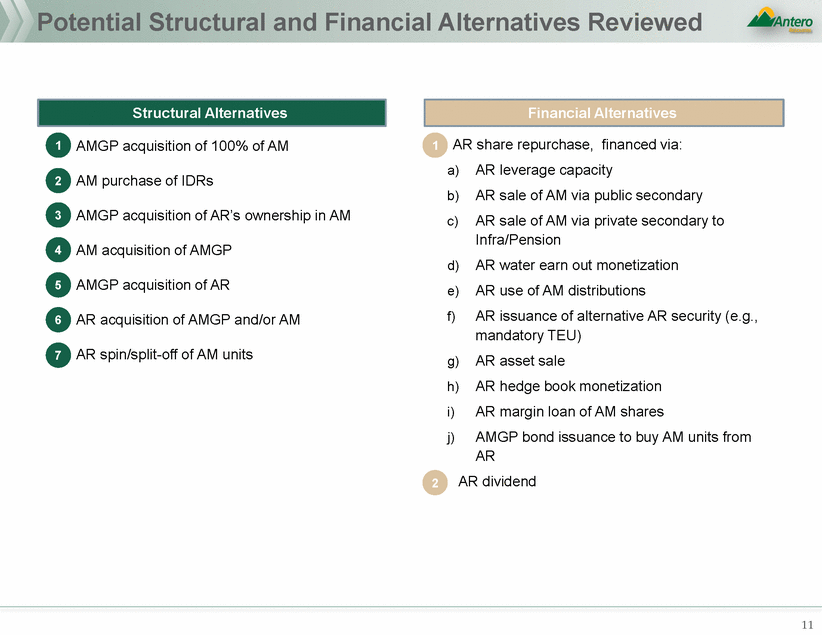
Potential Structural and Financial Alternatives Reviewed AR share repurchase, financed via: AMGP acquisition of 100% of AM 1 1 AR leverage capacity AR sale of AM via public secondary AR sale of AM via private secondary to Infra/Pension AR water earn out monetization AR use of AM distributions AR issuance of alternative AR security (e.g., mandatory TEU) AR asset sale AR hedge book monetization AR margin loan of AM shares AMGP bond issuance to buy AM units from AR a) b) c) AM purchase of IDRs 2 AMGP acquisition of AR’s ownership in AM 3 4 AM acquisition of AMGP d) e) f) AMGP acquisition of AR 5 6 AR acquisition of AMGP and/or AM AR spin/split-off of AM units 7 g) h) i) j) AR dividend a2) 11 Financial Alternatives Structural Alternatives
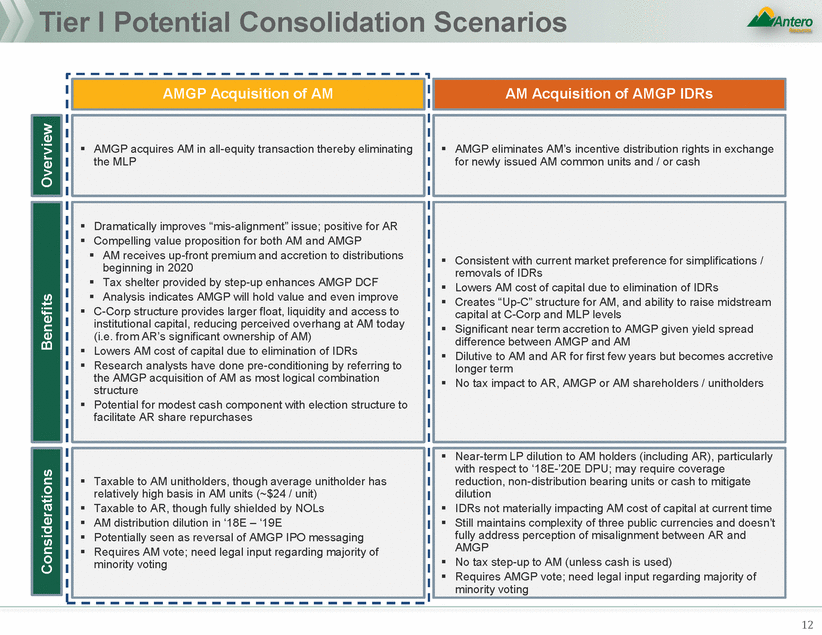
Tier I Potential Consolidation Scenarios removals of IDRs Creates “Up-C” structure for AM, and ability to raise midstream Significant near term accretion to AMGP given yield spread Dilutive to AM and AR for first few years but becomes accretive No tax impact to AR, AMGP or AM shareholders / unitholders AMGP 12 Near-term LP dilution to AM holders (including AR), particularly with respect to ‘18E-’20E DPU; may require coverage reduction, non-distribution bearing units or cash to mitigate dilution IDRs not materially impacting AM cost of capital at current time Still maintains complexity of three public currencies and doesn’t fully address perception of misalignment between AR and No tax step-up to AM (unless cash is used) Requires AMGP vote; need legal input regarding majority of minority voting Considerations Consistent with current market preference for simplifications / Lowers AM cost of capital due to elimination of IDRs capital at C-Corp and MLP levels difference between AMGP and AM longer term Benefits AMGP eliminates AM’s incentive distribution rights in exchange for newly issued AM common units and / or cash Overview AM Acquisition of AMGP IDRs Taxable to AM unitholders, though average unitholder has relatively high basis in AM units (~$24 / unit) Taxable to AR, though fully shielded by NOLs AM distribution dilution in ‘18E – ‘19E Potentially seen as reversal of AMGP IPO messaging Requires AM vote; need legal input regarding majority of minority voting Dramatically improves “mis-alignment” issue; positive for AR Compelling value proposition for both AM and AMGP AM receives up-front premium and accretion to distributions beginning in 2020 Tax shelter provided by step-up enhances AMGP DCF Analysis indicates AMGP will hold value and even improve C-Corp structure provides larger float, liquidity and access to institutional capital, reducing perceived overhang at AM today (i.e. from AR’s significant ownership of AM) Lowers AM cost of capital due to elimination of IDRs Research analysts have done pre-conditioning by referring to the AMGP acquisition of AM as most logical combination structure Potential for modest cash component with election structure to facilitate AR share repurchases AMGP acquires AM in all-equity transaction thereby eliminating the MLP AMGP Acquisition of AM
Tier II Potential Consolidation Scenarios AR no longer public shareholders given dramatically different assets objectives 1 Assumes 100% equity transaction with illustrative 0% premium on AM unit price as of 3/16/18 13 “Integrated Gas” business model MGP issues shares to buy AR Or AR issues shares (or AM units) to current AMGP Issue AM units AM consolidated simultaneously Fully eliminates mis-alignment concerns Uses AMGP’s comparably higher valuation Creates a more liquid currency for future M&A Existing AMGP shareholders are unlikely to be supportive Highly dilutive to AR Co-mingles shareholder bases with notably different AMGP issues shares to AR for its 53% stake in AM Preserves all 3 public entities Pro forma AR would own ~46%1 of AMGP; AMGP would own IDRs and 53% of AM AR owns largest stake in AMGP (~46%)1; improves alignment Basis step-up Source of funding for AR deleveraging or share repurchase Taxable to AR, though fully shielded via NOLs Does not eliminate IDRs for AM Reduces near-term cash flow to AR Leaves 3 public entities outstanding Overview Benefits Considerations Merge AR and AMGP AMGP Acquisition of AR’s Interest in AM
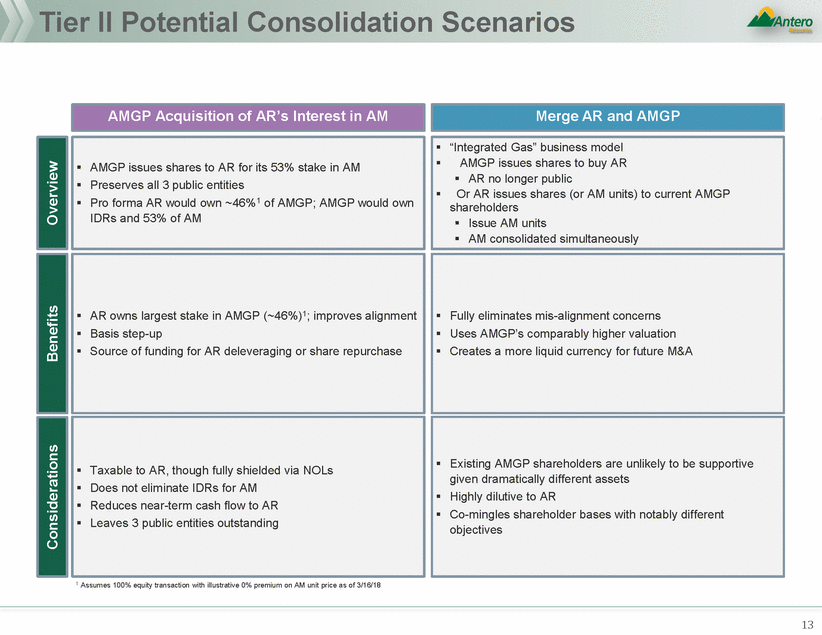
Tier II Potential Consolidation Scenarios Cont’d contributed to C-Corp) addressing SOTP discount issues Split may be challenging if units contributed to C-Corp basis simultaneously repurchased) currencies Premium is required to entice AR shareholders to exchange Utilize AR’s tax assets if units not contributed to C-Corp 14 Does not address market preference for IDR elimination (unless Still maintains complexity of three (and potentially four) public Potentially exacerbates market’s perceived misalignment between AR and AMGP Limits balance sheet / capital structure flexibility for AR by removing dividends received by AM May require access to public markets to fund drilling program their shares for AM shares IDRs not materially impacting AM cost of capital at current time Inconsistent with the structure employed by recent GP / MLP simplifications Does not address concerns regarding MLP liquidity and capital market access Tax inefficient to have MLP acquire C-Corp Only one precedent in market where MLP acquired C-Corp IDR holder and may not be well received Near term LP dilution to AM holders (including AR) Considerations Potentially tax efficient, depending on structure (if units Full clarity around AR and AM value in the public markets Preserves optionality to address IDRs / AM cost of capital when IDRs are more substantial and dilution is less pronounced Cashless retirement of AR shares in the case of split May be able to merge SpinCo with AMGP on a tax-efficient Benefits Consistent with current market preference for simplifications / removals of IDRs Improves alignment between AR and AMGP / owners Lowers AM cost of capital due to elimination of IDRs Maintains upstream and midstream vehicles to raise capital Simplification without near-term tax burden to AR and AM unitholders No tax impact to AR or AM shareholders / unitholders AR distributes AM units pro rata to its shareholders AR shareholders can enter into split-off transaction by exchanging AR shares for AM units AM acquires AMGP in exchange for AM units and / or cash Extinguishment of AM’s IDRs with AMGP becoming a wholly owned subsidiary of AM Overview AR Spin / Split-off of AM Units AM Acquisition of AMGP
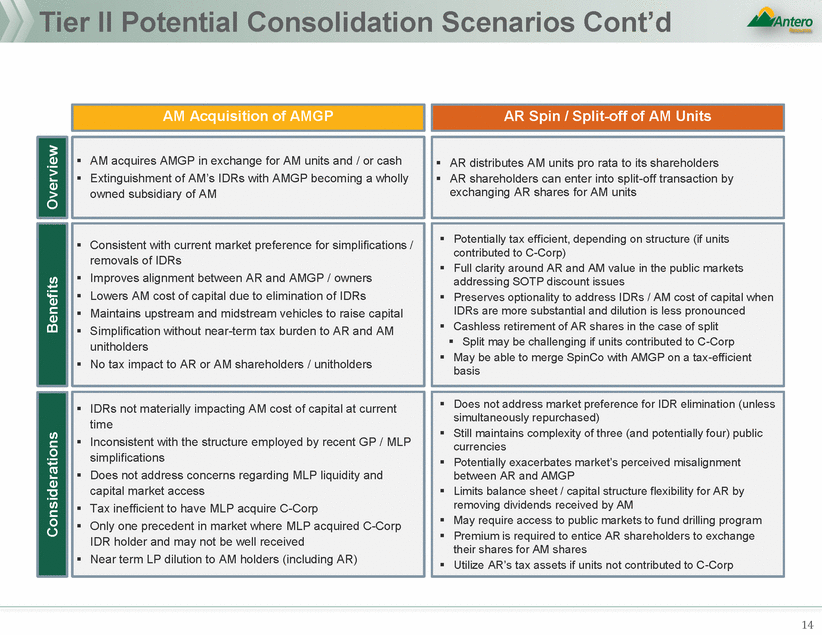
Antero Alternatives Evaluation Material Return of Capital Delever Balance Sheet and Partially Fund Repurchase Eliminate IDR Structure / Conflict of Interest More Independent AR Board Attractive 1 Somewhat Attractive 1Not Attractive 15 Improved AR Valuation •Add More Independents as PEs Roll Off •1 AMGP Shares Swapped For AR’s AM Units •1 AMGP Buys AM Units •1 AM Buys IDRs •1 AM Buys AMGP •1 3-Way Merger – “Integrated Gas Company” •1 AMGP Buys AR •1 AR Buys AMGP / AM •1 Sell Non-Core Acreage •1 Sell AM Units to Infrastructure Fund •1 Sell AM Units to Public •1 Monetize Hedges $500MM+ share buyback capping leverage at 2.5x Bring forward contingent water business payment Propose AMGP acquire AM for stock / cash Rick Connor becomes fully independent post-merger of AMGP / AM (4 of 9 fully independent) Potential Recommendation Other Ideas AR Shareholder Input
AMGPAcquisition ofAM
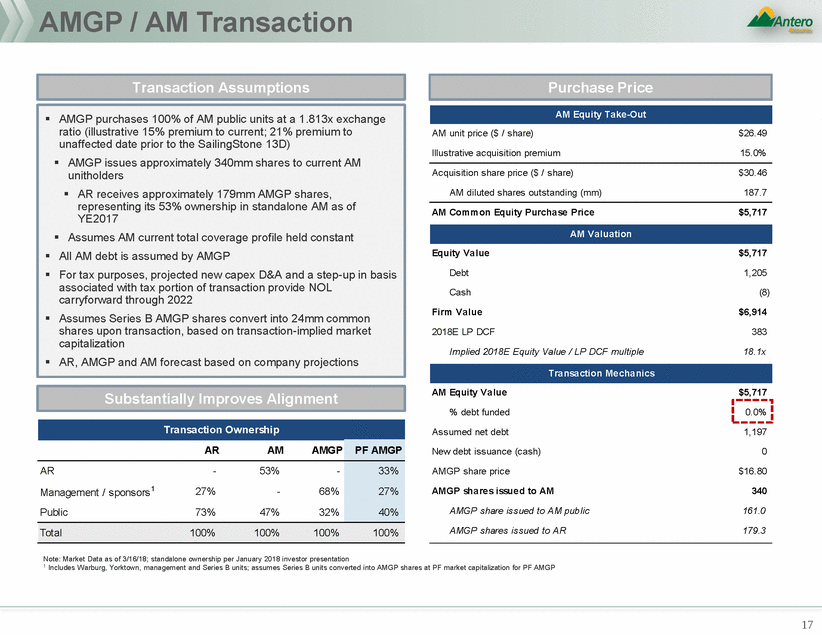
AMGP / AM Transaction AM unit price ($ / share) $26.49 Illustrative acquisition premium 15.0% Acquisition share price ($ / share) $30.46 AM diluted shares outstanding (mm) 187.7 AM Common Equity Purchase Price $5,717 Equity Value $5,717 Debt 1,205 Cash (8) Firm Value $6,914 2018E LP DCF 383 Implied 2018E Equity Value / LP DCF multiple 18.1x AM Equity Value $5,717 % debt funded Assumed net debt 1,197 New debt issuance (cash) 0 AMGP share price $16.80 AMGP shares issued to AM 340 AMGP share issued to AM public 161.0 AMGP shares issued to AR 179.3 Note: Market Data as of 3/16/18; standalone ownership per January 2018 investor presentation 1 Includes Warburg, Yorktown, management and Series B units; assumes Series B units converted into AMGP shares at PF market capitalization for PF AMGP 17 Transaction Ownership ARAMAMGP PF AMGP AR-53%-Management / sponsors127%-68% Public73%47%32% 33% 27% 40% Total100%100%100%100% 0.0% Substantially Improves Alignment Transaction Mechanics AM Valuation AM Equity Take-Out AMGP purchases 100% of AM public units at a 1.813x exchange ratio (illustrative 15% premium to current; 21% premium to unaffected date prior to the SailingStone 13D) AMGP issues approximately 340mm shares to current AM unitholders AR receives approximately 179mm AMGP shares, representing its 53% ownership in standalone AM as of YE2017 Assumes AM current total coverage profile held constant All AM debt is assumed by AMGP For tax purposes, projected new capex D&A and a step-up in basis associated with tax portion of transaction provide NOL carryforward through 2022 Assumes Series B AMGP shares convert into 24mm common shares upon transaction, based on transaction-implied market capitalization AR, AMGP and AM forecast based on company projections Purchase Price Transaction Assumptions
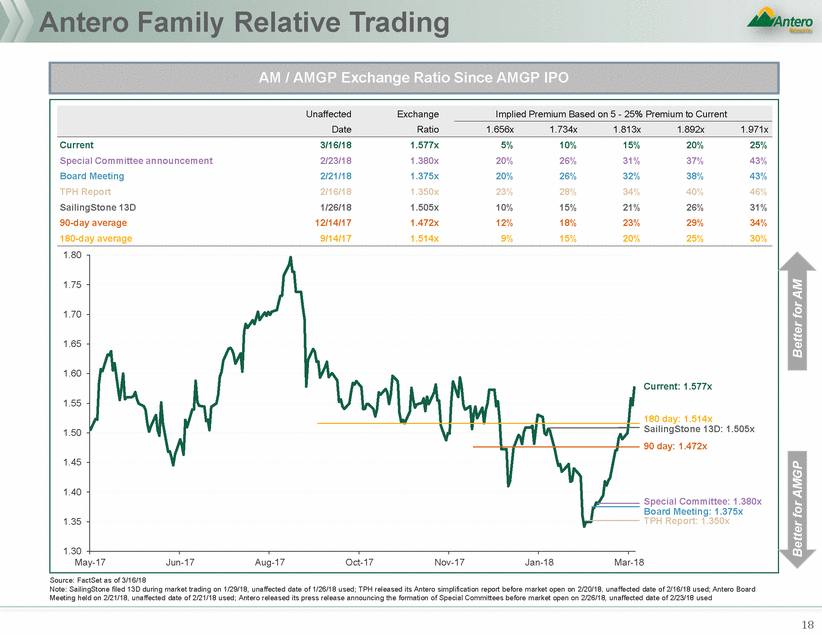
Antero Family Relative Trading Source: FactSet as of 3/16/18 Note: SailingStone filed 13D during market trading on 1/29/18, unaffected date of 1/26/18 used; TPH released its Antero simplification report before market open on 2/20/18, unaffected date of 2/16/18 used; Antero Board Meeting held on 2/21/18, unaffected date of 2/21/18 used; Antero released its press release announcing the formation of Special Committees before market open on 2/26/18, unaffected date of 2/23/18 used 18 Better for AMGP Better for AM Current 3/16/18 1.577x 5% 10% 15% 20% 25% Special Committee announcement 2/23/18 1.380x 20% 26% 31% 37% 43% Board Meeting 2/21/18 1.375x 20% 26% 32% 38% 43% TPH Report 2/16/18 1.350x 23% 28% 34% 40% 46% SailingStone 13D 1/26/18 1.505x 10% 15% 21% 26% 31% 90-day average 12/14/17 1.472x 12% 18% 23% 29% 34% 180-day average 9/14/17 1.514x 9% 15% 20% 25% 30% 1.80 1.75 1.70 1.65 1.60 Current: 1.577x 1.55 180 day: 1.514x 1.50 SailingStone 13D: 1.505x 90 day: 1.472x 1.45 1.40 Special Committee: 1.380x Board Meeting: 1.375x 1.35 TPH Report: 1.350x 1.30 May-17Jun-17Aug-17Oct-17Nov-17Jan-18Mar-18 UnaffectedExchange DateRatio Implied Premium Based on 5 - 25% Premium to Current 1.656x1.734x1.813x1.892x1.971x AM / AMGP Exchange Ratio Since AMGP IPO
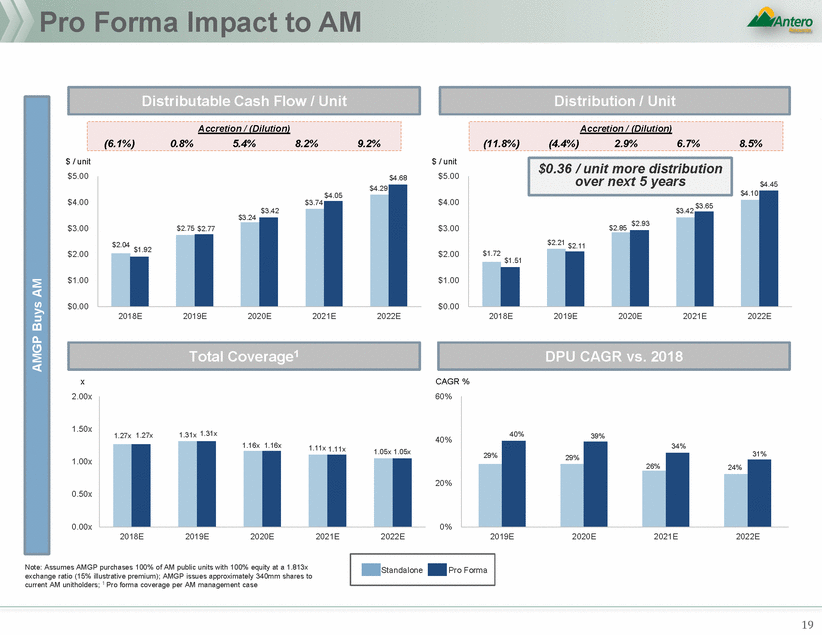
Pro Forma Impact to AM $ / unit $5.00 $ / unit $5.00 $4.68 $4.29 $4.05 $4.00 $4.00 $3.42 $3.24 $3.00 $3.00 $2.00 $2.00 $1.51 $1.00 $1.00 $0.00 $0.00 2018E 2019E 2020E 2021E 2022E 2018E 2019E 2020E 2021E 2022E x 2.00x CAGR % 60% 1.50x 40% 1.16x 1.16x 1.11x 1.11x 1.05x 1.05x 1.00x 20% 0.50x 0.00x 0% 2018E 2019E 2020E 2021E 2022E 2019E 2020E 2021E 2022E Note: Assumes AMGP purchases 100% of AM public units with 100% equity at a 1.813x exchange ratio (15% illustrative premium); AMGP issues approximately 340mm shares to current AM unitholders; 1 Pro forma coverage per AM management case 19 StandalonePro Forma 1.27x 1.27x1.31x 1.31x 40%39% 29% 29% 34% 26% 31% 24% DPU CAGR vs. 2018 Total Coverage1 $4.45 $4.10 $3.65 $2.85 $2.93 $2.21 $2.11 $1.72 $3.74 $3.42 $2.75 $2.77 $2.04 $1.92 $0.36 / unit more distribution over next 5 years Accretion / (Dilution) (11.8%)(4.4%)2.9%6.7%8.5% Accretion / (Dilution) (6.1%)0.8%5.4%8.2%9.2% AMGP Buys AM Distribution / Unit Distributable Cash Flow / Unit
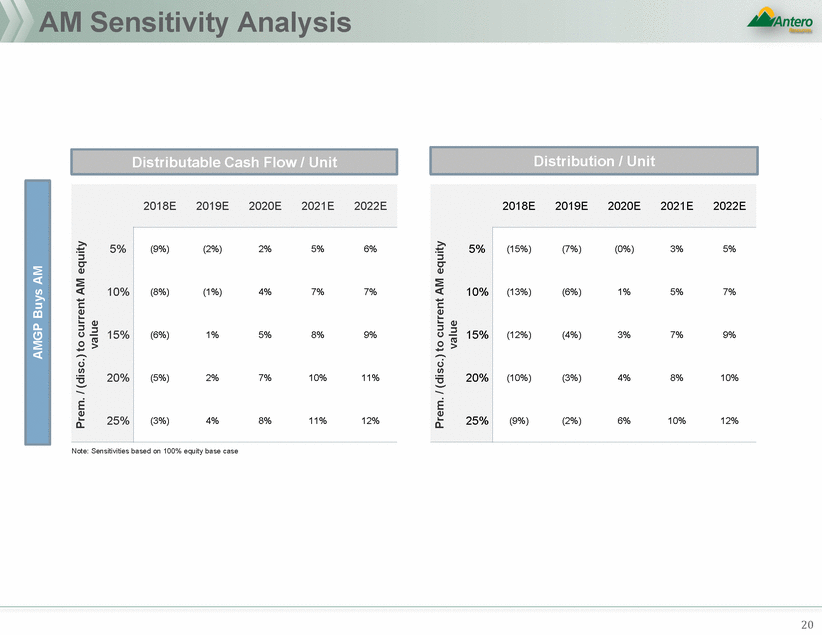
AM Sensitivity Analysis Note: Sensitivities based on 100% equity base case 20 Prem. / (disc.) to current AM equity value Prem. / (disc.) to current AM equity value 2018E2019E2020E2021E2022E 5% 10% 15% 20% 25% (15%) (7%) (0%) 3% 5% (13%) (6%) 1% 5% 7% (12%) (4%) 3% 7% 9% (10%) (3%) 4% 8% 10% (9%) (2%) 6% 10% 12% 2018E2019E2020E2021E2022E 5% 10% 15% 20% 25% (9%) (2%) 2% 5% 6% (8%) (1%) 4% 7% 7% (6%) 1% 5% 8% 9% (5%) 2% 7% 10% 11% (3%) 4% 8% 11% 12% Distribution / Unit Distributable Cash Flow / Unit
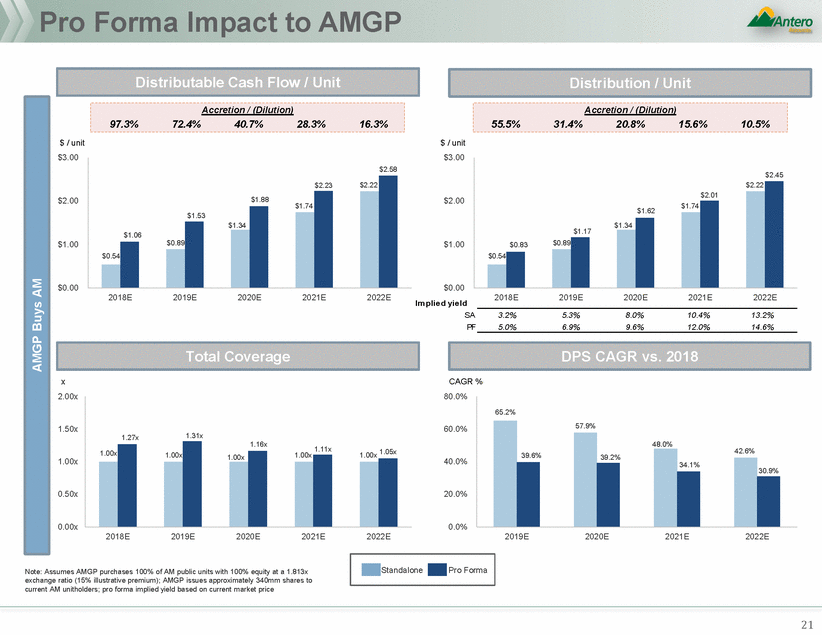
Pro Forma Impact to AMGP $ / unit $3.00 $ / unit $3.00 $2.00 $2.00 $1.62 $1.00 $1.00 $0.00 $0.00 Im plie d yie ld 2018E 2019E 2020E 2021E 2022E 2018E 2019E 2020E 2021E 2022E SA PF 3.2% 5.0% 5.3% 6.9% 8.0% 9.6% 10.4% 12.0% 13.2% 14.6% x 2.00x CAGR % 80.0% 1.50x 60.0% 1.00x 1.05x 1.00x 1.00x 1.00x 40.0% 0.50x 20.0% 0.00x 0.0% 2018E 2019E 2020E 2021E 2022E 2019E 2020E 2021E 2022E Note: Assumes AMGP purchases 100% of AM public units with 100% equity at a 1.813x exchange ratio (15% illustrative premium); AMGP issues approximately 340mm shares to current AM unitholders; pro forma implied yield based on current market price 21 StandalonePro Forma 1.27x1.31x 1.00x 1.16x1.11x 1.00x 65.2% 57.9% 39.6% 48.0% 39.2% 42.6% 34.1% 30.9% DPS CAGR vs. 2018 Total Coverage $2.45 $2.22 $2.01 $1.74 $1.34 $1.17 $0.83$0.89 $0.54 $2.58 $2.23$2.22 $1.88$1.74 $1.53 $1.06 $1.34 $0.54 $0.89 Accretion / (Dilution) 55.5%31.4%20.8%15.6%10.5% Accretion / (Dilution) 97.3%72.4%40.7%28.3%16.3% AMGP Buys AM Distribution / Unit Distributable Cash Flow / Unit
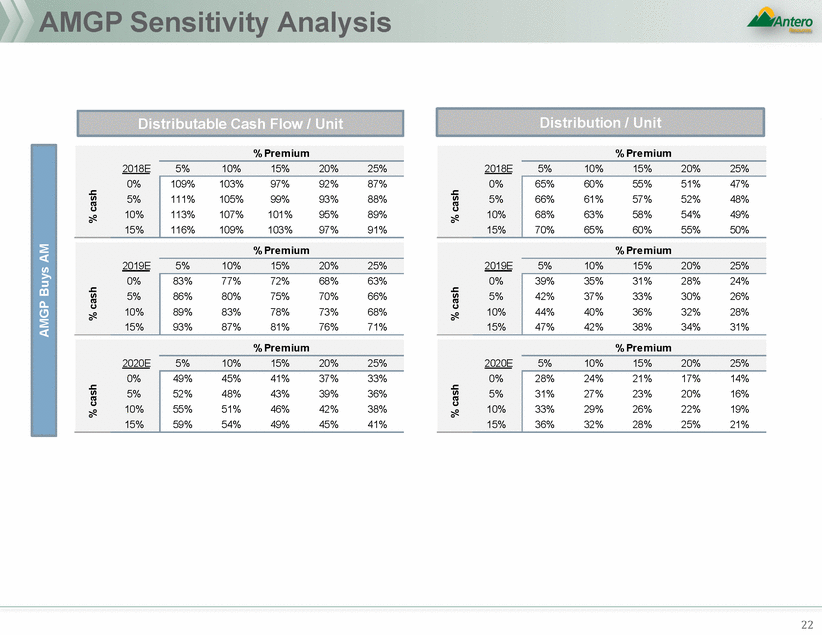
AMGP Sensitivity Analysis 22 % cash % cash % cash % cash % cash % cash 2020E % Pre m ium 5%10%15%20%25% 0% 5% 10% 15% 28%24%21%17%14% 31%27%23%20%16% 33%29%26%22%19% 36%32%28%25%21% 2020E % Pre m ium 5%10%15%20%25% 0% 5% 10% 15% 49%45%41%37%33% 52%48%43%39%36% 55%51%46%42%38% 59%54%49%45%41% 2019E % Pre m ium 5%10%15%20%25% 0% 5% 10% 15% 39%35%31%28%24% 42%37%33%30%26% 44%40%36%32%28% 47%42%38%34%31% 2019E % Pre m ium 5%10%15%20%25% 0% 5% 10% 15% 83%77%72%68%63% 86%80%75%70%66% 89%83%78%73%68% 93%87%81%76%71% 2018E % Pre m ium 5%10%15%20%25% 0% 5% 10% 15% 65%60%55%51%47% 66%61%57%52%48% 68%63%58%54%49% 70%65%60%55%50% 2018E % Pre m ium 5%10%15%20%25% 0% 5% 10% 15% 109%103%97%92%87% 111%105%99%93%88% 113%107%101%95%89% 116%109%103%97%91% AMGP Buys AM Distribution / Unit Distributable Cash Flow / Unit
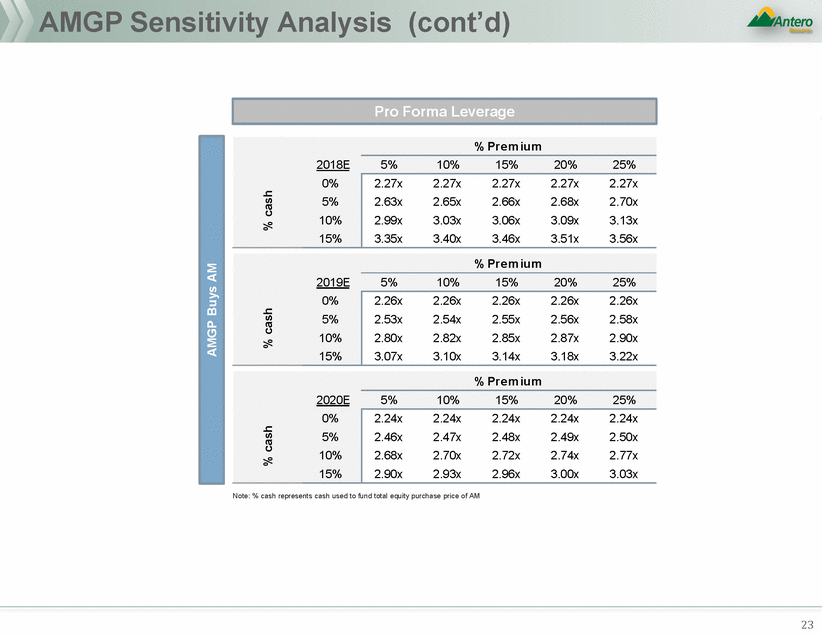
AMGP Sensitivity Analysis (cont’d) Note: % cash represents cash used to fund total equity purchase price of AM 23 % cash % cash % cash 2020E % Pre m ium 5%10%15%20%25% 0% 5% 10% 15% 2.24x2.24x2.24x2.24x2.24x 2.46x2.47x2.48x2.49x2.50x 2.68x2.70x2.72x2.74x2.77x 2.90x2.93x2.96x3.00x3.03x 2019E % Pre m ium 5%10%15%20%25% 0% 5% 10% 15% 2.26x2.26x2.26x2.26x2.26x 2.53x2.54x2.55x2.56x2.58x 2.80x2.82x2.85x2.87x2.90x 3.07x3.10x3.14x3.18x3.22x 2018E % Pre m ium 5%10%15%20%25% 0% 5% 10% 15% 2.27x2.27x2.27x2.27x2.27x 2.63x2.65x2.66x2.68x2.70x 2.99x3.03x3.06x3.09x3.13x 3.35x3.40x3.46x3.51x3.56x AMGP Buys AM Pro Forma Leverage
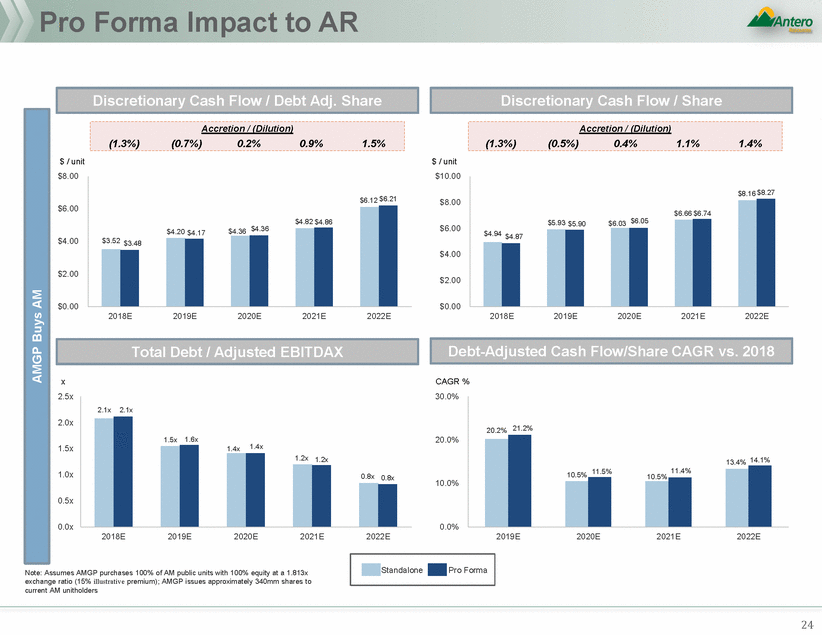
Pro Forma Impact to AR $ / unit $8.00 $ / unit $10.00 $8.00 $6.00 $6.00 $4.36 $4.00 $4.00 $2.00 $2.00 $0.00 $0.00 2018E 2019E 2020E 2021E 2022E 2018E 2019E 2020E 2021E 2022E x 2.5x CAGR % 30.0% 2.0x 20.0% 1.5x 11.4% 10.5% 10.5% 11.5% 1.0x 10.0% 0.5x 0.0x 0.0% 2018E 2019E 2020E 2021E 2022E 2019E 2020E 2021E 2022E Note: Assumes AMGP purchases 100% of AM public units with 100% equity at a 1.813x exchange ratio (15% illustrative premium); AMGP issues approximately 340mm shares to current AM unitholders 24 StandalonePro Forma 20.2% 21.2% 13.4% 14.1% 2.1x 2.1x 1.5x 1.6x 1.4x 1.4x 1.2x 1.2x 0.8x 0.8x Debt-Adjusted Cash Flow/Share CAGR vs. 2018 Total Debt / Adjusted EBITDAX $6.12 $6.21 $4.82 $4.86 $4.20 $4.17$4.36 $3.52 $3.48 $8.16 $8.27 $6.66 $6.74 $5.93 $5.90$6.03 $6.05 $4.94 $4.87 Accretion / (Dilution) (1.3%)(0.5%)0.4%1.1%1.4% Accretion / (Dilution) (1.3%)(0.7%)0.2%0.9%1.5% AMGP Buys AM Discretionary Cash Flow / Share Discretionary Cash Flow / Debt Adj. Share
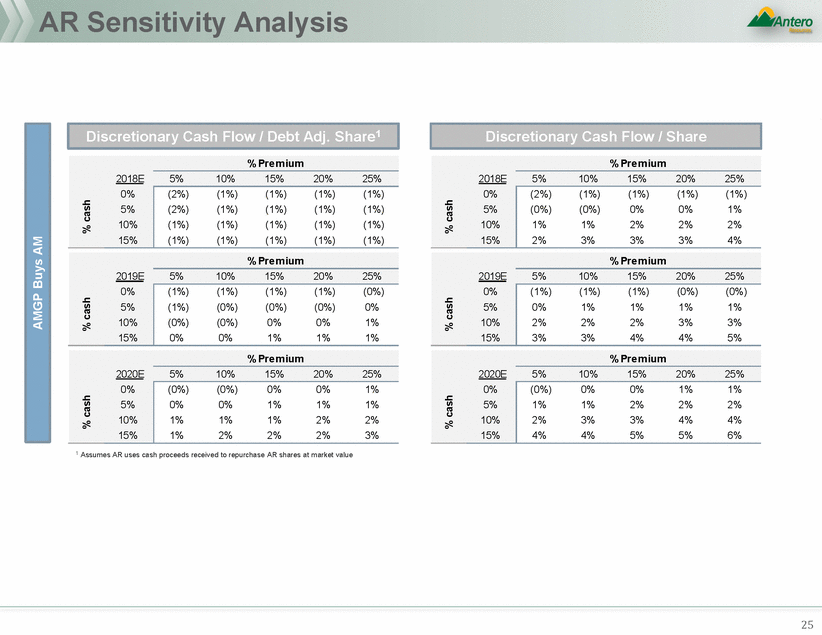
AR Sensitivity Analysis 1 Assumes AR uses cash proceeds received to repurchase AR shares at market value 25 % cash % cash % cash % cash % cash % cash 2020E % Pre m ium 5%10%15%20%25% 0% 5% 10% 15% (0%)0%0%1%1% 1%1%2%2%2% 2%3%3%4%4% 4%4%5%5%6% 2020E % Pre m ium 5%10%15%20%25% 0% 5% 10% 15% (0%)(0%)0%0%1% 0%0%1%1%1% 1%1%1%2%2% 1%2%2%2%3% 2019E % Pre m ium 5%10%15%20%25% 0% 5% 10% 15% (1%)(1%)(1%)(0%)(0%) 0%1%1%1%1% 2%2%2%3%3% 3%3%4%4%5% 2019E % Pre m ium 5%10%15%20%25% 0% 5% 10% 15% (1%)(1%)(1%)(1%)(0%) (1%)(0%)(0%)(0%) 0% (0%)(0%) 0% 0% 1% 0%0%1%1%1% 2018E % Pre m ium 5%10%15%20%25% 0% 5% 10% 15% (2%)(1%)(1%)(1%)(1%) (0%)(0%) 0% 0% 1% 1%1%2%2%2% 2%3%3%3%4% 2018E % Pre m ium 5%10%15%20%25% 0% 5% 10% 15% (2%) (1%) (1%) (1%) (1%) (2%) (1%) (1%) (1%) (1%) (1%) (1%) (1%) (1%) (1%) (1%) (1%) (1%) (1%) (1%) AMGP Buys AM Discretionary Cash Flow / Share Discretionary Cash Flow / Debt Adj. Share1
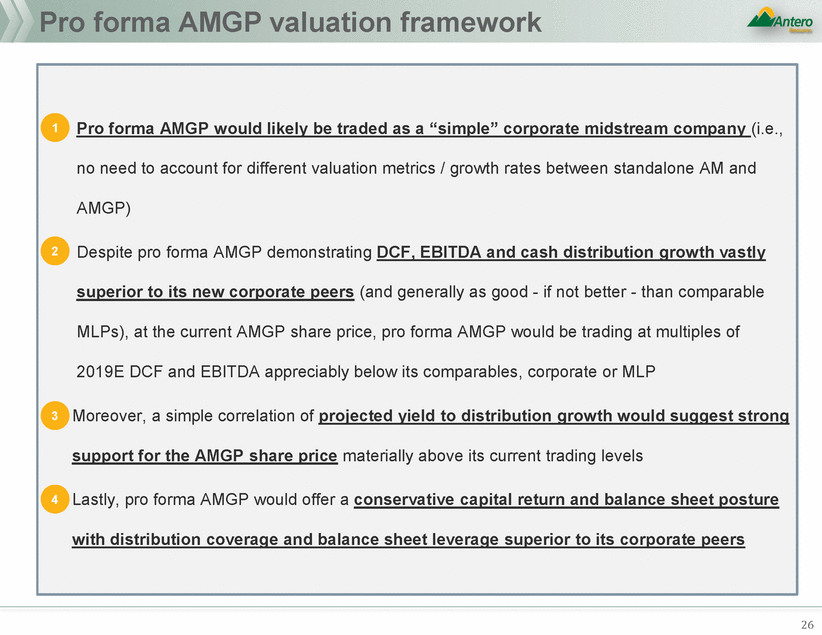
Pro forma AMGP valuation framework 26 •1 Pr o forma AMGP w ould likely be traded as a “ simple” corporate midstream company (i.e., no need to account for different valuation metrics / growth rates between standalone AM and AMGP) •2 Despite pro forma AMGP demonstrating DCF, EBITDA and cash distribution growth vastly superior to its new corporate peers (and generally as good - if not better - than comparable MLPs), at the current AMGP share price, pro forma AMGP would be trading at multiples of 2019E DCF and EBITDA appreciably below its comparables, corporate or MLP •3Moreover, a simple correlation of projected yield to distribution growth would suggest strong support for the AMGP share price materially above its current trading levels •4Lastly, pro forma AMGP would offer a conservative capital return and balance sheet posture with distribution coverage and balance sheet leverage superior to its corporate peers
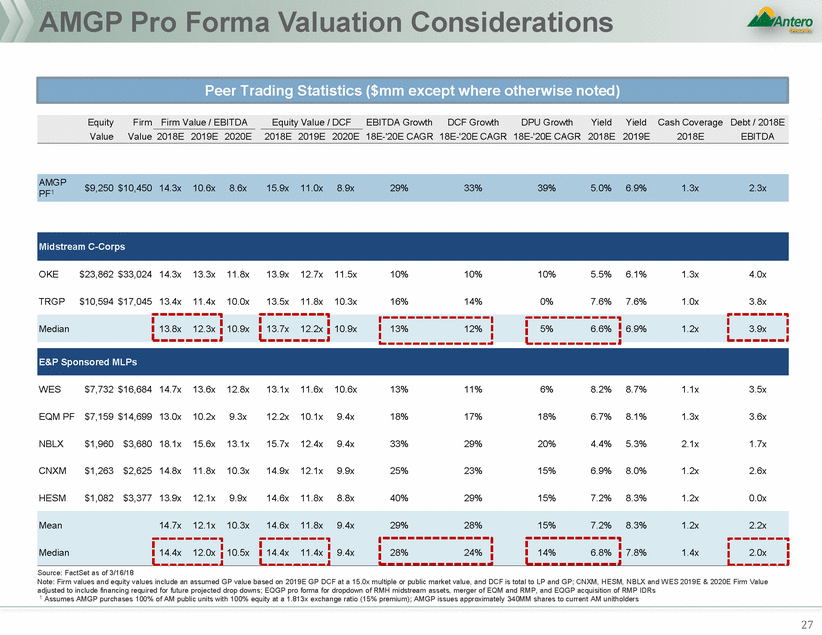
AMGP Pro Forma Valuation Considerations $9,250 $10,450 14.3x 10.6x 8.6x 15.9x 11.0x 8.9x 29% 33% 39% 5.0% 6.9% 1.3x 2.3x PF1 OKE $23,862 $33,024 14.3x 13.3x 11.8x 13.9x 12.7x 11.5x 10% 10% 10% 5.5% 6.1% 1.3x 4.0x TRGP $10,594 $17,045 13.4x 11.4x 10.0x 13.5x 11.8x 10.3x 16% 14% 0% 7.6% 7.6% 1.0x 3.8x WES $7,732 $16,684 14.7x 13.6x 12.8x 13.1x 11.6x 10.6x 13% 11% 6% 8.2% 8.7% 1.1x 3.5x EQM PF $7,159 $14,699 13.0x 10.2x 9.3x 12.2x 10.1x 9.4x 18% 17% 18% 6.7% 8.1% 1.3x 3.6x NBLX $1,960 $3,680 18.1x 15.6x 13.1x 15.7x 12.4x 9.4x 33% 29% 20% 4.4% 5.3% 2.1x 1.7x CNXM $1,263 $2,625 14.8x 11.8x 10.3x 14.9x 12.1x 9.9x 25% 23% 15% 6.9% 8.0% 1.2x 2.6x HESM $1,082 $3,377 13.9x 12.1x 9.9x 14.6x 11.8x 8.8x 40% 29% 15% 7.2% 8.3% 1.2x 0.0x Source: FactSet as of 3/16/18 Note: Firm values and equity values include an assumed GP value based on 2019E GP DCF at a 15.0x multiple or public market value, and DCF is total to LP and GP; CNXM, HESM, NBLX and WES 2019E & 2020E Firm Value adjusted to include financing required for future projected drop downs; EQGP pro forma for dropdown of RMH midstream assets, merger of EQM and RMP, and EQGP acquisition of RMP IDRs 1 Assumes AMGP purchases 100% of AM public units with 100% equity at a 1.813x exchange ratio (15% premium); AMGP issues approximately 340MM shares to current AM unitholders 27 Mean14.7x12.1x10.3x14.6x11.8x9.4x29%28%15%7.2%8.3%1.2x2.2x Median 14.4x12.0x 10.5x 14.4x11.4x 9.4x 28%24% 14%6.8% 7.8%1.4x 2.0x E&P Sponsored MLPs Median 13.8x12.3x 10.9x 13.7x12.2x 10.9x 13%12% 5%6.6% 6.9%1.2x 3.9x Midstream C-Corps AMGP EquityFirm Firm Value / EBITDAEquity Value / DCFEBITDA GrowthDCF GrowthDPU GrowthYieldYieldCash Coverage Debt / 2018E ValueValue 2018E 2019E 2020E2018E 2019E 2020E 18E-'20E CAGR 18E-'20E CAGR 18E-'20E CAGR 2018E 2019E2018EEBITDA Peer Trading Statistics ($mm except where otherwise noted)
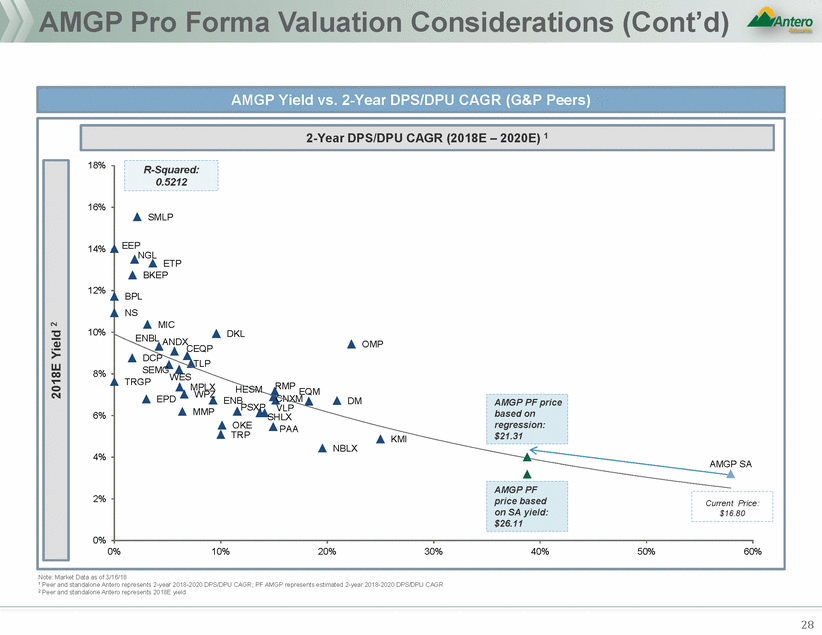
AMGP Pro Forma Valuation Considerations (Cont’d) ENBL ANDX OMP 8% HESM EQM WPZ 6% 4% Note: Market Data as of 3/16/18 1 Peer and standalone Antero represents 2-year 2018-2020 DPS/DPU CAGR; PF AMGP represents estimated 2-year 2018-2020 DPS/DPU CAGR 2 Peer and standalone Antero represents 2018E yield 28 18% 16% 14% ETP 12% 10% SEMG MPLXRMP MMPPSXPVLP OKEPAA NBLX 2% 0% 0%10%20%30%40%50%60% e: SMLP EEP NGL BKEP BPL NS MIC DKL CEQP DCPTLP TRGPWES EPDENBCNXMDM SHLX TRPKMI AMGP SA Current Pric $16.80 AMGP PF price based on SA yield: $26.11 AMGP PF price based on regression: $21.31 2018E Yield 2 R-Squared: 0.5212 2-Year DPS/DPU CAGR (2018E – 2020E) 1 AMGP Yield vs. 2-Year DPS/DPU CAGR (G&P Peers)
Potential Market Reaction to AMGP Acquisition of AM 29 In light of substantial DCF and cash flow accretion and slightly lower growth, AMGP could see a higher trading price albeit with a higher yield Market would positively view a tax step-up, which would materially reduce in corporate taxes going forward AMGP holders would positively view the transaction as long as the premium is within the range of precedents Despite having a PF multiple that would be lower than its corporate peers, PF AMGP would have superior growth and balance sheet, implying upside to the share price AMGP As with AR, market likely to applaud elimination of IDRs and broader simplification if structured appropriately Would be viewed positively as the slight near term dilution would be more than offset by the accretion in 2020+ Distribution growth profile for next 5+ years is materially enhanced for AM unitholders after the transaction AM unitholders may expect a greater than market premium given the material accretion expected to be had by AMGP As long as AM has an enhanced growth profile, higher distributions, and increased investor base through the C-Corp, AM could see a potential multiple re-rating to the upside AM Market likely to applaud elimination of IDRs and broader simplification of the Antero structure Potentially positive reaction for taking a material step to eliminate the perceived misalignment issue, as well as accretion to AM unitholders after 2018, including AR AMGP purchase of AM and elimination of IDRs helps AR pro forma cash flow (absent significant DPU reduction at AM) Transaction would potentially have a slight positive impact to AR’s share price given the above factors A larger impact to AR’s stock to the upside would require a re-rating of AR’s multiple AR
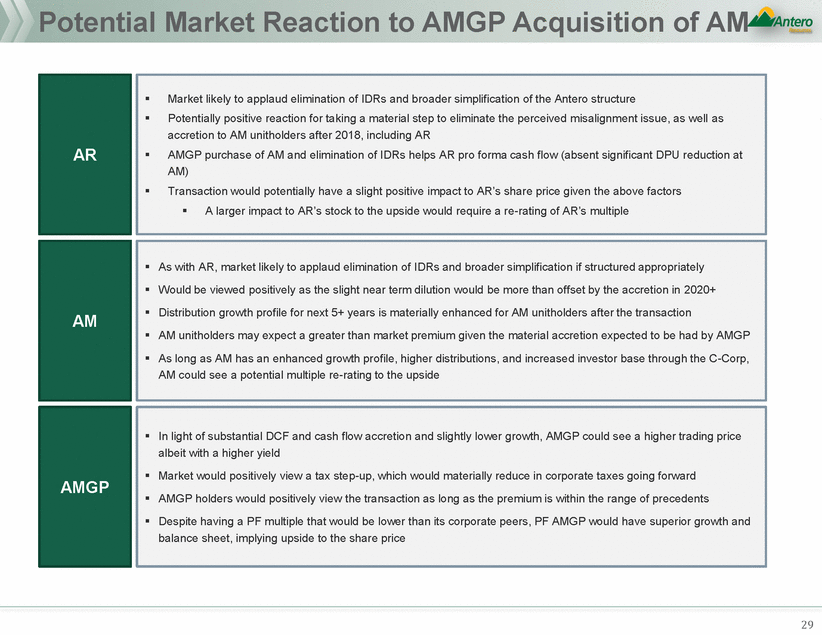
Future Share Price Analysis - AR equity Assumes AMGP acquires AM AMGP shares with 100% for $5,717mm in exchange for 2022 standalone cash flow per share $8.16 1-year forward cash flow per share multiple 4.5x Implied standalone future share price $36.93 Discount factor¹ 0.6x 2022 proforma cash flow per share $8.27 1-year forward cash flow per share multiple 4.5x Implied standalone future share price $37.43 Discount factor¹ 0.6x premium / (discount) to current share price² 18.7% premium / (discount) to implied standalone share price 1.4% 1 Assumes equity discount rate of 11.5%; 2 AR current share price of $20.40 as of 03/16/18; 3 Assumes standalone share price receives no multiple expansion 30 Discount rate Discount rate Implied proforma share price$24.22 1 - yr forward cash flow per share multiple 4.5x5.0x5.5x 10.5% 11.5% 12.5% 1%13%24% 1%13%24% 1%13%24% Implied pro forma share price premium / (discount) to implied standalone share price3 Implied standalone share price$23.89 1 - yr forward cash flow per share multiple 4.5x5.0x5.5x 10.5% 11.5% 12.5% 23%37%50% 19%32%45% 15%27%40% Implied pro forma share price premium / (discount) to current Sensitivity Analysis Standalone vs Pro Forma
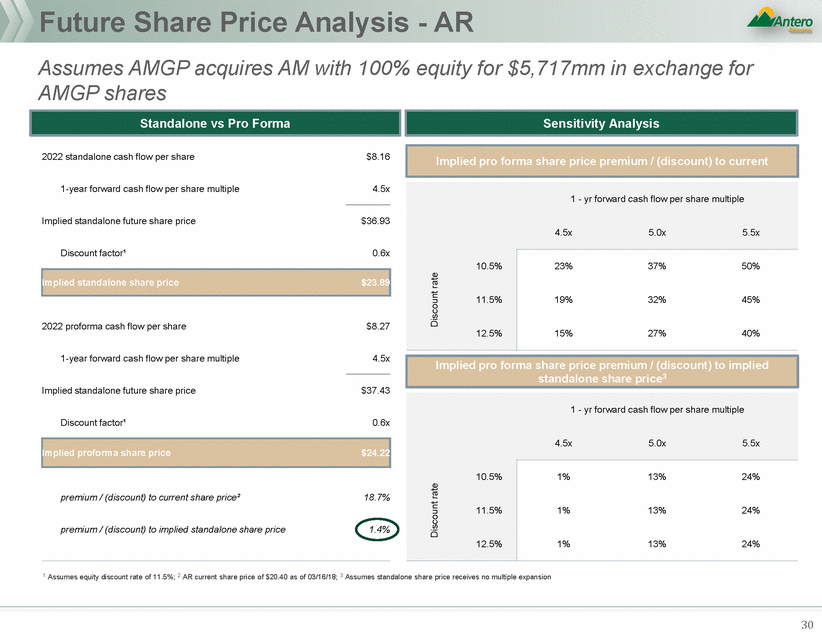
Future Share Price Analysis - AR Assumes AMGP acquires AM exchange for AMGP shares with 90% equity 10% cash for $5,717mm in 2022 standalone cash flow per share $8.16 1-year forward cash flow per share multiple 4.5x Implied standalone future share price $36.93 Discount factor¹ 0.6x 2022 proforma cash flow per share $8.49 1-year forward cash flow per share multiple 4.5x Implied standalone future share price $38.43 Discount factor¹ 0.6x premium / (discount) to current share price² 21.9% premium / (discount) to implied standalone share price 4.1% 1 Assumes equity discount rate of 11.5%; 2 AR current share price of $20.40 as of 03/16/18; 3 Assumes standalone share price receives no multiple expansion 31 Discount rate Discount rate Implied proforma share price$24.86 1 - yr forward cash flow per share multiple 4.5x5.0x5.5x 10.5% 11.5% 12.5% 4%16%27% 4%16%27% 4%16%27% Implied pro forma share price premium / (discount) to implied standalone share price3 Implied standalone share price$23.89 1 - yr forward cash flow per share multiple 4.5x5.0x5.5x 10.5% 11.5% 12.5% 26%40%54% 22%35%49% 18%31%44% Implied pro forma share price premium / (discount) to current Sensitivity Analysis Standalone vs Pro Forma
AMAcquisition ofAMGPIDRs
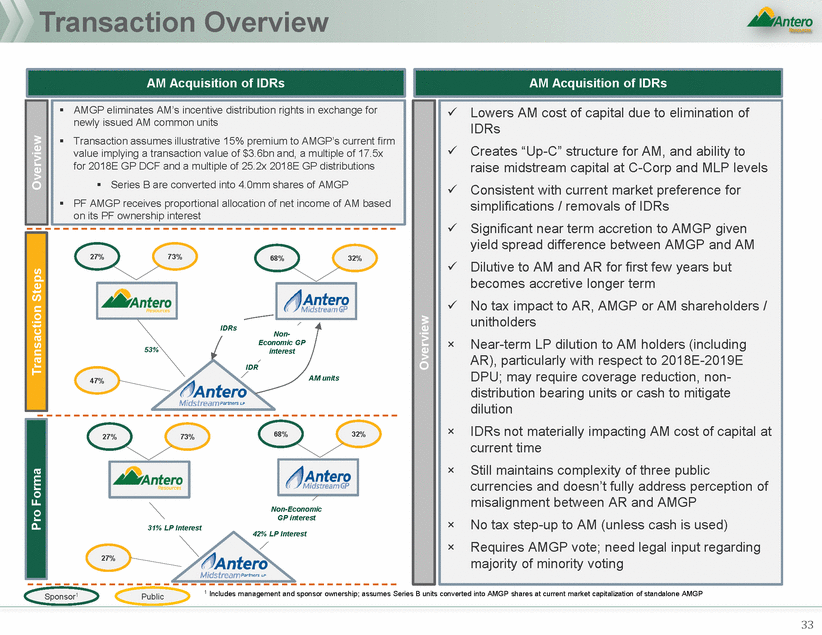
Transaction Overview IDRs 27% 73% 68% 32% IDRs Non-Economic GP interest 53% IDR AM units 47% 68% 32% 27% 73% Non-Economic GP interest 31% LP Interest 42% LP Interest 27% 1 Includes management and sponsor ownership; assumes Series B units converted into AMGP shares at current market capitalization of standalone AMGP Sponsor1 Public 33 Transaction Steps AM Acquisition of IDRs Lowers AM cost of capital due to elimination of Creates “Up-C” structure for AM, and ability to raise midstream capital at C-Corp and MLP levels Consistent with current market preference for simplifications / removals of IDRs Significant near term accretion to AMGP given yield spread difference between AMGP and AM Dilutive to AM and AR for first few years but becomes accretive longer term No tax impact to AR, AMGP or AM shareholders / unitholders ×Near-term LP dilution to AM holders (including AR), particularly with respect to 2018E-2019E DPU; may require coverage reduction, non-distribution bearing units or cash to mitigate dilution ×IDRs not materially impacting AM cost of capital at current time ×Still maintains complexity of three public currencies and doesn’t fully address perception of misalignment between AR and AMGP ×No tax step-up to AM (unless cash is used) ×Requires AMGP vote; need legal input regarding majority of minority voting AM Acquisition of IDRs Overview AMGP eliminates AM’s incentive distribution rights in exchange for newly issued AM common units Transaction assumes illustrative 15% premium to AMGP’s current firm value implying a transaction value of $3.6bn and, a multiple of 17.5x for 2018E GP DCF and a multiple of 25.2x 2018E GP distributions Series B are converted into 4.0mm shares of AMGP PF AMGP receives proportional allocation of net income of AM based on its PF ownership interest
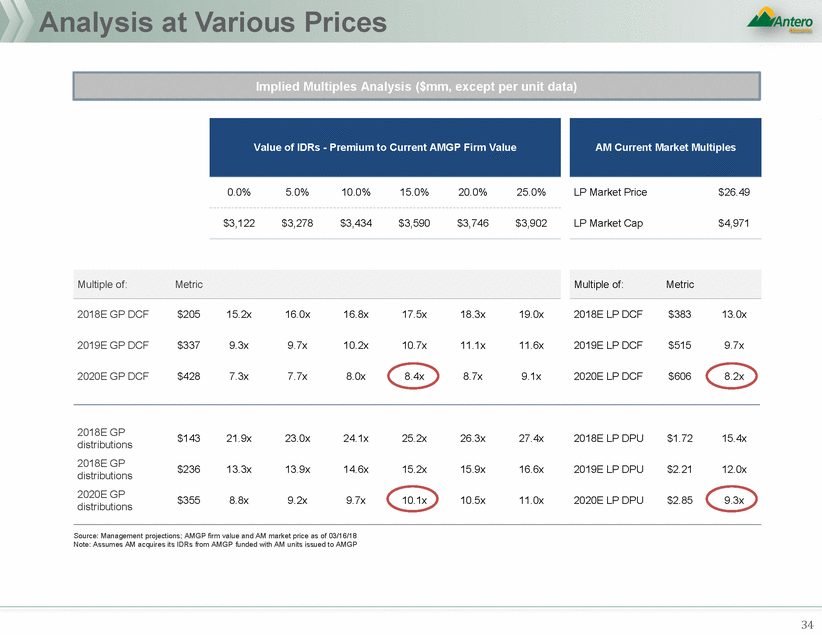
Analysis at Various Prices 0.0% 5.0% 10.0% 15.0% 20.0% 25.0% LP Market Price $26.49 $3,122 $3,278 $3,434 $3,590 $3,746 $3,902 LP Market Cap $4,971 2018E GP DCF $205 15.2x 16.0x 16.8x 17.5x 18.3x 19.0x 2018E LP DCF $383 13.0x 2019E GP DCF $337 9.3x 9.7x 10.2x 10.7x 11.1x 11.6x 2019E LP DCF $515 9.7x 2020E GP DCF $428 7.3x 7.7x 8.0x 8.4x 8.7x 9.1x 2020E LP DCF $606 8.2x 2018E GP distributions 2018E GP distributions 2020E GP distributions $143 21.9x 23.0x 24.1x 25.2x 26.3x 27.4x 2018E LP DPU $1.72 15.4x $236 13.3x 13.9x 14.6x 15.2x 15.9x 16.6x 2019E LP DPU $2.21 12.0x $355 8.8x 9.2x 9.7x 10.1x 10.5x 11.0x 2020E LP DPU $2.85 9.3x Source: Management projections; AMGP firm value and AM market price as of 03/16/18 Note: Assumes AM acquires its IDRs from AMGP funded with AM units issued to AMGP 34 Multiple of:Metric Multiple of:Metric AM Current Market Multiples Value of IDRs - Premium to Current AMGP Firm Value Implied Multiples Analysis ($mm, except per unit data)
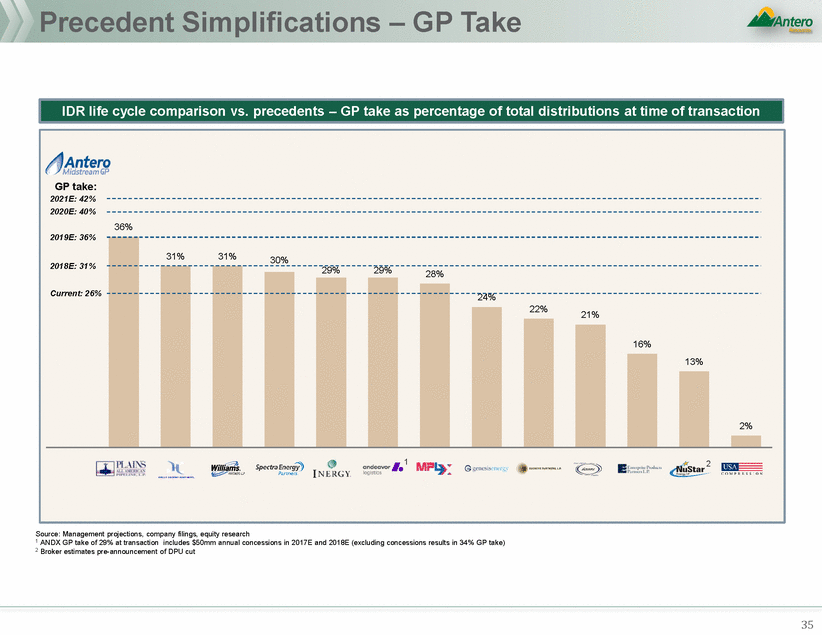
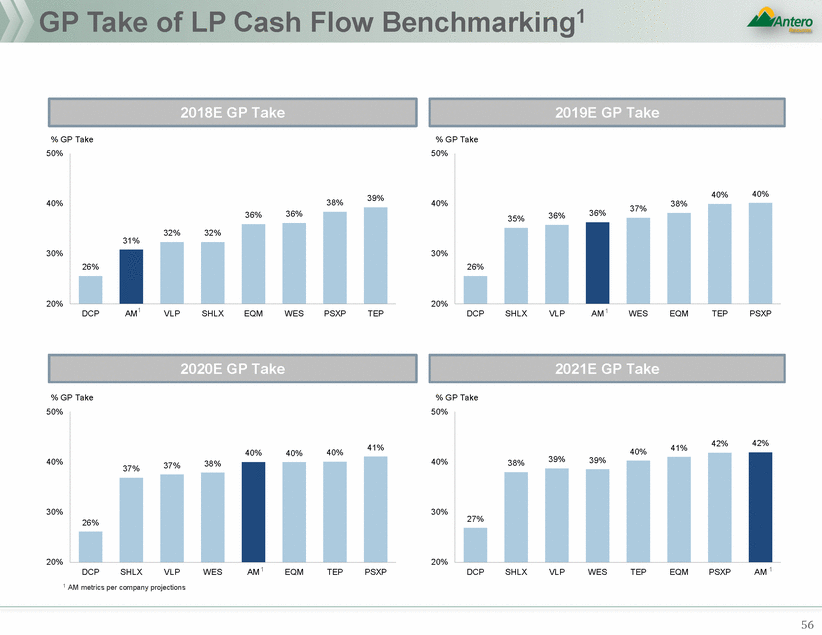
Precedent Simplifications – GP Take Source: Management projections, company filings, equity research 1 ANDX GP take of 29% at transaction includes $50mm annual concessions in 2017E and 2018E (excluding concessions results in 34% GP take) 2 Broker estimates pre-announcement of DPU cut 35 GP take: 2021E: 42% 2020E: 40% 36% 2019E: 36% 29%29%28% 11 2 2018E: 31% Current: 26% 31%31%30% 24% 22%21% 16% 13% 2% IDR life cycle comparison vs. precedents – GP take as percentage of total distributions at time of transaction
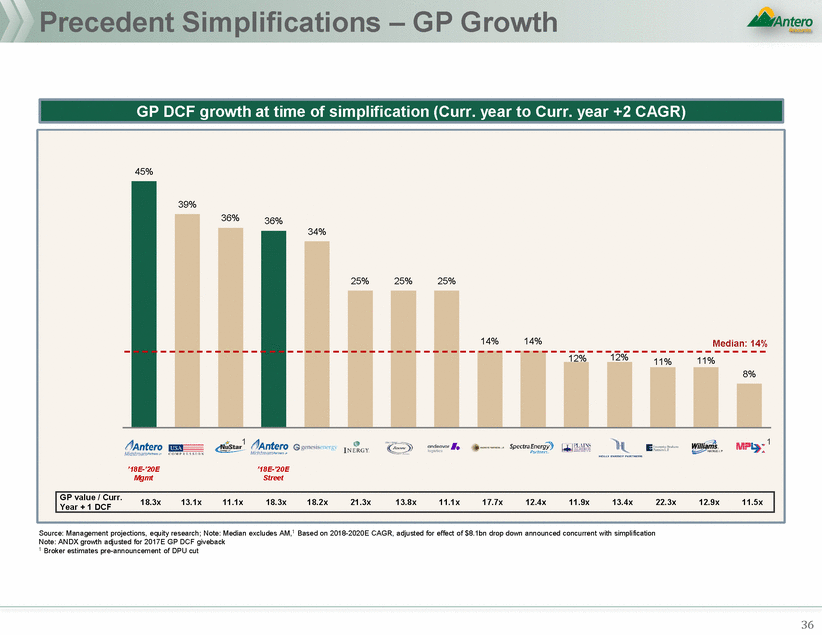
Precedent Simplifications – GP Growth Source: Management projections, equity research; Note: Median excludes AM,1 Based on 2018-2020E CAGR, adjusted for effect of $8.1bn drop down announced concurrent with simplification Note: ANDX growth adjusted for 2017E GP DCF giveback 1 Broker estimates pre-announcement of DPU cut 36 45% 12%12%11%11% 11 ’18E-’20E’18E-’20E MgmtStreet Year + 1 DCF18.3x13.1x11.1x18.3x18.2x21.3x13.8x11.1x17.7x12.4x11.9x13.4x22.3x12.9x11.5x GP value / Curr. 39% 36%36% 34% 25%25%25% 14%14%Median: 14% 8% GP DCF growth at time of simplification (Curr. year to Curr. year +2 CAGR)
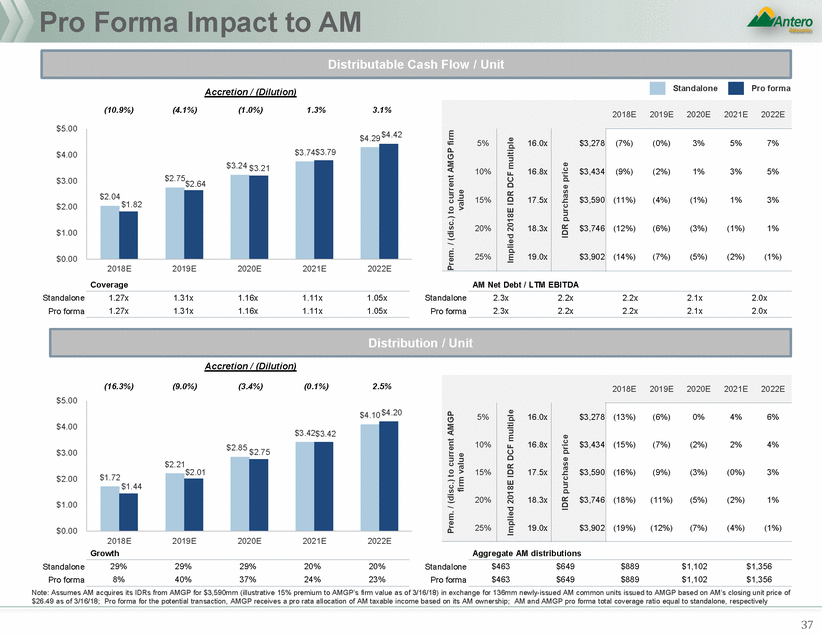
Pro Forma Impact to AM Standalone Pro forma Accretion / (Dilution) (10.9%) (4.1%) (1.0%) 1.3% 3.1% $5.00 $4.00 $3.00 $2.64 $1.82 $2.00 $1.00 $0.00 2018E Coverage 2019E 2020E 2021E 2022E AM Net Debt / LTM EBITDA Standalone Pro forma 1.27x 1.27x 1.31x 1.31x 1.16x 1.16x 1.11x 1.11x 1.05x 1.05x Standalone Pro forma 2.3x 2.3x 2.2x 2.2x 2.2x 2.2x 2.1x 2.1x 2.0x 2.0x Accretion / (Dilution) (16.3%) (9.0%) (3.4%) (0.1%) 2.5% $5.00 $4.00 $3.00 $2.01 $2.00 $1.44 $1.00 $0.00 2018E Growth 2019E 2020E 2021E 2022E Aggregate AM distributions Standalone Pro forma 29% 8% 29% 40% 29% 37% 20% 24% 20% 23% Standalone Pro forma $463 $463 $649 $649 $889 $889 $1,102 $1,102 $1,356 $1,356 Note: Assumes AM acquires its IDRs from AMGP for $3,590mm (illustrative 15% premium to AMGP’s firm value as of 3/16/18) in exchange for 136mm newly-issued AM common units issued to AMGP based on AM’s closing unit price of $26.49 as of 3/16/18; Pro forma for the potential transaction, AMGP receives a pro rata allocation of AM taxable income based on its AM ownership; AM and AMGP pro forma total coverage ratio equal to standalone, respectively 37 Prem. / (disc.) to current AMGP firm value Prem. / (disc.) to current AMGP firm value Implied 2018E IDR DCF multiple Implied 2018E IDR DCF multiple IDR purchase price IDR purchase price $4.10 $4.20 $3.42$3.42 $2.85 $2.75 $2.21 $1.72 2018E2019E2020E2021E2022E 5% 10% 15% 20% 25% 16.0x 16.8x 17.5x 18.3x 19.0x $3,278 $3,434 $3,590 $3,746 $3,902 (13%) (6%) 0% 4% 6% (15%) (7%) (2%) 2% 4% (16%) (9%) (3%) (0%) 3% (18%) (11%) (5%) (2%) 1% (19%) (12%) (7%) (4%) (1%) Distribution / Unit $4.29 $4.42 $3.74$3.79 $3.24 $3.21 $2.75 $2.04 2018E2019E2020E2021E2022E 5% 10% 15% 20% 25% 16.0x 16.8x 17.5x 18.3x 19.0x $3,278 $3,434 $3,590 $3,746 $3,902 (7%) (0%) 3% 5% 7% (9%)(2%)1%3%5% (11%) (4%) (1%) 1% 3% (12%) (6%) (3%)(1%) 1% (14%)(7%)(5%)(2%)(1%) Distributable Cash Flow / Unit
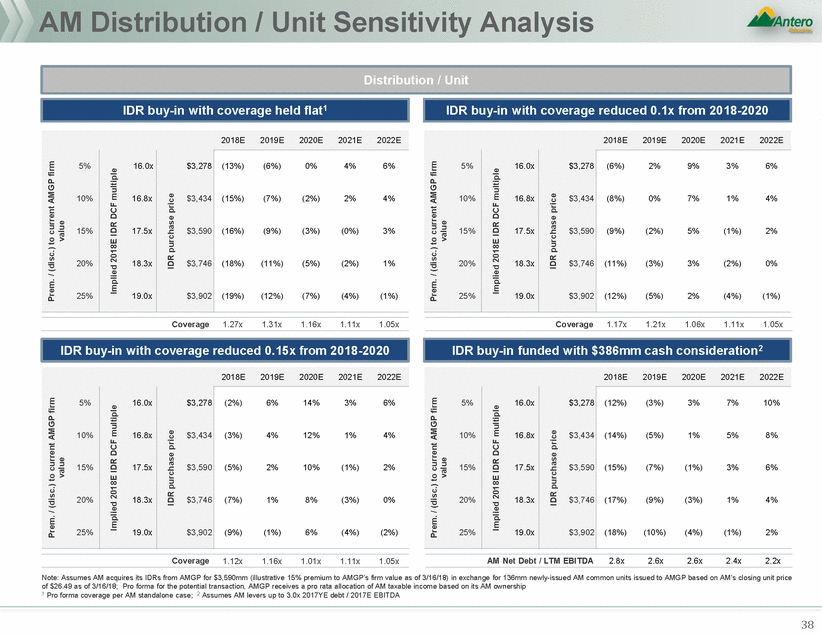
AM Distribution / Unit Sensitivity Analysis Coverage 1.27x 1.31x 1.16x 1.11x 1.05x Coverage 1.17x 1.21x 1.06x 1.11x 1.05x Coverage 1.12x 1.16x 1.01x 1.11x 1.05x AM Net Debt / LTM EBITDA 2.8x 2.6x 2.6x 2.4x 2.2x Note: Assumes AM acquires its IDRs from AMGP for $3,590mm (illustrative 15% premium to AMGP’s firm value as of 3/16/18) in exchange for 136mm newly-issued AM common units issued to AMGP based on AM’s closing unit price of $26.49 as of 3/16/18; Pro forma for the potential transaction, AMGP receives a pro rata allocation of AM taxable income based on its AM ownership 1 Pro forma coverage per AM standalone case; 2 Assumes AM levers up to 3.0x 2017YE debt / 2017E EBITDA 38 Prem. / (disc.) to current AMGP firm value Prem. / (disc.) to current AMGP firm value Implied 2018E IDR DCF multiple Implied 2018E IDR DCF multiple IDR purchase price IDR purchase price Prem. / (disc.) to current AMGP firm value Prem. / (disc.) to current AMGP firm value Implied 2018E IDR DCF multiple Implied 2018E IDR DCF multiple IDR purchase price IDR purchase price 2018E2019E2020E2021E2022E 5% 10% 15% 20% 25% 16.0x 16.8x 17.5x 18.3x 19.0x $3,278 $3,434 $3,590 $3,746 $3,902 (12%) (3%) 3% 7% 10% (14%) (5%) 1% 5% 8% (15%) (7%) (1%) 3% 6% (17%) (9%) (3%) 1% 4% (18%) (10%) (4%) (1%) 2% 2018E2019E2020E2021E2022E 5% 10% 15% 20% 25% 16.0x 16.8x 17.5x 18.3x 19.0x $3,278 $3,434 $3,590 $3,746 $3,902 (2%) 6% 14% 3% 6% (3%) 4% 12% 1% 4% (5%) 2% 10% (1%) 2% (7%) 1% 8% (3%) 0% (9%) (1%) 6% (4%) (2%) IDR buy-in funded with $386mm cash consideration2 IDR buy-in with coverage reduced 0.15x from 2018-2020 2018E2019E2020E2021E2022E 5% 10% 15% 20% 25% 16.0x 16.8x 17.5x 18.3x 19.0x $3,278 $3,434 $3,590 $3,746 $3,902 (6%) 2% 9% 3%6% (8%) 0%7% 1%4% (9%)(2%)5%(1%)2% (11%) (3%) 3%(2%)0% (12%)(5%)2%(4%)(1%) 2018E2019E2020E2021E2022E 5% 10% 15% 20% 25% 16.0x 16.8x 17.5x 18.3x 19.0x $3,278 $3,434 $3,590 $3,746 $3,902 (13%) (6%) 0% 4% 6% (15%) (7%) (2%) 2% 4% (16%) (9%) (3%) (0%) 3% (18%) (11%) (5%) (2%) 1% (19%) (12%) (7%) (4%) (1%) IDR buy-in with coverage reduced 0.1x from 2018-2020 IDR buy-in with coverage held flat1 Distribution / Unit
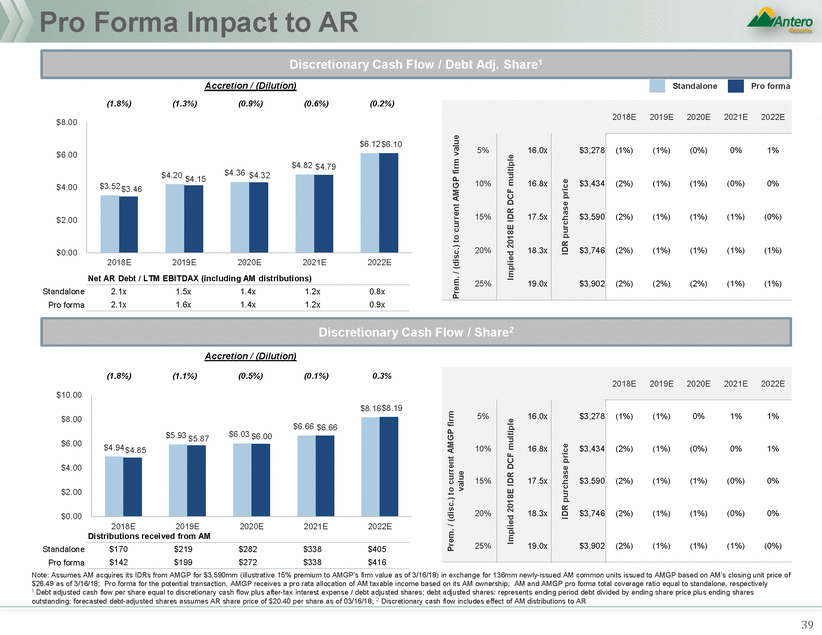
Pro Forma Impact to AR (1.8%) (1.3%) (0.9%) (0.6%) (0.2%) $8.00 $6.00 $4.36 $4.32 $4.20 $4.15 $4.00 $2.00 $0.00 2018E 2019E 2020E 2021E 2022E Net AR Debt / LTM EBITDAX (including AM distributions) Standalone Pro forma 2.1x 2.1x 1.5x 1.6x 1.4x 1.4x 1.2x 1.2x 0.8x 0.9x Accretion / (Dilution) (1.8%) (1.1%) (0.5%) (0.1%) 0.3% $10.00 $8.00 $6.03 $6.00 $5.93 $5.87 $6.00 $4.00 $2.00 $0.00 2018E 2019E 2020E 2021E 2022E Distributions received from AM $170 $142 $219 $199 $282 $272 $338 $338 $405 $416 Standalone Pro forma Note: Assumes AM acquires its IDRs from AMGP for $3,590mm (illustrative 15% premium to AMGP’s firm value as of 3/16/18) in exchange for 136mm newly-issued AM common units issued to AMGP based on AM’s closing unit price of $26.49 as of 3/16/18; Pro forma for the potential transaction, AMGP receives a pro rata allocation of AM taxable income based on its AM ownership; AM and AMGP pro forma total coverage ratio equal to standalone, respectively 1 Debt adjusted cash flow per share equal to discretionary cash flow plus after-tax interest expense / debt adjusted shares; debt adjusted shares: represents ending period debt divided by ending share price plus ending shares outstanding; forecasted debt-adjusted shares assumes AR share price of $20.40 per share as of 03/16/18; 2 Discretionary cash flow includes effect of AM distributions to AR 39 Prem. / (disc.) to current AMGP firm value Prem. / (disc.) to current AMGP firm value Implied 2018E IDR DCF multiple Implied 2018E IDR DCF multiple IDR purchase price IDR purchase price $8.16 $8.19 $6.66 $6.66 $4.94 $4.85 2018E2019E2020E2021E2022E 5% 10% 15% 20% 25% 16.0x 16.8x 17.5x 18.3x 19.0x $3,278 $3,434 $3,590 $3,746 $3,902 (1%) (1%) 0% 1% 1% (2%) (1%) (0%) 0% 1% (2%) (1%) (1%) (0%) 0% (2%) (1%) (1%) (0%) 0% (2%) (1%) (1%) (1%) (0%) Discretionary Cash Flow / Share2 $6.12 $6.10 $4.82 $4.79 $3.52 $3.46 2018E2019E2020E2021E2022E 5% 10% 15% 20% 25% 16.0x 16.8x 17.5x 18.3x 19.0x $3,278 $3,434 $3,590 $3,746 $3,902 (1%)(1%)(0%) 0% 1% (2%)(1%)(1%)(0%) 0% (2%)(1%)(1%)(1%)(0%) (2%)(1%)(1%)(1%)(1%) (2%)(2%)(2%)(1%)(1%) Discretionary Cash Flow / Debt Adj. Share1 Accretion / (Dilution) Standalone Pro forma
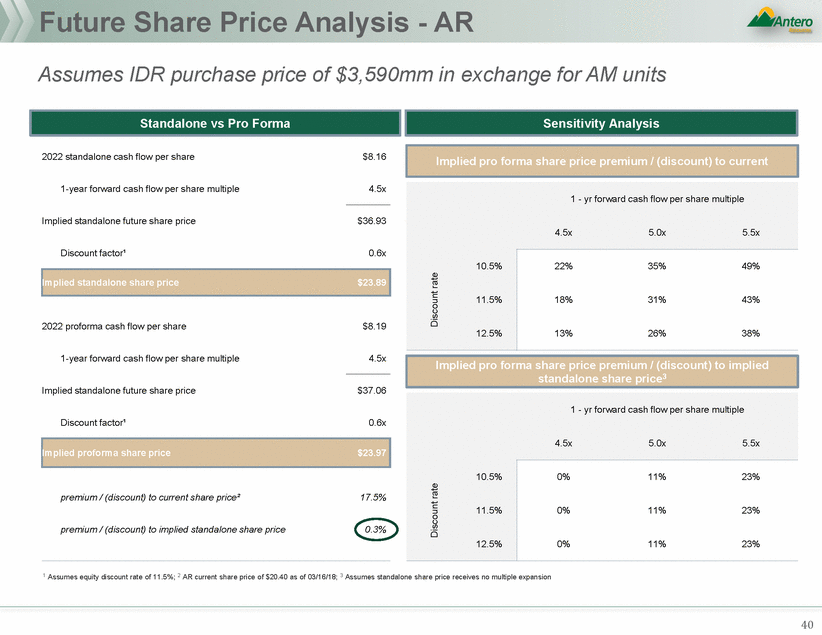
Future Share Price Analysis - AR Assumes IDR purchase price of $3,590mm in exchange for AM units 2022 standalone cash flow per share $8.16 1-year forward cash flow per share multiple 4.5x Implied standalone future share price $36.93 Discount factor¹ 0.6x 2022 proforma cash flow per share $8.19 1-year forward cash flow per share multiple 4.5x Implied standalone future share price $37.06 Discount factor¹ 0.6x premium / (discount) to current share price² 17.5% premium / (discount) to implied standalone share price 0.3% 1 Assumes equity discount rate of 11.5%; 2 AR current share price of $20.40 as of 03/16/18; 3 Assumes standalone share price receives no multiple expansion 40 Discount rate Discount rate Implied proforma share price$23.97 1 - yr forward cash flow per share multiple 4.5x5.0x5.5x 10.5% 11.5% 12.5% 0%11%23% 0%11%23% 0%11%23% Implied pro forma share price premium / (discount) to implied standalone share price3 Implied standalone share price$23.89 1 - yr forward cash flow per share multiple 4.5x5.0x5.5x 10.5% 11.5% 12.5% 22%35%49% 18%31%43% 13%26%38% Implied pro forma share price premium / (discount) to current Sensitivity Analysis Standalone vs Pro Forma
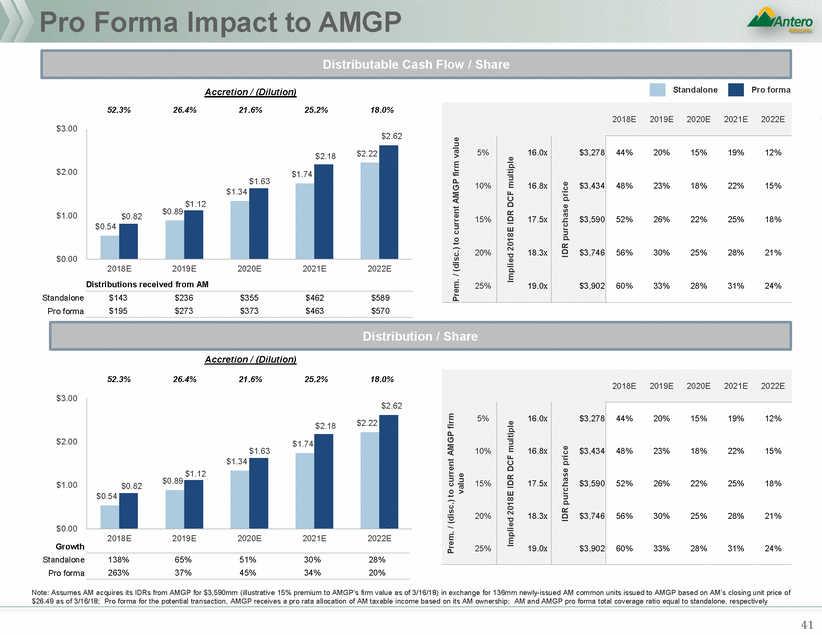
Pro Forma Impact to AMGP Standalone Pro forma Accretion / (Dilution) 52.3% 26.4% 21.6% 25.2% 18.0% $3.00 $2.00 $1.63 $1.00 $0.00 2018E 2019E 2020E 2021E 2022E Distributions received from AM Standalone Pro forma $143 $195 $236 $273 $355 $373 $462 $463 $589 $570 Accretion / (Dilution) 52.3% 26.4% 21.6% 25.2% 18.0% $3.00 $2.00 $1.63 $1.00 $0.00 2018E 2019E 2020E 2021E 2022E Growth Standalone Pro forma 138% 263% 65% 37% 51% 45% 30% 34% 28% 20% Note: Assumes AM acquires its IDRs from AMGP for $3,590mm (illustrative 15% premium to AMGP’s firm value as of 3/16/18) in exchange for 136mm newly-issued AM common units issued to AMGP based on AM’s closing unit price of $26.49 as of 3/16/18; Pro forma for the potential transaction, AMGP receives a pro rata allocation of AM taxable income based on its AM ownership; AM and AMGP pro forma total coverage ratio equal to standalone, respectively 41 Prem. / (disc.) to current AMGP firm value Prem. / (disc.) to current AMGP firm value Implied 2018E IDR DCF multiple Implied 2018E IDR DCF multiple IDR purchase price IDR purchase price $2.62 $2.18$2.22 $1.74 $1.34 $1.12 $0.82$0.89 $0.54 2018E2019E2020E2021E2022E 5% 10% 15% 20% 25% 16.0x 16.8x 17.5x 18.3x 19.0x $3,278 $3,434 $3,590 $3,746 $3,902 44%20%15%19%12% 48%23%18%22%15% 52%26%22%25%18% 56%30%25%28%21% 60%33%28%31%24% Distribution / Share $2.62 $2.18$2.22 $1.74 $1.34 $1.12 $0.82$0.89 $0.54 2018E2019E2020E2021E2022E 5% 10% 15% 20% 25% 16.0x 16.8x 17.5x 18.3x 19.0x $3,278 $3,434 $3,590 $3,746 $3,902 44%20%15%19%12% 48%23%18%22%15% 52%26%22%25%18% 56%30%25%28%21% 60%33%28%31%24% Distributable Cash Flow / Share
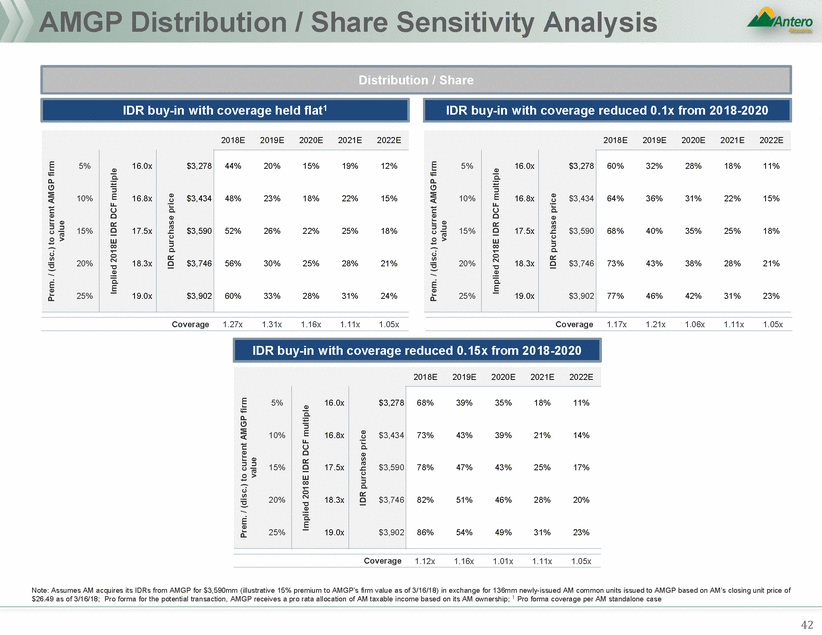
AMGP Distribution / Share Sensitivity Analysis Coverage 1.27x 1.31x 1.16x 1.11x 1.05x Coverage 1.17x 1.21x 1.06x 1.11x 1.05x Coverage 1.12x 1.16x 1.01x 1.11x 1.05x Note: Assumes AM acquires its IDRs from AMGP for $3,590mm (illustrative 15% premium to AMGP’s firm value as of 3/16/18) in exchange for 136mm newly-issued AM common units issued to AMGP based on AM’s closing unit price of $26.49 as of 3/16/18; Pro forma for the potential transaction, AMGP receives a pro rata allocation of AM taxable income based on its AM ownership; 1 Pro forma coverage per AM standalone case 42 Prem. / (disc.) to current AMGP firm value Implied 2018E IDR DCF multiple IDR purchase price Prem. / (disc.) to current AMGP firm value Implied 2018E IDR DCF multiple IDR purchase price Prem. / (disc.) to current AMGP firm value Implied 2018E IDR DCF multiple IDR purchase price 2018E2019E2020E2021E2022E 5% 10% 15% 20% 25% 16.0x 16.8x 17.5x 18.3x 19.0x $3,278 $3,434 $3,590 $3,746 $3,902 68%39%35%18%11% 73%43%39%21%14% 78%47%43%25%17% 82%51%46%28%20% 86%54%49%31%23% IDR buy-in with coverage reduced 0.15x from 2018-2020 2018E2019E2020E2021E2022E 5% 10% 15% 20% 25% 16.0x 16.8x 17.5x 18.3x 19.0x $3,278 $3,434 $3,590 $3,746 $3,902 60%32%28%18%11% 64%36%31%22%15% 68%40%35%25%18% 73%43%38%28%21% 77%46%42%31%23% 2018E2019E2020E2021E2022E 5% 10% 15% 20% 25% 16.0x 16.8x 17.5x 18.3x 19.0x $3,278 $3,434 $3,590 $3,746 $3,902 44%20%15%19%12% 48%23%18%22%15% 52%26%22%25%18% 56%30%25%28%21% 60%33%28%31%24% IDR buy-in with coverage reduced 0.1x from 2018-2020 IDR buy-in with coverage held flat1 Distribution / Share
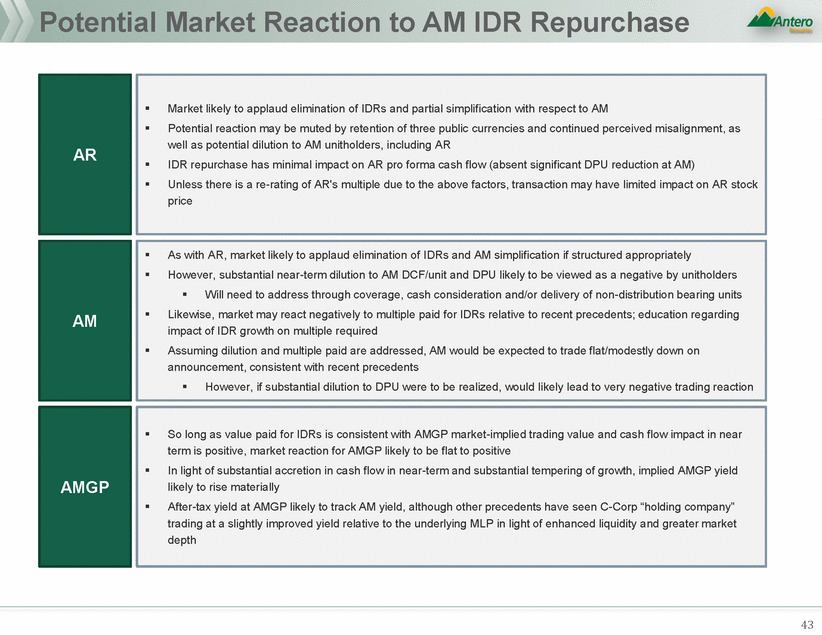
Potential Market Reaction to AM IDR Repurchase impact of IDR growth on multiple required 43 So long as value paid for IDRs is consistent with AMGP market-implied trading value and cash flow impact in near term is positive, market reaction for AMGP likely to be flat to positive In light of substantial accretion in cash flow in near-term and substantial tempering of growth, implied AMGP yield likely to rise materially After-tax yield at AMGP likely to track AM yield, although other precedents have seen C-Corp “holding company” trading at a slightly improved yield relative to the underlying MLP in light of enhanced liquidity and greater market depth AMGP As with AR, market likely to applaud elimination of IDRs and AM simplification if structured appropriately However, substantial near-term dilution to AM DCF/unit and DPU likely to be viewed as a negative by unitholders Will need to address through coverage, cash consideration and/or delivery of non-distribution bearing units Likewise, market may react negatively to multiple paid for IDRs relative to recent precedents; education regarding Assuming dilution and multiple paid are addressed, AM would be expected to trade flat/modestly down on announcement, consistent with recent precedents However, if substantial dilution to DPU were to be realized, would likely lead to very negative trading reaction AM Market likely to applaud elimination of IDRs and partial simplification with respect to AM Potential reaction may be muted by retention of three public currencies and continued perceived misalignment, as well as potential dilution to AM unitholders, including AR IDR repurchase has minimal impact on AR pro forma cash flow (absent significant DPU reduction at AM) Unless there is a re-rating of AR's multiple due to the above factors, transaction may have limited impact on AR stock price AR
ARShareBuybackAnalysis
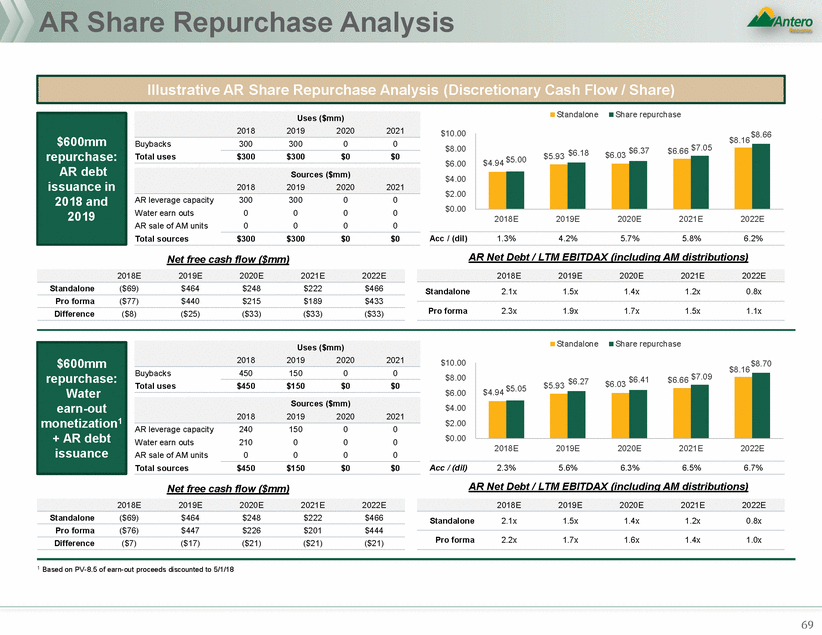
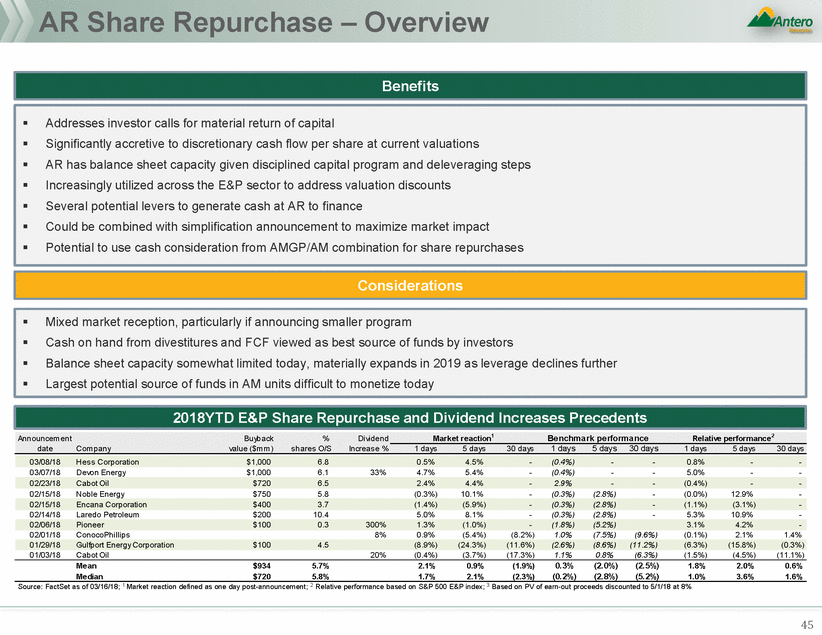
AR Share Repurchase – Overview 03/07/18 Devon Energy $1,000 6.1 33% 4.7% 5.4% - (0.4%) - - 5.0% - - 02/15/18 Noble Energy $750 5.8 (0.3%) 10.1% - (0.3%) (2.8%) - (0.0%) 12.9% - 02/14/18 Laredo Petroleum $200 10.4 5.0% 8.1% - (0.3%) (2.8%) - 5.3% 10.9% - 02/01/18 ConocoPhillips 8% 0.9% (5.4%) (8.2%) 1.0% (7.5%) (9.6%) (0.1%) 2.1% 1.4% 01/03/18 Cabot Oil 20% (0.4%) (3.7%) (17.3%) 1.1% 0.8% (6.3%) (1.5%) (4.5%) (11.1%) 0.3% (0.2%) (2.0%) (2.8%) (2.5%) (5.2%) Mean Median $934 $720 5.7% 5.8% 2.1% 1.7% 0.9% 2.1% (1.9%) (2.3%) 1.8% 1.0% 2.0% 3.6% 0.6% 1.6% Source: FactSet as of 03/16/18; 1 Market reaction defined as one day post-announcement; 2 Relative performance based on S&P 500 E&P index; 3 Based on PV of earn-out proceeds discounted to 5/1/18 at 8% 45 01/29/18 Gulfport Energy Corporation $100 4.5 (8.9%) (24.3%) (11.6%) (2.6%) (8.6%) (11.2%) (6.3%) (15.8%) (0.3%) 02/06/18 Pioneer $100 0.3 300% 1.3% (1.0%) - (1.8%) (5.2%) 3.1% 4.2% - 02/15/18 Encana Corporation $400 3.7 (1.4%) (5.9%) - (0.3%) (2.8%) - (1.1%) (3.1%) - 02/23/18 Cabot Oil $720 6.5 2.4% 4.4% - 2.9% - - (0.4%) - - 2018YTD E&P Share Repurchase and Dividend Increases Precedents Announcem ent Buyback % Dividend Market reaction1 Benchmark performance Relative performance2 date Com pany value ($m m ) s hares O/S Increas e % 1 days 5 days 30 days 1 days 5 days 30 days 1 days 5 days 30 days 03/08/18 Hes s Corporation $1,000 6.8 0.5% 4.5% - (0.4%) - - 0.8% - - Mixed market reception, particularly if announcing smaller program Cash on hand from divestitures and FCF viewed as best source of funds by investors Balance sheet capacity somewhat limited today, materially expands in 2019 as leverage declines further Largest potential source of funds in AM units difficult to monetize today Considerations Addresses investor calls for material return of capital Significantly accretive to discretionary cash flow per share at current valuations AR has balance sheet capacity given disciplined capital program and deleveraging steps Increasingly utilized across the E&P sector to address valuation discounts Several potential levers to generate cash at AR to finance Could be combined with simplification announcement to maximize market impact Potential to use cash consideration from AMGP/AM combination for share repurchases Benefits
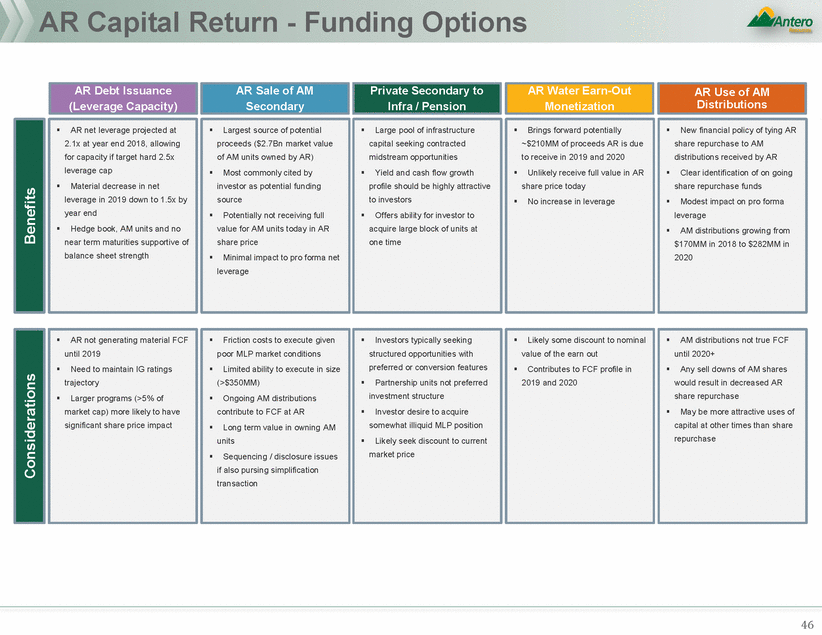
AR Capital Return - Funding Options 46 AR not generating material FCF until 2019 Need to maintain IG ratings trajectory Larger programs (>5% of market cap) more likely to have significant share price impact Friction costs to execute given poor MLP market conditions Limited ability to execute in size (>$350MM) Ongoing AM distributions contribute to FCF at AR Long term value in owning AM units Sequencing / disclosure issues if also pursing simplification transaction Investors typically seeking structured opportunities with preferred or conversion features fePaaturrtneesrship units not preferred inPveasrtnmeersnht isptruncittusrenot prIenfveersretodr idnevesisrtemteonatcsqtruuirceture soInmvewsthoartdilelisqiureidtoMaLcPqpuoirseition soLmikewlyhsaeteilkliqduisidcoMuLnPt tpoocsuitriroennt mLairkkeelyt psreiceek discount to current market price Likely some discount to nominal vnaolmueinoafl vthaelueeaornf tohuet earn out Contributes to FCF profile in 2019 and 2020 AM distributions not true FCF until 2020+ Any sell downs of AM shares would result in decreased AR share repurchase May be more attractive uses of coaf pciataplitatl oathoetrhetirmteims ethsatnhasnhare rsehpaurercrheapsuerchase Benefits AR net leverage projected at 2.1x at year end 2018, allowing for capacity if target hard 2.5x leverage cap Material decrease in net leverage in 2019 down to 1.5x by year end Hedge book, AM units and no near term maturities supportive of balance sheet strength Largest source of potential proceeds ($2.7Bn market value of AM units owned by AR) Most commonly cited by investor as potential funding source Potentially not receiving full value for AM units today in AR share price Minimal impact to pro forma net leverage Large pool of infrastructure capital seeking contracted midstream opportunities Yield and cash flow growth profile should be highly attractive taottirnavcetisvteortso investors Offers ability for investor to acquire large block of units at one time Brings forward potentially ~$2$5201M0MMMofopf rporcoecedesdsAARRisisdudeue to receive in 2019 and 2020 Unlikely receive full value in AR sAhRarsehapreiceprtiocdeatyoday No increase in leverage New financial policy of tying AR sAhRarseharerepurrecphuarscehatoseAtMo AM distributions received by AR Clear identification of on going share repurchase funds Modest impact on pro forma leverage AM distributions growing from $170MM in 2018 to $282MM in 2020 AR Use of AM Distributions AR Water Earn-Out Monetization AR Debt Issuance (Leverage Capacity) AR Sale of AM Secondary Private Secondary to Infra / Pension
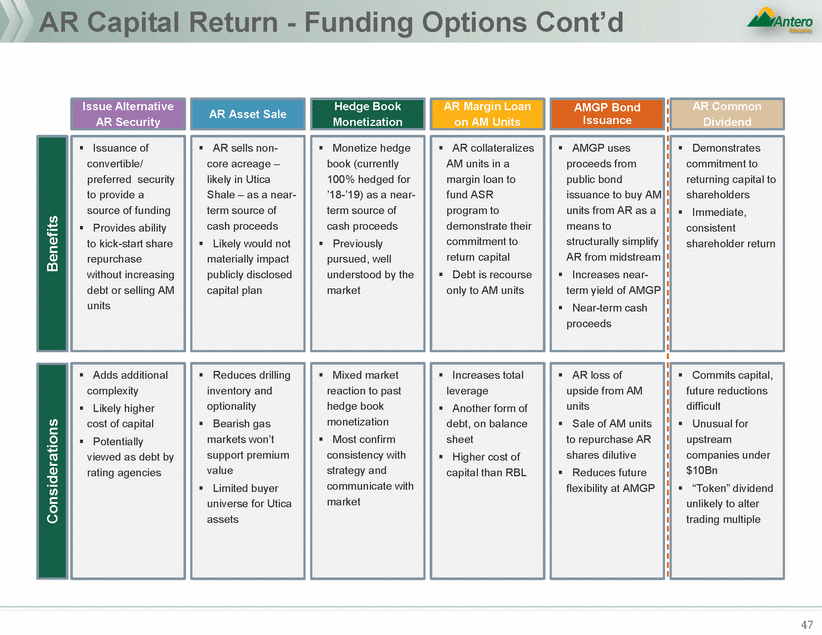
AR Capital Return - Funding Options Cont’d 47 Commits capital, future reductions difficult Unusual for upstream companies under $10Bn “Token” dividend unlikely to alter trading multiple AR loss of upside from AM units Sale of AM units to repurchase AR shares dilutive Reduces future flexibility at AMGP Increases total leverage Another form of debt, on balance sheet Higher cost of capital than RBL Mixed market reaction to past hedge book monetization Most confirm consistency with strategy and communicate with market Reduces drilling inventory and optionality Bearish gas markets won’t support premium value Limited buyer universe for Utica assets Considerations Adds additional complexity Likely higher cost of capital Potentially viewed as debt by rating agencies Demonstrates commitment to returning capital to shareholders Immediate, consistent shareholder return AMGP uses proceeds from public bond issuance to buy AM units from AR as a means to structurally simplify AR from midstream Increases near-term yield of AMGP Near-term cash proceeds AR collateralizes AM units in a margin loan to fund ASR program to demonstrate their commitment to return capital Debt is recourse only to AM units Monetize hedge book (currently 100% hedged for ’18-’19) as a near-term source of cash proceeds Previously pursued, well understood by the market AR sells non-core acreage – likely in Utica Shale – as a near-term source of cash proceeds Likely would not materially impact publicly disclosed capital plan Benefits Issuance of convertible/ preferred security to provide a source of funding Provides ability to kick-start share repurchase without increasing debt or selling AM units AR Asset Sale AR Common Dividend AMGP Bond Issuance AR Margin Loan on AM Units Hedge Book Monetization Issue Alternative AR Security
Water Earn-out
Water Earn-out Executive Summary 49 Key considerations for a potential offer by AR to AM in connection with an early settlement of the earn-out of the fresh water delivery business (“Earn-Out”) Goals for AR may include the following: Maximize the cash proceeds received near term from any settlement Conduct a relatively expedited negotiation process with the AM Special Committee, keeping in mind other likely transactions being considered Enter into a transaction that would be seen as a “win-win” by both AR and AM investors Using Street and Management estimates, reaching the 2019 Earn-Out seems certain and reaching the 2020 Earn-Out seems likely, but less certain For the 2019 Earn-Out, volumes are expected to be 11% above the threshold (184Kbbld Street and 178Kbbld Management vs. 161Kbbld Earn-Out trigger) For the 2020 Earn-Out, volumes are expected to meet the threshold (217Kbbld Street and 200Kbbld Management vs. 200Kbbld Earn-Out trigger) Key topics to consider include: Discount rate applied to the Earn-Out Any risking factor applied to the 2020 Earn-Out Potential value to AM of any of the following: Raising the volume level of the existing MVCs Extending the tenor of the MVC commitments
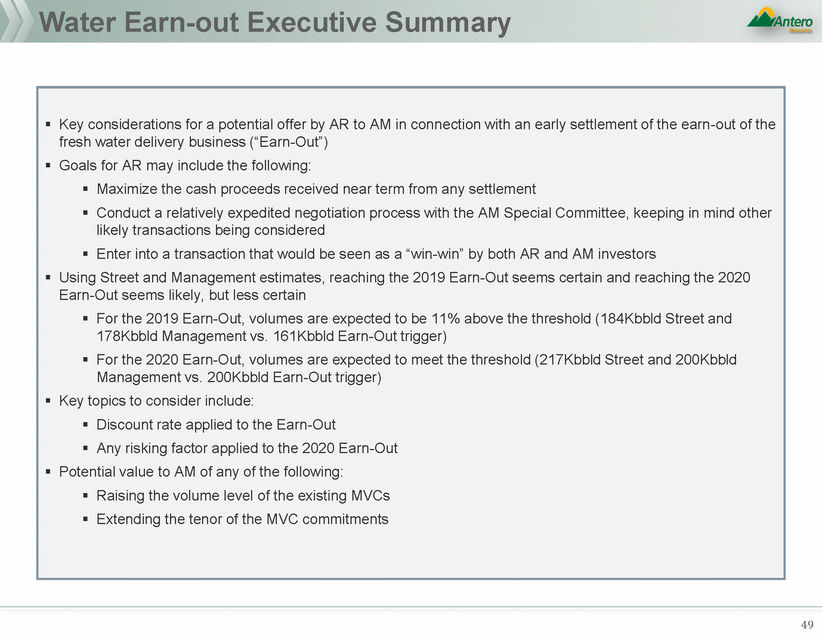
Water Earn-Out Summary Source: Management projections; equity research ¹ As of 5/1/18; ² Assumes 100% risking of 2019 earn-out 50 2020 Earn-out Payment Risking2 Discount Rate 10.0%9.5%9.0%8.5%8.0%7.5%7.0% 100% 95% 90% 85% 80% 75% 70% 65% 60% 55% 50% $204$206$208$210$212$214$216 199201203205207209211 194196198200202204206 189191193195196198200 184186188190191193195 179181183185186188190 174176178179181183185 170171173174176178179 165166168169171173174 160161163164166167169 155156158159161162164 Present Value of Water Payment ($mm)¹ In September 2015, AR dropped down water assets to AM for $1.05bn. The consideration also included an Earn-Out as outlined below: Earn-Outs include a payment at year end 2019 of $125mm and at year end 2020 of $125mm (total potential of $250mm) 2019 year end payment is contingent upon AM delivering 161Kbbld of average volume from 1/1/17 – 12/31/19 2020 year end payment is contingent upon AM delivering 200Kbbld of average volume from 1/1/18 – 12/31/20 Earn-Out payments are binary events Additionally, the transaction included average MVCs by AR to AM of 90Kbbld in 2016, 100Kbbld in 2017, and 120Kbbld in 2018 & 2019 Overview of Water Earn-Out
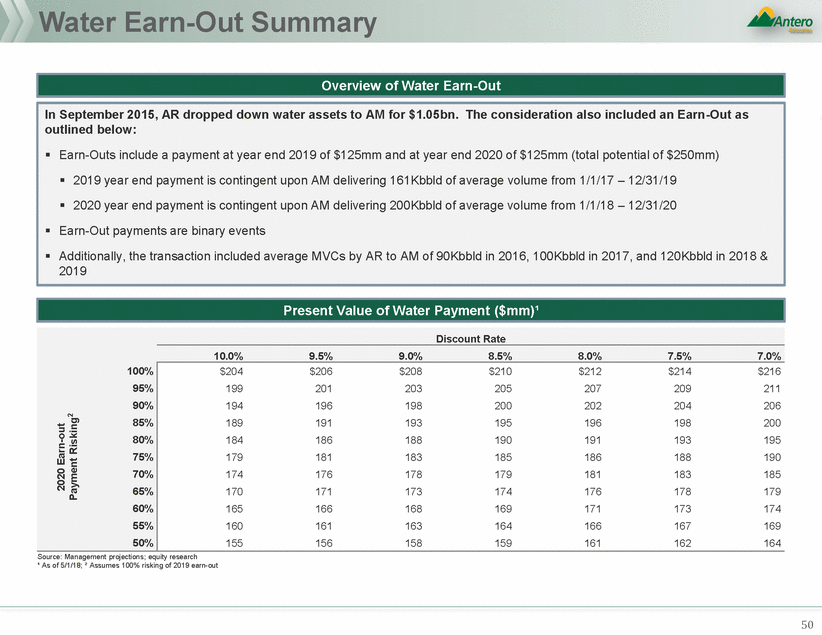
Equity Research Expects AM to Make Both Earn-Out Payments to AR 1 Volume AM 2/14/18 2 Payment AM 1/26/18 3 Payment AR 1/23/18 4 Volume AM 12/6/17 5 Payment AM 11/6/17 Source: Equity research 1 Per water volume projections through 2020; Earn-Out payment not explicitly noted in growth capex; 2 Earn-Out payment not explicitly broken out, however it is noted that payment is expected to be paid: “Of note, based on AR’s current drilling plans AM expects both volume requirements will be met”; 3 Earn-Out payments included in cash flow projections for 2019 and 2020; 4 Earn-Out payments not explicitly broken out, however it is noted that payment is expected to be paid: “Our forecast of 185 wells serviced by the water assets in 2020 would imply that AM will fulfill the requirements for Earn-Out payment to AR”; 5 Earn-Out payments included as acquisition capex in 2019 and 2020 51 BrokerEntityDateAssumes Earn-Out threshold met in 2019 & 2020Based on volume or payment Equity Research Perspectives
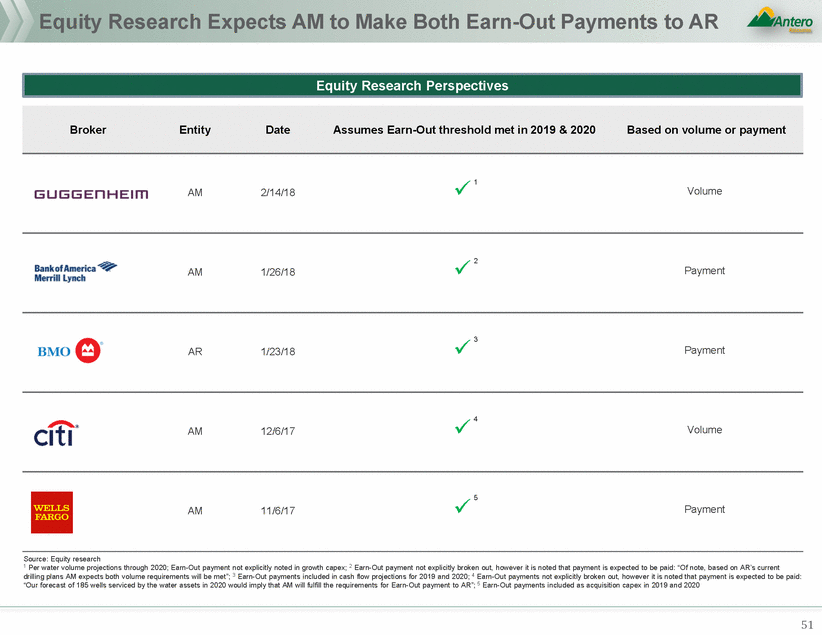
Water volumes: Management and Street estimates 178,425 177,892 Source: Management projections; equity research ¹ 2019 Earn-Out is contingent upon AM delivering 161Kbd of average volume from 1/1/17 – 12/31/19; ² 2020 Earn-Out is contingent upon AM delivering 200Kbd of average volume from 1/1/18 – 12/31/20 52 % above / (below) threshold 11%15%0%9% % above / (below) MVC 53%53%48%56%70%78%NANA ManagementStreet Earn-Out threshold 200,000217,198 161,000200,563 184,601 2019 Earn-Out¹2020 Earn-Out² Average run-rate of 164,936Bbld in 2018 and 2019 required to meet 2019 Earn-Out threshold ManagementStree 120,000 100,000 186,763 t MVC amounts 250,921 120,000 213,910219,541 204,255 153,129 153,129 2017A2018E2019E2020E Projections Compared to Earn-Out (Bbld)¹,² Water Volumes Benchmarking (Bbld)
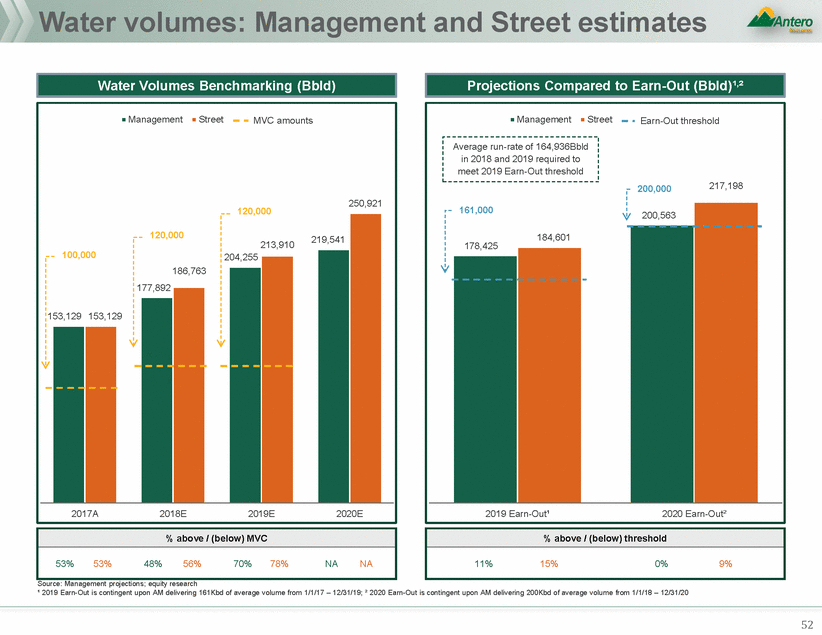
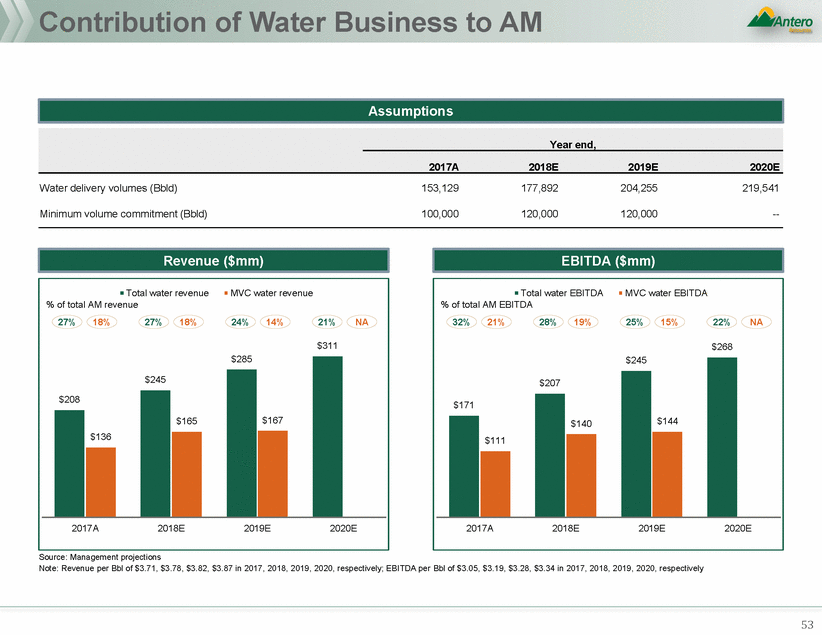
Contribution of Water Business to AM Water delivery volumes (Bbld) 153,129 177,892 204,255 219,541 Minimum volume commitment (Bbld) 100,000 120,000 120,000 --Source: Management projections Note: Revenue per Bbl of $3.71, $3.78, $3.82, $3.87 in 2017, 2018, 2019, 2020, respectively; EBITDA per Bbl of $3.05, $3.19, $3.28, $3.34 in 2017, 2018, 2019, 2020, respectively 53 Total water EBITDAMVC water EBITDA % of total AM EBITDA 32%21%28%19%25%15%22%NA $268 $245 $207 $144 $171 $140 $111 2017A2018E2019E2020E Total water revenueMVC water revenue % of total AM revenue 27%18%27%18%24%14%21%NA $311 $285 $245 $167 $208 $165 $136 2017A2018E2019E2020E EBITDA ($mm) Revenue ($mm) Year end, 2017A2018E2019E2020E Assumptions
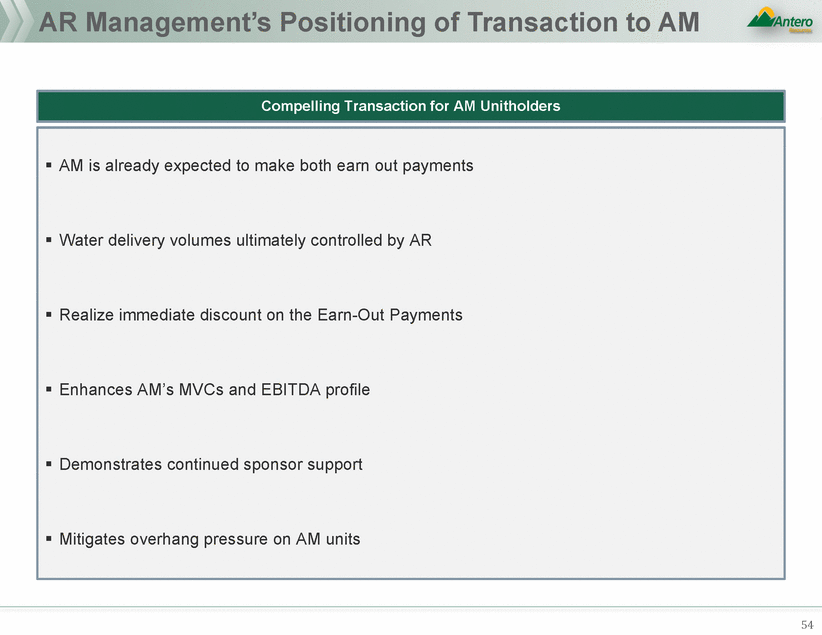
AR Management’s Positioning of Transaction to AM 54 AM is already expected to make both earn out payments Water delivery volumes ultimately controlled by AR Realize immediate discount on the Earn-Out Payments Enhances AM’s MVCs and EBITDA profile Demonstrates continued sponsor support Mitigates overhang pressure on AM units Compelling Transaction for AM Unitholders
AppendixA: AMGPAcquisition ofAM
Benchmarking1 GP Take of LP Cash Flow % GP Take % GP Take 50% 50% 40% 40% 36% 36% 35% 31% 30% 30% 20% 20% AM1 AM 1 DCP VLP SHLX EQM WES PSXP TEP DCP SHLX VLP WES EQM TEP PSXP % GP Take % GP Take 50% 50% 39% 39% 40% 40% 30% 30% 20% 20% AM 1 AM 1 DCP SHLX VLP WES EQM TEP PSXP DCP SHLX VLP WES TEP EQM PSXP 1 AM metrics per company projections 56 40%40%40%41% 37%37%38% 26% 42%42% 40%41% 38% 27% 2021E GP Take 2020E GP Take 38%39% 36%36% 32%32% 26% 40%40% 38% 37% 26% 2019E GP Take 2018E GP Take
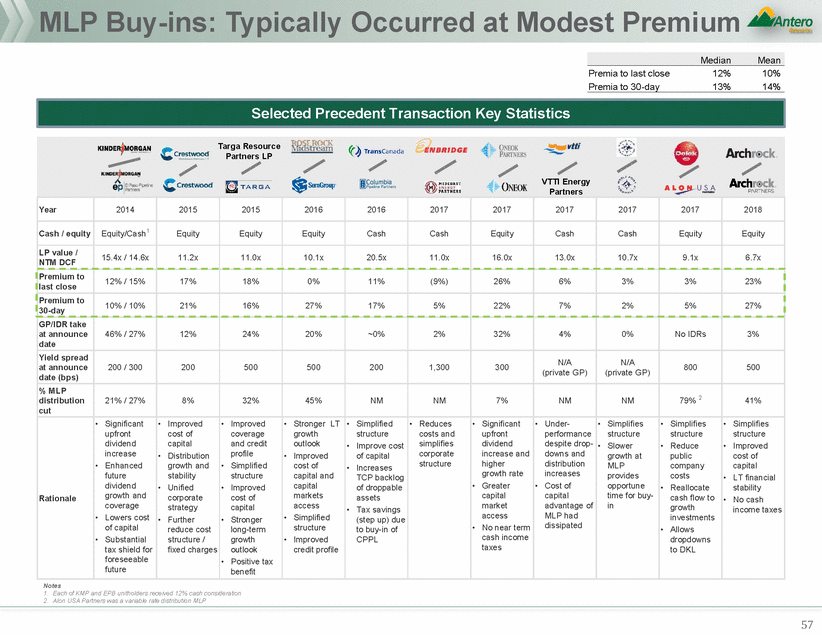
MLP Buy-ins: Typically Occurred at Modest Premium Premia to last close 12% 10% Premia to 30-day 13% 14% cost of • LT financial • No cash investments dropdowns benefit Notes 1. Each of KMP and EPB unitholders received 12% cash consideration 2. Alon USA Partners was a variable rate distribution MLP 57 Targa Resource Partners LP VTTI Energy Partners Year 2014 2015 2015 2016 2016 2017 2017 2017 2017 2017 2018 Cash / equity Equity/Cash1 Equity Equity Equity Cash Cash Equity Cash Cash Equity Equity LP value / NTM DCF 15.4x / 14.6x 11.2x 11.0x 10.1x 20.5x 11.0x 16.0x 13.0x 10.7x 9.1x 6.7x Premium to last close 12% / 15% 17% 18% 0% 11% (9%) 26% 6% 3% 3% 23% Premium to 30-day 10% / 10% 21% 16% 27% 17% 5% 22% 7% 2% 5% 27% GP/IDR take at announce date 46% / 27% 12% 24% 20% ~0% 2% 32% 4% 0% No IDRs 3% Yield spread at announce date (bps) 200 / 300 200 500 500 200 1,300 300 N/A (private GP) N/A (private GP) 800 500 % MLP distribution cut 21% / 27% 8% 32% 45% NM NM 7% NM NM 79% 2 41% Rationale • Significant upfront dividend increase • Enhanced future dividend growth and coverage • Lowers cost of capital • Substantial tax shield for foreseeable future • Improved cost of capital • Distribution growth and stability • Unified corporate strategy • Further reduce cost structure / fixed charges • Improved coverage and credit profile • Simplified structure • Improved cost of capital • Stronger long-term growth outlook • Positive tax • Stronger LT growth outlook • Improved cost of capital and capital markets access • Simplified structure • Improved credit profile • Simplified structure • Improve cost of capital • Increases TCP backlog of droppable assets • Tax savings (step up) due to buy-in of CPPL • Reduces costs and simplifies corporate structure • Significant upfront dividend increase and higher growth rate • Greater capital market access • No near term cash income taxes • Under-performance despite drop-downs and distribution increases • Cost of capital advantage of MLP had dissipated • Simplifies structure • Slower growth at MLP provides opportune time for buy-in • Simplifies structure • Reduce public company costs • Reallocate cash flow to growth • Allows to DKL • Simplifies structure • Improved capital stability income taxes Selected Precedent Transaction Key Statistics MedianMean
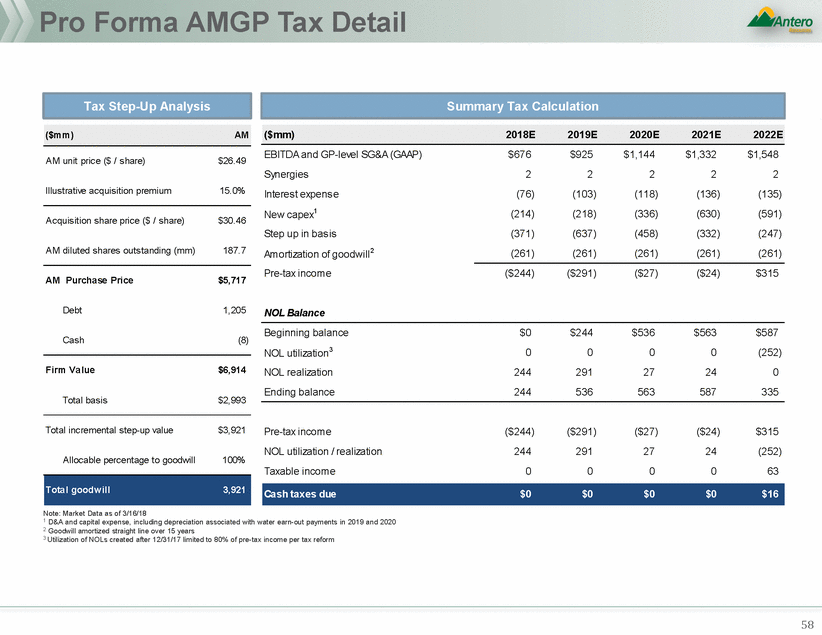
Pro Forma AMGP Tax Detail EBITDA and GP-level SG&A (GAAP) Synergies Interes t expens e $676 2 (76) (214) (371) (261) $925 2 (103) (218) (637) (261) $1,144 2 (118) (336) (458) (261) $1,332 2 (136) (630) (332) (261) $1,548 2 (135) (591) (247) (261) AM unit price ($ / share) $26.49 Illustrative acquisition premium 15.0% 1 New capex Acquisition share price ($ / share) $30.46 Step up in bas is Am ortization of goodwill2 Pre-tax incom e AM diluted shares outstanding (mm) 187.7 ($244) ($291) ($27) ($24) $315 AM Purchase Price $5,717 Debt 1,205 NOL Balance Beginning balance NOL utilization3 NOL realization Ending balance $0 0 244 244 $244 0 291 536 $536 0 27 563 $563 0 24 587 $587 (252) 0 335 Cash (8) Firm Value $6,914 Total basis $2,993 Total incremental step-up value $3,921 Pre-tax incom e NOL utilization / realization Taxable incom e ($244) 244 0 ($291) 291 0 ($27) 27 0 ($24) 24 0 $315 (252) 63 Allocable percentage to goodwill 100% Note: Market Data as of 3/16/18 1 D&A and capital expense, including depreciation associated with water earn-out payments in 2019 and 2020 2 Goodwill amortized straight line over 15 years 3 Utilization of NOLs created after 12/31/17 limited to 80% of pre-tax income per tax reform 58 Cash taxes due$0$0$0$0$16 Total goodwill3,921 ($mm)2018E2019E2020E2021E2022E ($mm)AM Tax Step-Up Analysis Summary Tax Calculation
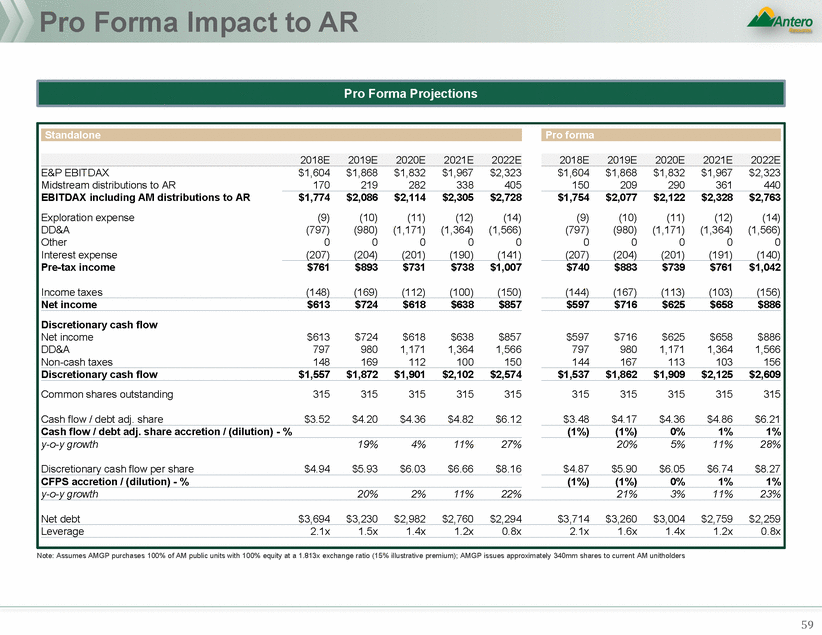
Pro Forma Impact to AR Note: Assumes AMGP purchases 100% of AM public units with 100% equity at a 1.813x exchange ratio (15% illustrative premium); AMGP issues approximately 340mm shares to current AM unitholders 59 E&P EBITDAX $1,604 $1,868 $1,832 $1,967 $2,323 $1,604 $1,868 $1,832 $1,967 $2,323 Midstream distributions to AR 170 219 282 338 405 150 209 290 361 440 EBITDAX including AM distributions to AR $1,774 $2,086 $2,114 $2,305 $2,728 $1,754 $2,077 $2,122 $2,328 $2,763 Exploration expense (9) (10) (11) (12) (14) (9) (10) (11) (12) (14) DD&A (797) (980) (1,171) (1,364) (1,566) (797) (980) (1,171) (1,364) (1,566) Other 0 0 0 0 0 0 0 0 0 0 Interest expense (207) (204) (201) (190) (141) (207) (204) (201) (191) (140) Pre-tax income $761 $893 $731 $738 $1,007 $740 $883 $739 $761 $1,042 Income taxes (148) (169) (112) (100) (150) (144) (167) (113) (103) (156) Net income $613 $724 $618 $638 $857 $597 $716 $625 $658 $886 Discretionary cash flow Net income $613 $724 $618 $638 $857 $597 $716 $625 $658 $886 DD&A 797 980 1,171 1,364 1,566 797 980 1,171 1,364 1,566 Non-cash taxes 148 169 112 100 150 144 167 113 103 156 Discretionary cash flow $1,557 $1,872 $1,901 $2,102 $2,574 $1,537 $1,862 $1,909 $2,125 $2,609 Common shares outstanding 315 315 315 315 315 315 315 315 315 315 Cash flow / debt adj. share $3.52 $4.20 $4.36 $4.82 $6.12 $3.48 $4.17 $4.36 $4.86 $6.21 Cash flow / debt adj. share accretion / (dilution) - % (1%) (1%) 0% 1% 1% y-o-y growth 19% 4% 11% 27% 20% 5% 11% 28% Discretionary cash flow per share $4.94 $5.93 $6.03 $6.66 $8.16 $4.87 $5.90 $6.05 $6.74 $8.27 CFPS accretion / (dilution) - % (1%) (1%) 0% 1% 1% y-o-y growth 20% 2% 11% 22% 21% 3% 11% 23% Net debt $3,694 $3,230 $2,982 $2,760 $2,294 $3,714 $3,260 $3,004 $2,759 $2,259 Leverage 2.1x 1.5x 1.4x 1.2x 0.8x 2.1x 1.6x 1.4x 1.2x 0.8x 2018E2019E2020E2021E2022E 2018E2019E2020E2021E2022E Pro forma Standalone Pro Forma Projections
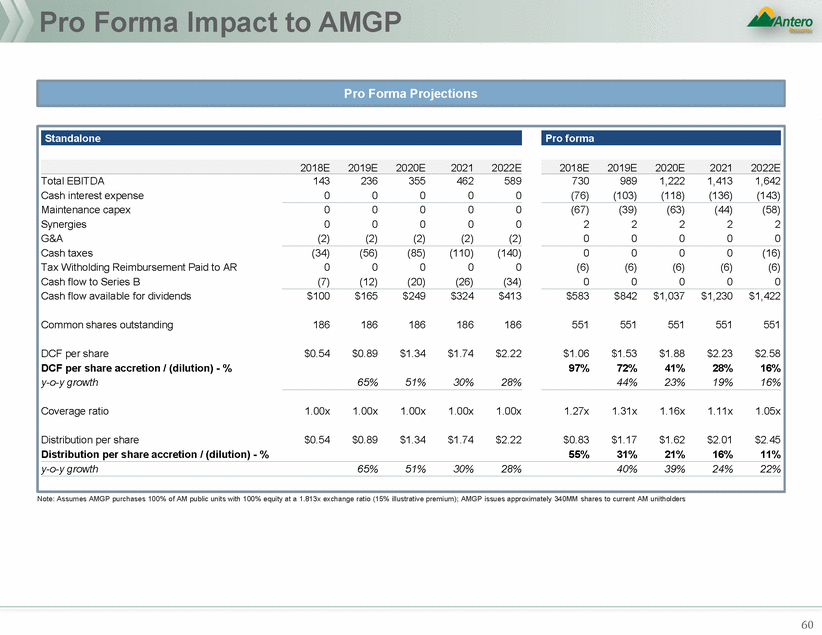
Pro Forma Impact to AMGP Note: Assumes AMGP purchases 100% of AM public units with 100% equity at a 1.813x exchange ratio (15% illustrative premium); AMGP issues approximately 340MM shares to current AM unitholders 60 Total EBITDA 143 236 355 462 589 730 989 1,222 1,413 1,642 Cash interest expense 0 0 0 0 0 (76) (103) (118) (136) (143) Maintenance capex 0 0 0 0 0 (67) (39) (63) (44) (58) Synergies 0 0 0 0 0 2 2 2 2 2 G&A (2) (2) (2) (2) (2) 0 0 0 0 0 Cash taxes (34) (56) (85) (110) (140) 0 0 0 0 (16) Tax Witholding Reimbursement Paid to AR 0 0 0 0 0 (6) (6) (6) (6) (6) Cash flow to Series B (7) (12) (20) (26) (34) 0 0 0 0 0 Cash flow available for dividends $100 $165 $249 $324 $413 $583 $842 $1,037 $1,230 $1,422 Common shares outstanding 186 186 186 186 186 551 551 551 551 551 DCF per share $0.54 $0.89 $1.34 $1.74 $2.22 $1.06 $1.53 $1.88 $2.23 $2.58 DCF per share accretion / (dilution) - % 97% 72% 41% 28% 16% y-o-y growth 65% 51% 30% 28% 44% 23% 19% 16% Coverage ratio 1.00x 1.00x 1.00x 1.00x 1.00x 1.27x 1.31x 1.16x 1.11x 1.05x Distribution per share $0.54 $0.89 $1.34 $1.74 $2.22 $0.83 $1.17 $1.62 $2.01 $2.45 Distribution per share accretion / (dilution) - % 55% 31% 21% 16% 11% y-o-y growth 65% 51% 30% 28% 40% 39% 24% 22% 2018E2019E2020E20212022E 2018E2019E2020E20212022E Pro forma Standalone Pro Forma Projections
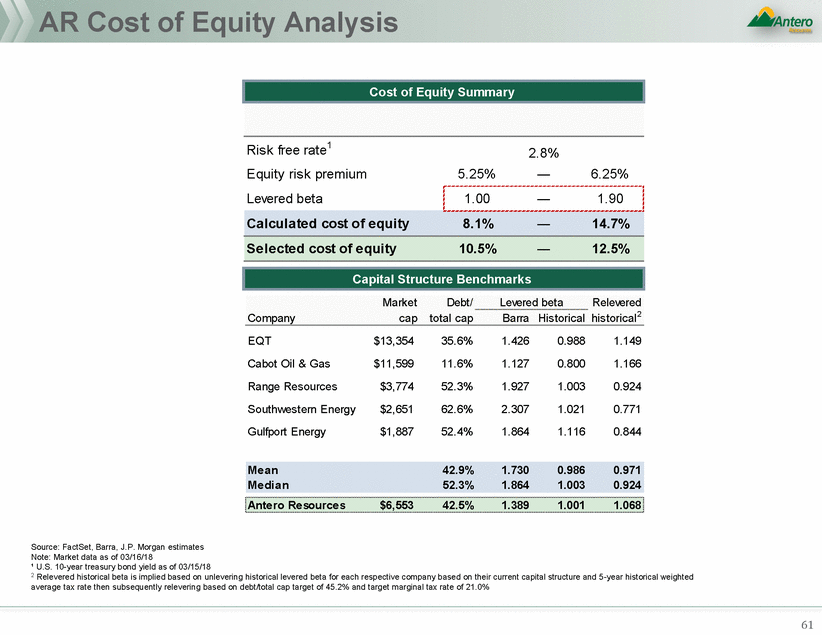
AR Cost of Equity Analysis Risk free rate1 Equity risk premium Levered beta 2.8% 5.25% 1.00 6.25% 1.90 EQT Cabot Oil & Gas Range Resources Southwestern Energy Gulfport Energy $13,354 $11,599 $3,774 $2,651 $1,887 35.6% 11.6% 52.3% 62.6% 52.4% 1.426 1.127 1.927 2.307 1.864 0.988 0.800 1.003 1.021 1.116 1.149 1.166 0.924 0.771 0.844 Source: FactSet, Barra, J.P. Morgan estimates Note: Market data as of 03/16/18 ¹ U.S. 10-year treasury bond yield as of 03/15/18 2 Relevered historical beta is implied based on unlevering historical levered beta for each respective company based on their current capital structure and 5-year historical weighted average tax rate then subsequently relevering based on debt/total cap target of 45.2% and target marginal tax rate of 21.0% 61 Antero Resources$6,55342.5%1.3891.0011.068 Mean42.9%1.7300.9860.971 Median52.3%1.8641.0030.924 MarketDebt/Levered betaRelevered Companycaptotal capBarra Historical historical2 Capital Structure Benchmarks Calculated cost of equity8.1%14.7% Selected cost of equity10.5%12.5% Cost of Equity Summary
AppendixA: AMAcquisition ofAMGPIDRs
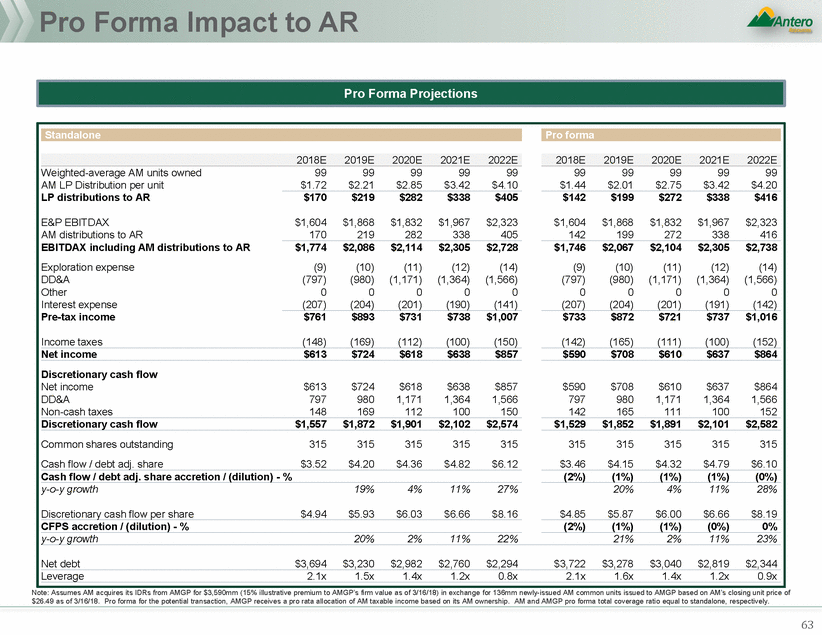
Pro Forma Impact to AR Note: Assumes AM acquires its IDRs from AMGP for $3,590mm (15% illustrative premium to AMGP’s firm value as of 3/16/18) in exchange for 136mm newly-issued AM common units issued to AMGP based on AM’s closing unit price of $26.49 as of 3/16/18. Pro forma for the potential transaction, AMGP receives a pro rata allocation of AM taxable income based on its AM ownership. AM and AMGP pro forma total coverage ratio equal to standalone, respectively. 63 Weighted-average AM units owned 99 99 99 99 99 99 99 99 99 99 AM LP Distribution per unit $1.72 $2.21 $2.85 $3.42 $4.10 $1.44 $2.01 $2.75 $3.42 $4.20 LP distributions to AR $170 $219 $282 $338 $405 $142 $199 $272 $338 $416 E&P EBITDAX $1,604 $1,868 $1,832 $1,967 $2,323 $1,604 $1,868 $1,832 $1,967 $2,323 AM distributions to AR 170 219 282 338 405 142 199 272 338 416 EBITDAX including AM distributions to AR $1,774 $2,086 $2,114 $2,305 $2,728 $1,746 $2,067 $2,104 $2,305 $2,738 Exploration expense (9) (10) (11) (12) (14) (9) (10) (11) (12) (14) DD&A (797) (980) (1,171) (1,364) (1,566) (797) (980) (1,171) (1,364) (1,566) Other 0 0 0 0 0 0 0 0 0 0 Interest expense (207) (204) (201) (190) (141) (207) (204) (201) (191) (142) Pre-tax income $761 $893 $731 $738 $1,007 $733 $872 $721 $737 $1,016 Income taxes (148) (169) (112) (100) (150) (142) (165) (111) (100) (152) Net income $613 $724 $618 $638 $857 $590 $708 $610 $637 $864 Discretionary cash flow Net income $613 $724 $618 $638 $857 $590 $708 $610 $637 $864 DD&A 797 980 1,171 1,364 1,566 797 980 1,171 1,364 1,566 Non-cash taxes 148 169 112 100 150 142 165 111 100 152 Discretionary cash flow $1,557 $1,872 $1,901 $2,102 $2,574 $1,529 $1,852 $1,891 $2,101 $2,582 Common shares outstanding 315 315 315 315 315 315 315 315 315 315 Cash flow / debt adj. share $3.52 $4.20 $4.36 $4.82 $6.12 $3.46 $4.15 $4.32 $4.79 $6.10 Cash flow / debt adj. share accretion / (dilution) - % (2%) (1%) (1%) (1%) (0%) y-o-y growth 19% 4% 11% 27% 20% 4% 11% 28% Discretionary cash flow per share $4.94 $5.93 $6.03 $6.66 $8.16 $4.85 $5.87 $6.00 $6.66 $8.19 CFPS accretion / (dilution) - % (2%) (1%) (1%) (0%) 0% y-o-y growth 20% 2% 11% 22% 21% 2% 11% 23% Net debt $3,694 $3,230 $2,982 $2,760 $2,294 $3,722 $3,278 $3,040 $2,819 $2,344 Leverage 2.1x 1.5x 1.4x 1.2x 0.8x 2.1x 1.6x 1.4x 1.2x 0.9x 2018E2019E2020E2021E2022E 2018E2019E2020E2021E2022E Pro forma Standalone Pro Forma Projections
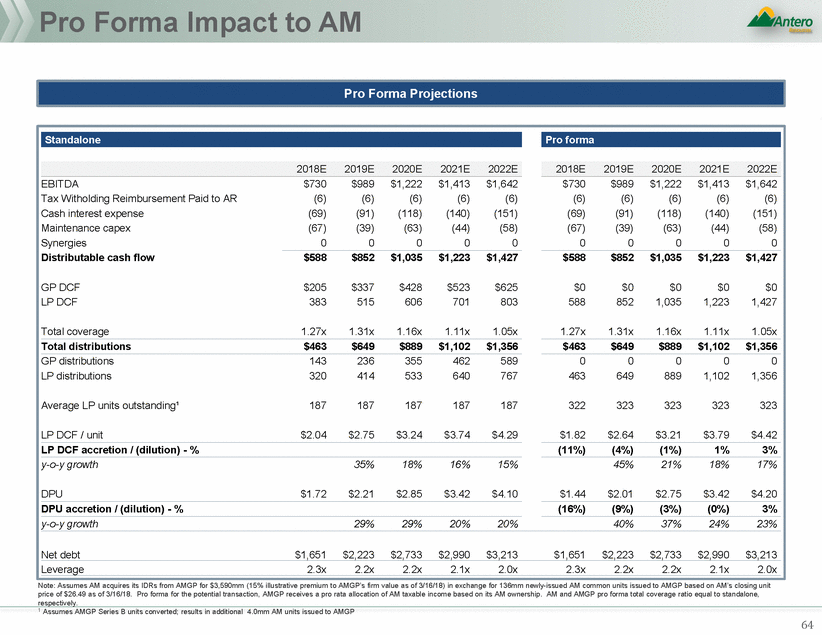
Pro Forma Impact to AM Note: Assumes AM acquires its IDRs from AMGP for $3,590mm (15% illustrative premium to AMGP’s firm value as of 3/16/18) in exchange for 136mm newly-issued AM common units issued to AMGP based on AM’s closing unit price of $26.49 as of 3/16/18. Pro forma for the potential transaction, AMGP receives a pro rata allocation of AM taxable income based on its AM ownership. AM and AMGP pro forma total coverage ratio equal to standalone, respectively. 1 Assumes AMGP Series B units converted; results in additional 4.0mm AM units issued to AMGP 64 EBITDA $730 $989 $1,222 $1,413 $1,642 $730 $989 $1,222 $1,413 $1,642 Tax Witholding Reimbursement Paid to AR (6) (6) (6) (6) (6) (6) (6) (6) (6) (6) Cash interest expense (69) (91) (118) (140) (151) (69) (91) (118) (140) (151) Maintenance capex (67) (39) (63) (44) (58) (67) (39) (63) (44) (58) Synergies 0 0 0 0 0 0 0 0 0 0 Distributable cash flow $588 $852 $1,035 $1,223 $1,427 $588 $852 $1,035 $1,223 $1,427 GP DCF $205 $337 $428 $523 $625 $0 $0 $0 $0 $0 LP DCF 383 515 606 701 803 588 852 1,035 1,223 1,427 Total coverage 1.27x 1.31x 1.16x 1.11x 1.05x 1.27x 1.31x 1.16x 1.11x 1.05x Total distributions $463 $649 $889 $1,102 $1,356 $463 $649 $889 $1,102 $1,356 GP distributions 143 236 355 462 589 0 0 0 0 0 LP distributions 320 414 533 640 767 463 649 889 1,102 1,356 Average LP units outstanding¹ 187 187 187 187 187 322 323 323 323 323 LP DCF / unit $2.04 $2.75 $3.24 $3.74 $4.29 $1.82 $2.64 $3.21 $3.79 $4.42 LP DCF accretion / (dilution) - % (11%) (4%) (1%) 1% 3% y-o-y growth 35% 18% 16% 15% 45% 21% 18% 17% DPU $1.72 $2.21 $2.85 $3.42 $4.10 $1.44 $2.01 $2.75 $3.42 $4.20 DPU accretion / (dilution) - % (16%) (9%) (3%) (0%) 3% y-o-y growth 29% 29% 20% 20% 40% 37% 24% 23% Net debt $1,651 $2,223 $2,733 $2,990 $3,213 $1,651 $2,223 $2,733 $2,990 $3,213 Leverage 2.3x 2.2x 2.2x 2.1x 2.0x 2.3x 2.2x 2.2x 2.1x 2.0x 2018E2019E2020E2021E2022E 2018E2019E2020E2021E2022E Pro forma Standalone Pro Forma Projections
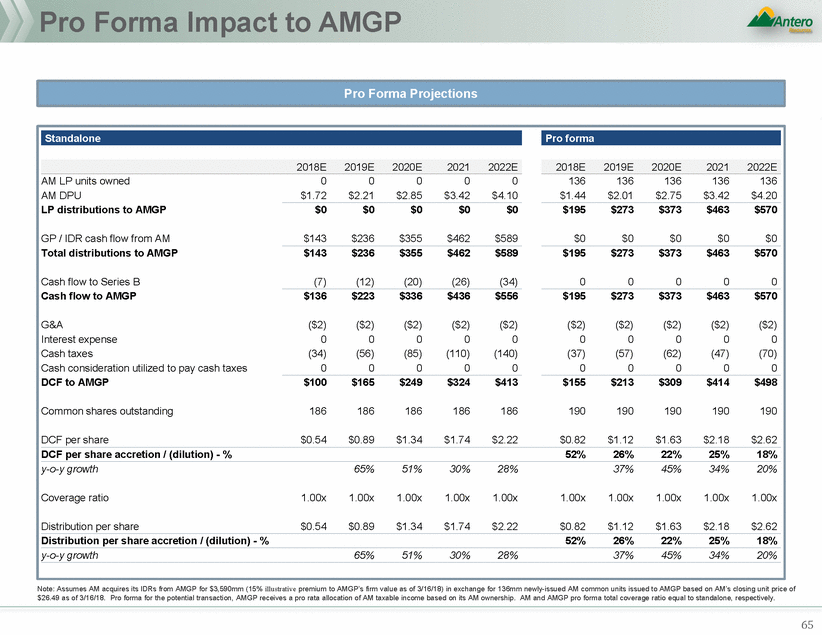
Pro Forma Impact to AMGP Note: Assumes AM acquires its IDRs from AMGP for $3,590mm (15% illustrative premium to AMGP’s firm value as of 3/16/18) in exchange for 136mm newly-issued AM common units issued to AMGP based on AM’s closing unit price of $26.49 as of 3/16/18. Pro forma for the potential transaction, AMGP receives a pro rata allocation of AM taxable income based on its AM ownership. AM and AMGP pro forma total coverage ratio equal to standalone, respectively. 65 AM LP units owned00000136136136136136 AM DPU$1.72$2.21$2.85$3.42$4.10$1.44$2.01$2.75$3.42$4.20 LP distributions to AMGP$0$0$0$0$0$195$273$373$463$570 GP / IDR cash flow from AM$143$236$355$462$589$0$0$0$0$0 Total distributions to AMGP$143$236$355$462$589$195$273$373$463$570 Cash flow to Series B(7)(12)(20)(26)(34)00000 Cash flow to AMGP$136$223$336$436$556$195$273$373$463$570 G&A($2)($2)($2)($2)($2)($2)($2)($2)($2)($2) Interest expense0000000000 Cash taxes(34)(56)(85)(110)(140)(37)(57)(62)(47)(70) Cash consideration utilized to pay cash taxes0000000000 DCF to AMGP$100$165$249$324$413$155$213$309$414$498 Common shares outstanding186186186186186190190190190190 DCF per share$0.54$0.89$1.34$1.74$2.22$0.82$1.12$1.63$2.18$2.62 DCF per share accretion / (dilution) - %52%26%22%25%18% y-o-y growth65%51%30%28%37%45%34%20% Coverage ratio1.00x1.00x1.00x1.00x1.00x1.00x1.00x1.00x1.00x1.00x Distribution per share$0.54$0.89$1.34$1.74$2.22$0.82$1.12$1.63$2.18$2.62 Distribution per share accretion / (dilution) - %52%26%22%25%18% y-o-y growth65%51%30%28%37%45%34%20% 2018E2019E2020E20212022E 2018E2019E2020E20212022E Pro forma Standalone Pro Forma Projections
Precedent IDR Buy-In Transactions acquires Source: Equity research, company filings Note: Andeavor Logistics and Andeavor transaction multiples are based on ANDX DCF pro forma for WNRL; ANDX GP growth adjusted to exclude 2017E GP DCF giveback; USAC multiples represent 2018E multiples given no 2017 figures available for proforma entity; 1 Based on 2018-2020E CAGR, adjusted for effect of $8.1bn drop down concurrent with simplification; 2 Estimates for DCF accretion based on company disclosure; in the absence of company disclosure based on equity research commentary; Long-term represents FY3+; 3 Broker estimates pre-announcement of DPU cut 66 Year 2010 2010 2010 2010 2010 2016 2017 2017 2017 2017 2018 2018 2018 Transaction value ($mm) $1,157 $2,092 $9,121 $948 $689 $6,869 $11,173 $3,768 $1,250 $10,067 $140 $7,200 $419 Structure MLP acquires public GP MLP acquires public GP MLP acquires public GP MLP acquires public GP MLP acquires privately held IDRs MLP acquires privately held IDRs MLP acquires privately held IDRs MLP acquires privately held IDRs MLP acquires privately held IDRs MLP acquires publicly held IDRs MLP acquires privately held IDRs MLP acquires privately held IDRs MLP public GP GP value / Curr. Year + 1 DCF 17.7x 21.3x 22.3x 13.8x 18.2x 11.9x 12.9x 11.1x 13.4x 11.5x 13.1x 12.4x 11.1x MLP LP Price / Curr. Year + 1 DCF 13.2x 14.5x 18.5x 12.3x 12.4x 10.1x 12.9x 11.4x 12.1x 11.6x 7.5x 12.1x 8.6x DCF valuation differential 4.4x 6.8x 3.8x 1.5x 5.8x 1.8x 0.1x (0.3x) 1.3x (0.1x) 5.7x 0.4x 2.4x GP value / Curr. Year + 1 distribution 20.0x 20.8x 23.0x 16.3x 29.7x 17.4x 23.2x 11.1x 14.1x 17.7x 35.9x 15.7x 6.8x MLP LP Price / Curr. Year + 1 distribution 14.7x 14.4x 23.7x 12.9x 14.8x 12.2x 16.1x 11.4x 12.4x 14.4x 8.3x 13.6x 7.1x Distribution valuation differential 5.3x 6.4x (0.7x) 3.4x 14.9x 5.2x 7.1x (0.3x) 1.7x 3.4x 27.6x 2.2x (0.3x) Forecast GP DCF growth (Curr. Year + 0 - 2) 14% 25% 11% 25% 34% 12% 11% 25% 12% 8%1 39% 14% 36%3 Forecast LP DCF growth (Curr. Year + 0 - 2) 6% 10% 6% 8% 7% 2% 2% 7% 4% 4%1 5% 5% 10% Timeline until accretion (years) 2 Long-term FY1 Long-term FY2 Long-term Long-term Long-term FY2 Immediate FY2 FY1 FY2 Long-term Precedent Transactions Key Statistics
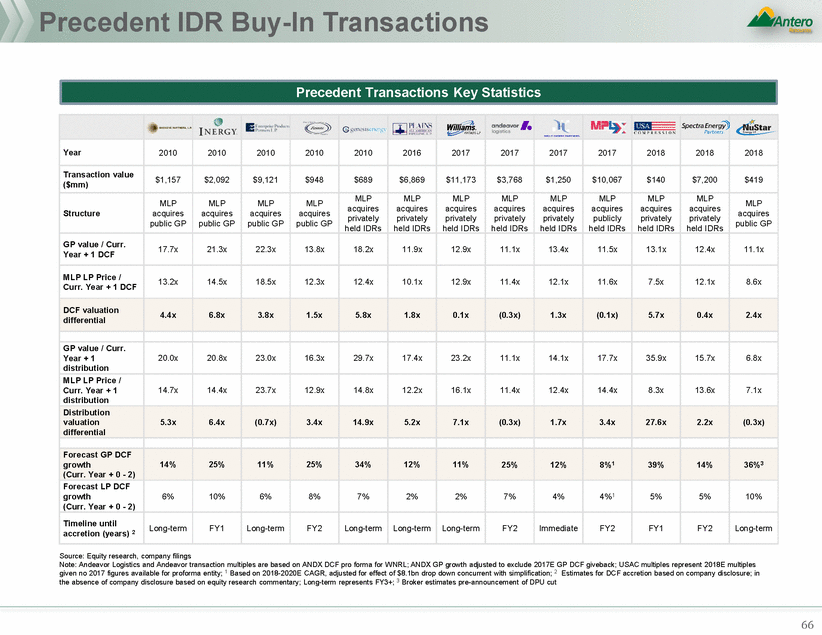
Market Reaction – Precedent IDR Buy-In Analysis public GP MLP acquires privately held IDRs 2 1/22/18 FY2 12.4x 15.7x 7.2 1% 2% 2% (20%) (8%) (13%) (2%) (0%) (7%) 4% MLP acquires privately held IDRs 1%3 3% 3 12/15/17 FY2 11.5x 17.7x 10.1 (5%) 2% (1%) 2% 10% 10% (4%) (8%) 3 14% (0%)3 10/19/17 privately held Immediate 13.4x 14.1x 1.3 0% 0% 0% (3%) 23% (8%) (0%) 5% MLP acquires privately held IDRs 3 3 8/14/17 FY2 11.1x 11.1x 3.8 (1%) 1% (0%) (1%) 10% 0% (1%) 0% (2%) (1%) MLP acquires privately held IDRs 7/11/16 Long-term 11.9x 17.4x 6.9 11% 12% 3% 10% 15% (1%) 8% 9% 10% 16% MLP acquires public GP 9/21/10 FY2 13.8x 16.3x 0.9 (4%) 0% 0% 10% 15% 7% (4%) 0% 4% 8% Long-term 22.3x 23.0x 9.1 (1%) 12% (0%) 9% 24% 7% (1%) 12% 2% 17% public GP MLP acquires public GP 8/9/10 FY1 21.3x 16.3x 2.1 (2%) 2% (1%) (11%) (8%) (1%) (1%) 3% (9%) (7%) Long-term 17.7x 5.3x 1.2 (4%) 18% 1% 8% 32% 12% (5%) 17% (4%) 20% public GP 1 Market reaction based on trading days from unaffected date 2 SEP relative reaction based on peer index that includes TRP, KMI, OKE, ETP, PAA, WMB 3 GP relative reaction based on peer index that includes VLO, PSX, HFC, MPC, ANDV 4 Based on company disclosure; in the absence of company disclosure based on equity research commentary; long-term represents FY3+ 67 6/11/10MLP acquires Mean14.7x$4.2(2%)2%(0%)1%8%1%(2%)2%1%6% Median13.1x$2.1(1%)2%(0%)4%10%2%(1%)0%0%4% 9/7/10MLP acquires MLP acquires 12/28/10privately heldLong-term18.2x29.7x0.73%-1%6%-4%2%-2%-IDRs MLP acquires 1/9/17privately heldLong-term12.9x23.2x11.2(0%)(11%)(2%)4%(12%)4%1%(9%)(1%)(16%) IDRs MLP acquires IDRs MLP acquires 1/16/18privately heldFY113.1x33.3x0.11%1%(1%)4%(7%)(12%)2%2%16%4% IDRs Market reaction1 AnnouncementTimeline until GP value / curr. GP value / curr. Transaction1 day30 day dateCompanyStructureaccretion (years)4 Year + 1 DCFYear + 1 dist. value ($bn)LPGPAMZLPGPAMZ Relative reaction 1 day LPGP 30 day LPGP 2/8/18MLP acquiresLong-term11.1x6.8x$0.7(19%)(18%)(3%)---(16%)(15%)--Precedent IDR Buy-in Analysis
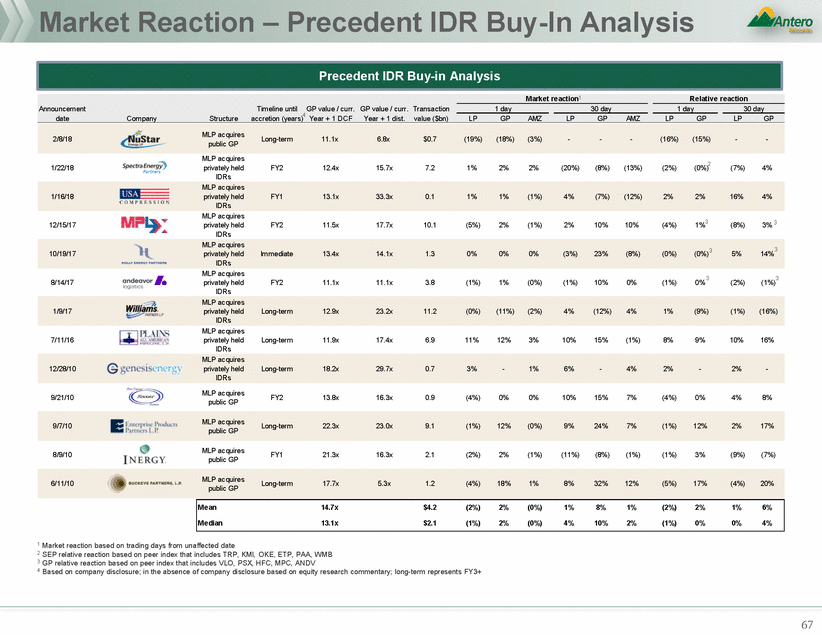
AppendixB: ARShareBuyback Analysis
AR Share Repurchase Analysis Standalone Share repurchase $10.00 $8.00 $6.00 $4.00 $2.00 $0.00 $8.66 Buybacks Total uses 300 300 0 0 $7.05 $300 $300 $0 $0 $4.94 $5.00 AR leverage capacity Water earn outs AR sale of AM units Total sources 300 0 0 300 0 0 0 0 0 0 0 0 2018E 2019E 2020E 2021E 2022E $300 $300 $0 $0 Acc / (dil) 1.3% 4.2% 5.7% 5.8% 6.2% AR Net Debt / LTM EBITDAX (including AM distributions) Net free cash flow ($mm) Standalone ($69) $464 $248 $222 $466 Standalone 2.1x 1.5x 1.4x 1.2x 0.8x Pro forma ($77) $440 $215 $189 $433 Pro forma 2.3x 1.9x 1.7x 1.5x 1.1x Difference ($8) ($25) ($33) ($33) ($33) Standalone Share repurchase $10.00 $8.00 $6.00 $4.00 $2.00 $0.00 $8.70 Buybacks Total uses 450 150 0 0 $7.09 $6.03 $6.41 $6.66 $5.93 $6.27 $450 $150 $0 $0 $4.94 $5.05 AR leverage capacity Water earn outs AR sale of AM units Total sources 240 210 0 150 0 0 0 0 0 0 0 0 2018E 2019E 2020E 2021E 2022E $450 $150 $0 $0 Acc / (dil) 2.3% 5.6% 6.3% 6.5% 6.7% AR Net Debt / LTM EBITDAX (including AM distributions) Net free cash flow ($mm) Standalone ($69) $464 $248 $222 $466 Standalone 2.1x 1.5x 1.4x 1.2x 0.8x Pro forma ($76) $447 $226 $201 $444 Pro forma 2.2x 1.7x 1.6x 1.4x 1.0x Difference ($7) ($17) ($21) ($21) ($21) 1 Based on PV-8.5 of earn-out proceeds discounted to 5/1/18 69 2018E2019E2020E2021E2022E 2018E2019E2020E2021E2022E Sources ($mm) 2018201920202021 $8.16 $600mm repurchase: Water earn-out monetization1 + AR debt issuance Uses ($mm) 2018201920202021 2018E2019E2020E2021E2022E 2018E2019E2020E2021E2022E Sources ($mm) 2018201920202021 $8.16 $5.93 $6.18$6.03 $6.37$6.66 $600mm repurchase: AR debt issuance in 2018 and 2019 Uses ($mm) 2018201920202021 Illustrative AR Share Repurchase Analysis (Discretionary Cash Flow / Share)
