Project Alpine Counterproposal Materials July 14, 2018 CONFIDENTIAL DRAFT SUBJECT TO CHANGE

Project Alpine Counterproposal Materials July 14, 2018 CONFIDENTIAL DRAFT SUBJECT TO CHANGE

Observations on AMGP Proposal AMGP share price does not reflect the dilutive impact of Series B exchange Taxable transaction unduly burdens public unitholders; pro forma dividend taxes are significantly higher than status quo distribution taxes Benefits of transaction, such as distribution accretion, should be shared in a more balanced manner These factors suggest AMGP’s proposal is well below market and any measure of implied intrinsic value Public AM unitholders would own less than 30% of the PF C-corp, with little practical governance benefit Given AM’s yield and growth profile, there is no near-term compelling driver for AM to do a transaction 2 CONFIDENTIAL DRAFT SUBJECT TO CHANGE
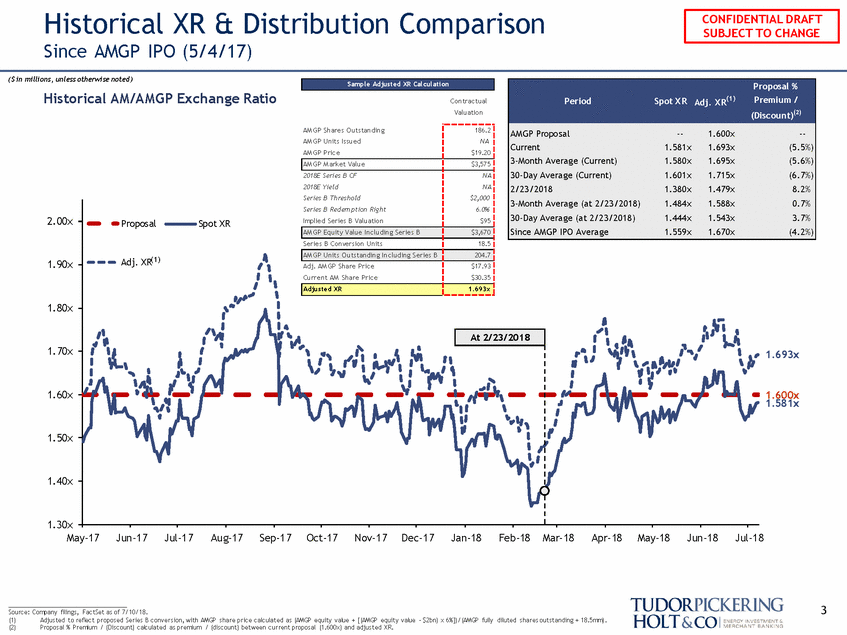
Historical XR & Distribution Since AMGP IPO (5/4/17) Comparison ($ in millions, unless otherwise noted) Historical AM/AMGP Exchange Ratio Contrac tual Valuation AM GP Shares O utstanding AM GP Units Issued AM GP Pric e 186.2 NA $19.20 2018E Series B CF 2018E Yield Series B Threshold NA NA $2,000 2.00x 1.90x 1.80x 1.70x 1.693x 1.60x 1.600x 1.581x 1.50x 1.40x 1.30x May-17 Jun-17 Jul-17 Aug-17 Sep-17 Oct-17 Nov-17 Dec-17 Jan-18 Feb-18Mar-18 Apr-18 May-18 Jun-18 Jul-18 ___________________________________ Source: Company filings, FactSet as of 7/10/18. 3 (1) (2) Adjusted to reflect proposed Series B conversion, with AMGP share price calculated as (AMGP equity value + [(AMGP equity value - $2bn) x 6%])/(AMGP fully diluted shares outstanding + 18.5mm). Proposal % Premium / (Discount) calculated as premium / (discount) between current proposal (1.600x) and adjusted X R. Series B Redem ption Right 6.0% Proposal Spot XR Implied Series B Valuation $95 Series B Conversion Units 18.5 Adj. XR(1) Adj. AM GP Share Pric e $17.93 Current AM Share Pric e $30.35 At 2/23/2018 Adjusted XR 1.693x AM GP Units O utstanding Inc luding Series B 204.7 AM GP Equity Value Inc luding Series B $3,670 AM GP M arket Value $3,575 Sample Adjusted XR Calculation Proposal % PeriodSpot X R Adj. X R(1) Premium / (Discount)(2) AMGP Proposal--1.600x--Current1.581x1.693x-(5.5%) 3-Month Average (Current)1.580x1.695x(5.6%) 30-Day Average (Current)1.601x1.715x(6.7%) 2/23/20181.380x1.479x8.2% 3-Month Average (at 2/23/2018)1.484x1.588x0.7% 30-Day Average (at 2/23/2018)1.444x1.543x3.7% Since AMGP IPO Average1.559x1.670x(4.2%) CONFIDENTIAL DRAFT SUBJECT TO CHANGE
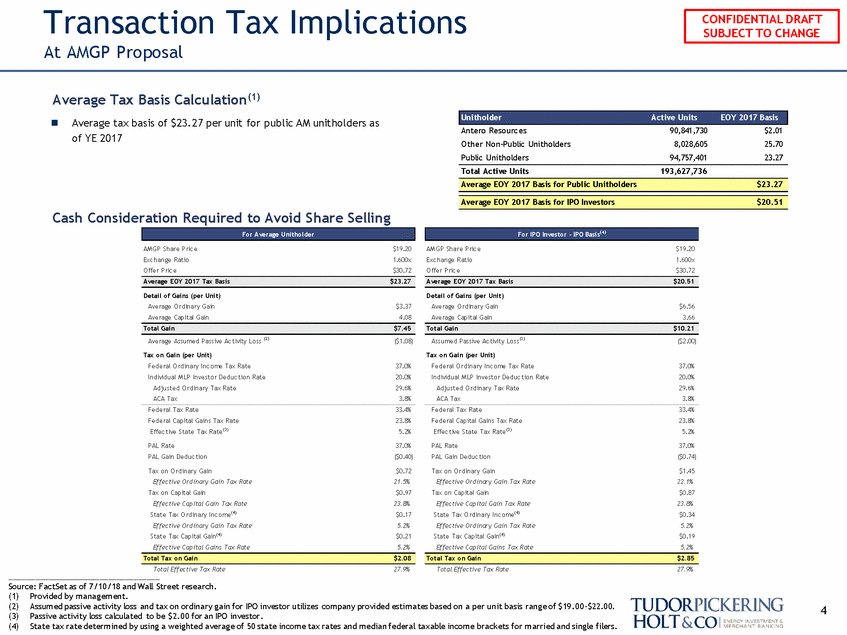
Transaction Tax Implications At AMGP Proposal Average Tax Basis Calculation(1) Average tax basis of $23.27 per unit for public AM unitholders as of YE 2017 Antero Resourc es O ther Non-Public Unitholders Public Unitholders 90,841,730 8,028,605 94,757,401 $2.01 25.70 23.27 Total Active Units 193,627,736 Cash Consideration Required to Avoid Share Selling AM GP Share Pric e Exc hange Ratio Offer Pric e $19.20 1.600x $30.72 AM GP Share Pric e Exc hange Ratio Offer Pric e $19.20 1.600x $30.72 Detail of Gains (per Unit) Average Ordinary Gain Average Capital Gain Detail of Gains (per Unit) Average Ordinary Gain Average Capital Gain $3.37 4.08 $6.56 3.66 Average Assumed Passive Ac tivity Loss (2) Tax on Gain (per Unit) Federal Ordinary Inc ome Tax Rate Individual M LP Investor Deduc tion Rate Adjusted Ordinary Tax Rate ACA Tax Federal Tax Rate Federal Capital Gains Tax Rate Effec tive State Tax Rate( 3) PAL Rate PAL Gain Deduc tion Assumed Passive Ac tivity Loss(3) Tax on Gain (per Unit) Federal Ordinary Inc ome Tax Rate Individual M LP Investor Deduc tion Rate Adjusted Ordinary Tax Rate ACA Tax Federal Tax Rate Federal Capital Gains Tax Rate Effec tive State Tax Rate( 3) PAL Rate PAL Gain Deduc tion ($1.08) ($2.00) 37.0% 20.0% 29.6% 3.8% 33.4% 23.8% 5.2% 37.0% ($0.40) 37.0% 20.0% 29.6% 3.8% 33.4% 23.8% 5.2% 37.0% ($0.74) Tax on Ordinary Gain Effective Ordinary Gain Tax Rate Tax on Capital Gain Effective Capital Gain Tax Rate State Tax Ordinary Inc ome( 4) Effective Ordinary Gain Tax Rate State Tax Capital Gain( 4) Effective Capital Gains Tax Rate $0.72 21.5% $0.97 23.8% $0.17 5.2% $0.21 5.2% Tax on Ordinary Gain Effective Ordinary Gain Tax Rate Tax on Capital Gain Effective Capital Gain Tax Rate State Tax Ordinary Inc ome( 4) Effective Ordinary Gain Tax Rate State Tax Capital Gain( 4) Effective Capital Gains Tax Rate $1.45 22.1% $0.87 23.8% $0.34 5.2% $0.19 5.2% Total Effective Tax Rate 27.9% Total Effective Tax Rate 27.9% Source: FactSet as of 7/10/18 and Wall Street research. (1) (2) (3) (4) Provided by management. Assumed passive activity loss and tax on ordinary gain for IPO investor utilizes company provided estimates based on a per unit basis range of $19.00-$22.00. Passive activity loss calculated to be $2.00 for an IPO investor. State tax rate determined by using a weighted average of 50 state income tax rates and median federal taxable income brackets for married and single filers. 4 Total Tax on Gain $2.85 Total Tax on Gain $2.08 Total Gain $10.21 Total Gain $7.45 Average EOY 2017 Tax Basis $20.51 Average EOY 2017 Tax Basis $23.27 For IPO Investor - IPO Basis(4) For Average Unitholder Average EOY 2017 Basis for Public Unitholders $23.27 Average EOY 2017 Basis for IPO Investors $20.51 Unitholder Active Units EOY 2017 Basis CONFIDENTIAL DRAFT SUBJECT TO CHANGE
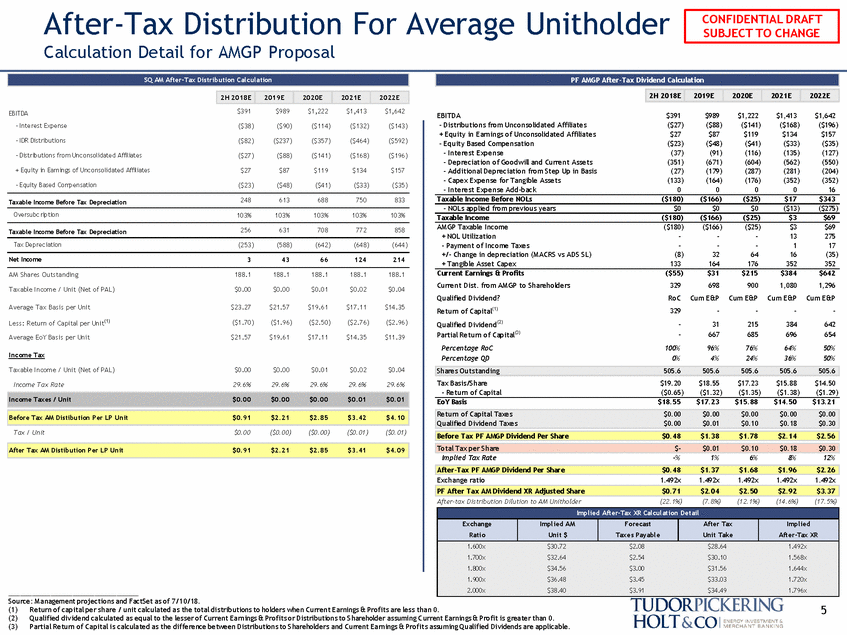
After-Tax Distribution For Average Unitholder Calculation Detail for AMGP Proposal 2019E 2020E 2021E 2022E $391 $989 $1,222 $1,413 $1,642 EBITDA - Interest Expense EBITDA - Distributions from Unconsolidated Affiliates + Equity in Earnings of Unconsolidated Affiliates - Equity Based Compensation - Interest Expense - Depreciation of Goodwill and Current Assets - Additional Depreciation from Step Up in Basis - Capex Expense for Tangible Assets - Interest Expense Add-back $391 ($27) $27 ($23) (37) (351) (27) (133) 0 $989 ($88) $87 ($48) (91) (671) (179) (164) 0 $1,222 ($141) $119 ($41) (116) (604) (287) (176) 0 $1,413 ($168) $134 ($33) (135) (562) (281) (352) 0 $1,642 ($196) $157 ($35) (127) (550) (204) (352) 16 ($38) ($90) ($114) ($132) ($143) - IDR Distributions ($82) ($237) ($357) ($464) ($592) - Distributions from Unc onsolidated Affiliates ($27) ($88) ($141) ($168) ($196) + Equity in Earnings of Unc onsolidated Affiliates $27 $87 $119 $134 $157 - Equity Based Compensation ($23) ($48) ($41) ($33) ($35) Taxable Income Before NOLs ($180) ($166) ($25) $17 $343 248 613 688 750 833 Taxable Income Before Tax Depreciation - NOLs applied from previous years $0 $0 $0 ($13) ($275) O versubc ription 103% 103% 103% 103% 103% Taxable Income ($180) ($166) ($25) $3 $69 AM GP Taxable Income + NOL Utilization - Payment of Income Taxes +/-Change in depreciation (M ACRS vs ADS SL) + Tangible Asset Capex ($180) - - (8) 133 ($166) - - 32 164 ($25) - - 64 176 $3 13 1 16 352 $69 275 17 (35) 352 256 631 708 772 858 Taxable Income Before Tax Depreciation Tax Deprec iation (253) (588) (642) (648) (644) Net Income 3 43 66 124 214 Current Earnings & Profits Current Dist. from AM GP to Shareholders Qualified Dividend? Return of Capital(1) Qualified Dividend(2) Partial Return of Capital(3) Percentage RoC Percentage QD ($55) 329 RoC 329 - - 100% 0% $31 698 Cum E&P - 31 667 96% 4% $215 900 Cum E&P - 215 685 76% 24% $384 1,080 Cum E&P - 384 696 64% 36% $642 1,296 Cum E&P - 642 654 50% 50% AM Shares Outstanding 188.1 188.1 188.1 188.1 188.1 Taxable Income / Unit (Net of PAL) $0.00 $0.00 $0.01 $0.02 $0.04 Average Tax Basis per Unit $23.27 $21.57 $19.61 $17.11 $14.35 Less: Return of Capital per Unit(1) Average EoY Basis per Unit ($1.70) ($1.96) ($2.50) ($2.76) ($2.96) $21.57 $19.61 $17.11 $14.35 $11.39 Income Tax Taxable Income / Unit (Net of PAL) $0.00 $0.00 $0.01 $0.02 $0.04 Tax Basis/Share - Return of Capital $19.20 ($0.65) $18.55 ($1.32) $17.23 ($1.35) $15.88 ($1.38) $14.50 ($1.29) Income Tax Rate 29.6% 29.6% 29.6% 29.6% 29.6% EoY Basis $18.55 $17.23 $15.88 $14.50 $13.21 Qualified Dividend Taxes $0.00 $0.01 $0.10 $0.18 $0.30 Tax / Unit $0.00 ($0.00) ($0.00) ($0.01) ($0.01) Implied Tax Rate -% 1% 6% 8% 12% Exchange ratio 1.492x 1.492x 1.492x 1.492x 1.492x After-tax Distribution Dilution to AM Unitholder (22.1%) (7.8%) (12.1%) (14.6%) (17.5%) Source: Management projections and FactSet as of 7/10/18. 5 (1) (2) (3) Return of capital per share / unit calculated as the total distributions to holders when Current Earnings & Profits are less than 0. Qualified dividend calculated as equal to the lesser of Current Earnings & Profits or Distributions to Shareholder assuming C urrent Earnings & Profit is greater than 0. Partial Return of Capital is calculated as the difference between Distributions to Shareholders and Current Earnings & Profits assuming Qualified Dividends are applicable. Implied After-Tax XR Calculation Detail Exchange Ratio Implied AM Unit $ Forecast Taxes Payable After Tax Unit Take Implied After-Tax XR 1.600x $30.72 $2.08 $28.64 1.492x 1.700x $32.64 $2.54 $30.10 1.568x 1.800x $34.56 $3.00 $31.56 1.644x 1.900x $36.48 $3.45 $33.03 1.720x 2.000x $38.40 $3.91 $34.49 1.796x PF After Tax AM Dividend XR Adjusted Share $0.71 $2.04 $2.50 $2.92 $3.37 After-Tax PF AMGP Dividend Per Share $0.48 $1.37 $1.68 $1.96 $2.26 After Tax AM Distibution Per LP Unit $0.91 $2.21 $2.85 $3.41 $4.09 Return of Capital Taxes $0.00 $0.00 $0.00 $0.00 $0.00 Before Tax PF AMGP Dividend Per Share $0.48 $1.38 $1.78 $2.14 $2.56 Total Tax per Share $-$0.01 $0.10 $0.18 $0.30 Income Taxes / Unit $0.00 $0.00 $0.00 $0.01 $0.01 Before Tax AM Distibution Per LP Unit $0.91 $2.21 $2.85 $3.42 $4.10 Shares Outstanding 505.6 505.6 505.6 505.6 505.6 SQ AM After-Tax Distribution Calculation PF AMGP After-Tax Dividend Calculation 2H 2018E 2H 2018E 2019E 2020E 2021E 2022E CONFIDENTIAL DRAFT SUBJECT TO CHANGE
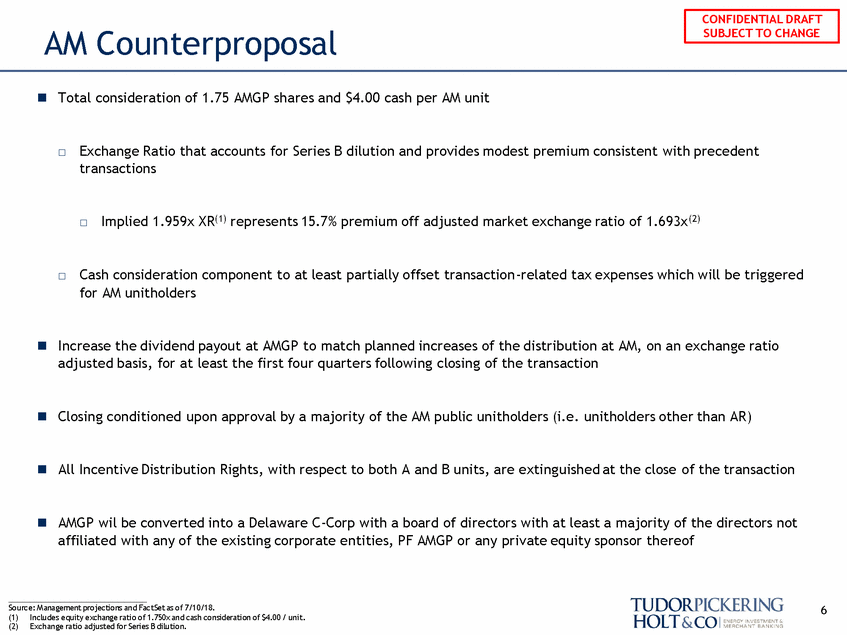
AM Counterproposal Total consideration of 1.75 AMGP shares and $4.00 cash per AM unit Exchange Ratio that accounts for Series B dilution and provides modest premium consistent with precedent transactions Implied 1.959x XR(1) represents 15.7% premium off adjusted market exchange ratio of 1.693x(2) Cash consideration component to at least partially offset transaction-related tax expenses which will be triggered for AM unitholders Increase the dividend payout at AMGP to match planned increases of the distribution at AM, on an exchange ratio adjusted basis, for at least the first four quarters following closing of the transaction Closing conditioned upon approval by a majority of the AM public unitholders (i.e. unitholders other than AR) All Incentive Distribution Rights, with respect to both A and B units, are extinguished at the close of the transaction AMGP wil be converted into a Delaware C-Corp with a board of directors with at least a majority of the directors not affiliated with any of the existing corporate entities, PF AMGP or any private equity sponsor thereof Source: M anagement projections and FactSet as of 7/10/18. (1) Includes equity exchange ratio of 1.750x and cash consideration of $4.00 / unit. (2) Exchange ratio adjusted for Series B dilution. 6 CONFIDENTIAL DRAFT SUBJECT TO CHANGE
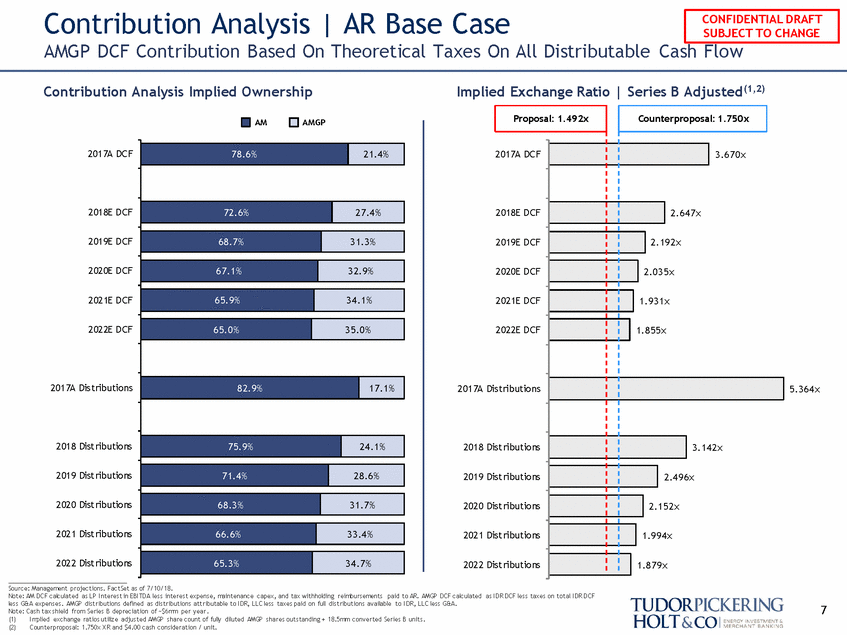
Contribution Analysis | AR Base Case AMGP DCF Contribution Based On Theoretical Taxes On All Distributable Cash Flow Contribution Analysis Implied Ownership Implied Exchange Ratio | Series B Adjusted(1,2) AM AMGP 2017A DCF 2018E DCF 2019E DCF 2020E DCF 2021E DCF 2022E DCF 2017A Distributions 2017A Di 5.364x 2018 Distributions 2018 Di 2019 Distributions 2019 Di 2020 Distributions 2020 Di 2021 Distributions 2021 Di 2022 Distributions ___________________________________ 2022 Di Source: Management projections. FactSet as of 7/10/18. Note: AM DCF calculated as LP I nterest in EBI TDA less interest expense, maintenance capex, and tax withholding reimbursements paid to AR. AMGP DCF calculated as I DR DCF less taxes on total I DR DCF less G&A expenses. AMGP distributions defined as distributions attributable to I DR, LLC less taxes paid on full distributions available to I DR, LLC less G&A. Note: Cash tax shield from Series B depreciation of ~$6mm per year . (1) I mplied exchange ratios utilize adjusted AMGP share count of fully diluted AMGP shares outstanding + 18.5mm converted Series B units. (2) Counterproposal: 1.750x X R and $4.00 cash consideration / unit. 7 78.6% 21.4% 72.6% 27.4% 68.7% 31.3% 67.1% 32.9% 65.9% 34.1% 65.0% 35.0% 82.9% 17.1% 75.9% 24.1% 71.4% 28.6% 68.3% 31.7% 66.6% 33.4% 65.3% 34.7% Proposal: 1.492x Counterproposal: 1.750x 2017A DCF 2018E DCF 2019E DCF 2020E DCF 2021E DCF 2022E DCF stributions stributions stributions stributions stributions stributions 3.670x 2.647x 2.192x 2.035x 1.931x 1.855x 3.142x 2.496x 2.152x 1.994x 1.879x CONFIDENTIAL DRAFT SUBJECT TO CHANGE
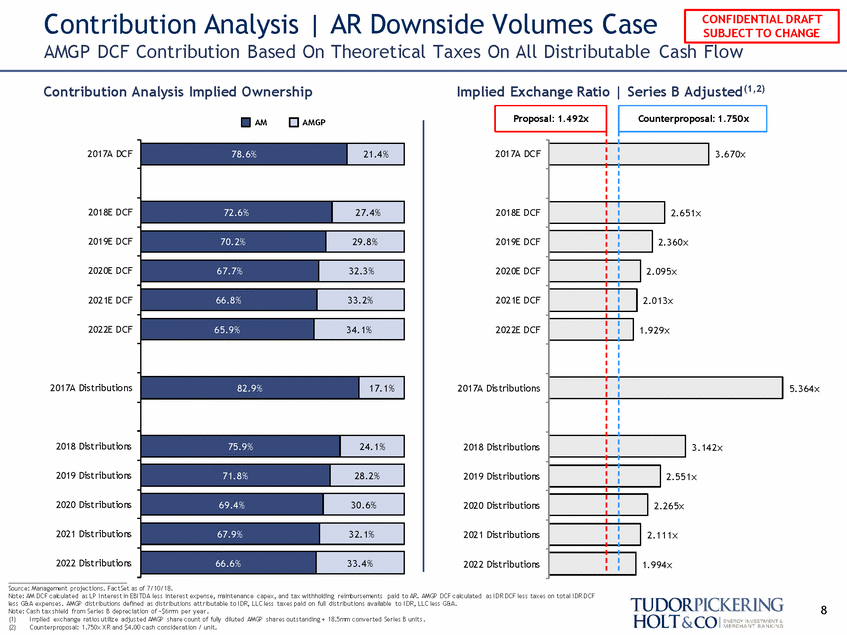
Contribution Analysis | AR Downside Volumes Case AMGP DCF Contribution Based On Theoretical Taxes On All Distributable Cash Flow Contribution Analysis Implied Ownership Implied Exchange Ratio | Series B Adjusted(1,2) AM AMGP 2017A DCF 2018E DCF 2019E DCF 2020E DCF 2021E DCF 2022E DCF 2017A Distributions 2017A Di 5.364x 2018 Distributions 2018 Di 2019 Distributions 2019 Di 2020 Distributions 2020 Di 2021 Distributions 2021 Di 2022 Distributions ___________________________________ 2022 Di Source: Management projections. FactSet as of 7/10/18. Note: AM DCF calculated as LP I nterest in EBI TDA less interest expense, maintenance capex, and tax withholding reimbursements paid to AR. AMGP DCF calculated as I DR DCF less taxes on total I DR DCF less G&A expenses. AMGP distributions defined as distributions attributable to I DR, LLC less taxes paid on full distributions available to I DR, LLC less G&A. Note: Cash tax shield from Series B depreciation of ~$6mm per year . (1) I mplied exchange ratios utilize adjusted AMGP share count of fully diluted AMGP shares outstanding + 18.5mm converted Series B units . (2) Counterproposal: 1.750x X R and $4.00 cash consideration / unit. 8 78.6% 21.4% 72.6% 27.4% 70.2% 29.8% 67.7% 32.3% 66.8% 33.2% 65.9% 34.1% 82.9% 17.1% 75.9% 24.1% 71.8% 28.2% 69.4% 30.6% 67.9% 32.1% 66.6% 33.4% Proposal: 1.492x Counterproposal: 1.750x 2017A DCF 2018E DCF 2019E DCF 2020E DCF 2021E DCF 2022E DCF stributions stributions stributions stributions stributions stributions 3.670x 2.651x 2.360x 2.095x 2.013x 1.929x 3.142x 2.551x 2.265x 2.111x 1.994x CONFIDENTIAL DRAFT SUBJECT TO CHANGE
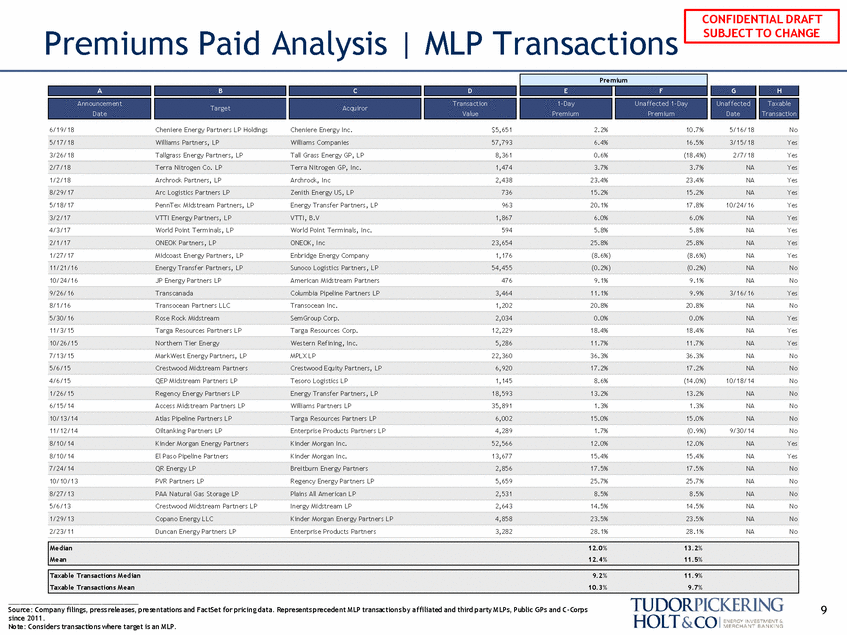
Premiums Paid Analysis | MLP Transactions 6/19/18 Cheniere Energy Partners LP Holdings Cheniere Energy Inc. $5,651 2.2% 10.7% 5/16/18 No 3/26/18 Tallgrass Energy Partners, LP Tall Grass Energy GP, LP 8,361 0.6% (18.4%) 2/7/18 Yes 1/2/18 Archrock Partners, LP Archrock, Inc 2,438 23.4% 23.4% NA Yes 5/18/17 PennTex Midstream Partners, LP Energy Transfer Partners, LP 963 20.1% 17.8% 10/24/16 Yes 4/3/17 World Point Terminals, LP World Point Terminals, Inc. 594 5.8% 5.8% NA Yes 1/27/17 Midcoast Energy Partners, LP Enbridge Energy Company 1,176 (8.6%) (8.6%) NA Yes 10/24/16 JP Energy Partners LP American Midstream Partners 476 9.1% 9.1% NA No 8/1/16 Transocean Partners LLC Transocean Inc. 1,202 20.8% 20.8% NA No 11/3/15 Targa Resources Partners LP Targa Resources Corp. 12,229 18.4% 18.4% NA Yes 7/13/15 MarkWest Energy Partners, LP MPLX LP 22,360 36.3% 36.3% NA No 4/6/15 QEP Midstream Partners LP Tesoro Logistics LP 1,145 8.6% (14.0%) 10/18/14 No 6/15/14 Access Midstream Partners LP Williams Partners LP 35,891 1.3% 1.3% NA No 11/12/14 Oiltanking Partners LP Enterprise Products Partners LP 4,289 1.7% (0.9%) 9/30/14 No 8/10/14 El Paso Pipeline Partners Kinder Morgan Inc. 13,677 15.4% 15.4% NA Yes 10/10/13 PVR Partners LP Regency Energy Partners LP 5,659 25.7% 25.7% NA No 5/6/13 Crestwood Midstream Partners LP Inergy Midstream LP 2,643 14.5% 14.5% NA No 2/23/11 Duncan Energy Partners LP Enterprise Products Partners 3,282 28.1% 28.1% NA No 9 Source: Company filings, press releases, presentations and FactSet for pricing data. Represents precedent MLP transactions by affiliated and third party MLPs, Public GPs and C-Corps since 2011. Note: Considers transactions where target is an MLP. Taxable Transactions Median 9.2% 11.9% Taxable Transactions Mean 10.3% 9.7% Median 12.0% 13.2% Mean 12.4% 11.5% 1/29/13 Copano Energy LLC Kinder Morgan Energy Partners LP 4,858 23.5% 23.5% NA No 8/27/13 PAA Natural Gas Storage LP Plains All American LP 2,531 8.5% 8.5% NA No 7/24/14 QR Energy LP Breitburn Energy Partners 2,856 17.5% 17.5% NA No 8/10/14 Kinder Morgan Energy Partners Kinder Morgan Inc. 52,566 12.0% 12.0% NA Yes 10/13/14 Atlas Pipeline Partners LP Targa Resources Partners LP 6,002 15.0% 15.0% NA No 1/26/15 Regency Energy Partners LP Energy Transfer Partners, LP 18,593 13.2% 13.2% NA No 5/6/15 Crestwood Midstream Partners Crestwood Equity Partners, LP 6,920 17.2% 17.2% NA No 10/26/15 Northern Tier Energy Western Refining, Inc. 5,286 11.7% 11.7% NA Yes 5/30/16 Rose Rock Midstream SemGroup Corp. 2,034 0.0% 0.0% NA Yes 9/26/16 Transcanada Columbia Pipeline Partners LP 3,464 11.1% 9.9% 3/16/16 Yes 11/21/16 Energy Transfer Partners, LP Sunoco Logistics Partners, LP 54,455 (0.2%) (0.2%) NA No 2/1/17 ONEOK Partners, LP ONEOK, Inc 23,654 25.8% 25.8% NA Yes 3/2/17 VTTI Energy Partners, LP VTTI, B.V 1,867 6.0% 6.0% NA Yes 8/29/17 Arc Logistics Partners LP Zenith Energy US, LP 736 15.2% 15.2% NA Yes 2/7/18 Terra Nitrogen Co. LP Terra Nitrogen GP, Inc. 1,474 3.7% 3.7% NA Yes 5/17/18 Williams Partners, LP Williams Companies 57,793 6.4% 16.5% 3/15/18 Yes Premium A B C D E F G H Announcement Date Target Acquiror Transaction Value 1-Day Premium Unaffected 1-Day Premium Unaffected Date Taxable Transaction CONFIDENTIAL DRAFT SUBJECT TO CHANGE
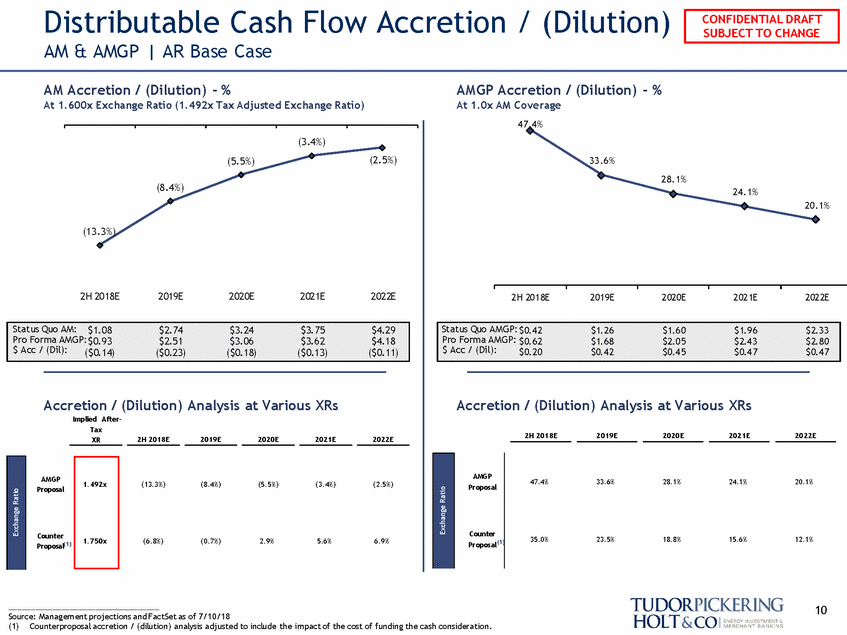
Distributable Cash Flow AM & AMGP | AR Base Case Accretion / (Dilution) AM Accretion / (Dilution) - % At 1.600x Exchange Ratio (1.492x Tax Adjusted Exchange Ratio) AMGP Accretion / (Dilution) - % At 1.0x AM Coverage 47.4% (3.4%) (2.5%) (5.5%) 33.6% 28.1% (8.4%) 24.1% 20.1% (13.3%) 2H 2018E 2019E 2020E 2021E 2022E 2H 2018E 2019E 2020E 2021E 2022E Pro Forma AMGP: $0.62 $1.68 $2.05 $2.43 $2.80 Accretion / (Dilution) Analysis at Various XRs Implied After-Tax Accretion / (Dilution) Analysis at Various XRs 2H 2018E 2019E 2020E 2021E 2022E XR 2H 2018E 2019E 2020E 2021E 2022E AMGP Proposal AMGP Proposal 47.4% 33.6% 28.1% 24.1% 20.1% (13.3%) (8.4%) (5.5%) (3.4%) (2.5%) Counter Counter Proposal(1) 35.0% 23.5% 18.8% 15.6% 12.1% (6.8%) (0.7%) 2.9% 5.6% 6.9% Proposal(1) 10 Source: Management projections and FactSet as of 7/10/18 (1) Counterproposal accretion / (dilution) analysis adjusted to include the impact of the cost of funding the cash consideration. 1.492x 1.750x Exchange Ratio Exchange Ratio Status Quo AMGP: $0.42 $1.26 $1.60 $1.96 $2.33 $ Acc / (Dil): $0.20 $0.42 $0.45 $0.47 $0.47 Status Quo AM: $1.08$2.74$3.24$3.75$4.29 Pro Forma AMGP:$0.93 $2.51$3.06$3.62$4.18 $ Acc / (Dil): ($0.14)($0.23)($0.18)($0.13)($0.11) CONFIDENTIAL DRAFT SUBJECT TO CHANGE
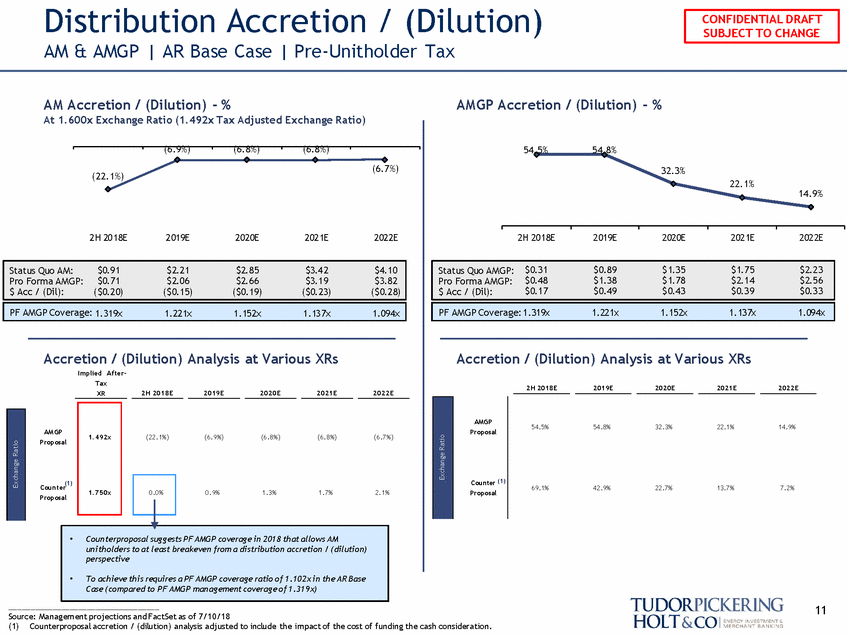
Distribution Accretion / (Dilution) AM & AMGP | AR Base Case | Pre-Unitholder Tax AM Accretion / (Dilution) - % At 1.600x Exchange Ratio (1.492x Tax Adjusted Exchange Ratio) AMGP Accretion / (Dilution) - % (6.9%) (6.8%) (6.8%) 54.5% 54.8% (6.7%) 32.3% (22.1%) 22.1% 14.9% 2H 2018E 2019E 2020E 2021E 2022E 2H 2018E 2019E 2020E 2021E 2022E Pro Forma AMGP: $0.71 $2.06 $2.66 $3.19 $3.82 Accretion / (Dilution) Analysis at Various XRs Implied After-Tax Accretion / (Dilution) Analysis at Various XRs 2H 2018E 2019E 2020E 2021E 2022E 2H 2018E 2019E 2020E 2021E 2022E XR AMGP Proposal 54.5% 54.8% 32.3% 22.1% 14.9% AMGP Proposal (22.1%) (6.9%) (6.8%) (6.8%) (6.7%) Counter (1) Proposal (1) Counter 69.1% 42.9% 22.7% 13.7% 7.2% 0.9% 1.3% 1.7% 2.1% Proposal 11 Source: Management projections and FactSet as of 7/10/18 (1) Counterproposal accretion / (dilution) analysis adjusted to include the impact of the cost of funding the cash consideration. • Counterproposal suggests PF AMGP coverage in 2018 that allows AM unitholders to at least breakeven from a distribution accretion / (dilution) perspective • To achieve this requires a PF AMGP coverage ratio of 1.102x in the AR Base Case (compared to PF AMGP management coverage of 1.319x) 0.0% Exchange Ratio 1.492x 1.750x Exchange Ratio Status Quo AM: $0.91 $2.21 $2.85 $3.42 $4.10 $ Acc / (Dil): ($0.20) ($0.15) ($0.19) ($0.23) ($0.28) PF AMGP Coverage: 1.319x 1.221x 1.152x 1.137x 1.094x Status Quo AMGP: $0.31 $0.89 $1.35 $1.75 $2.23 Pro Forma AMGP: $0.48 $1.38 $1.78 $2.14 $2.56 $ Acc / (Dil): $0.17 $0.49 $0.43 $0.39 $0.33 PF AMGP Coverage: 1.319x 1.221x 1.152x 1.137x 1.094x CONFIDENTIAL DRAFT SUBJECT TO CHANGE
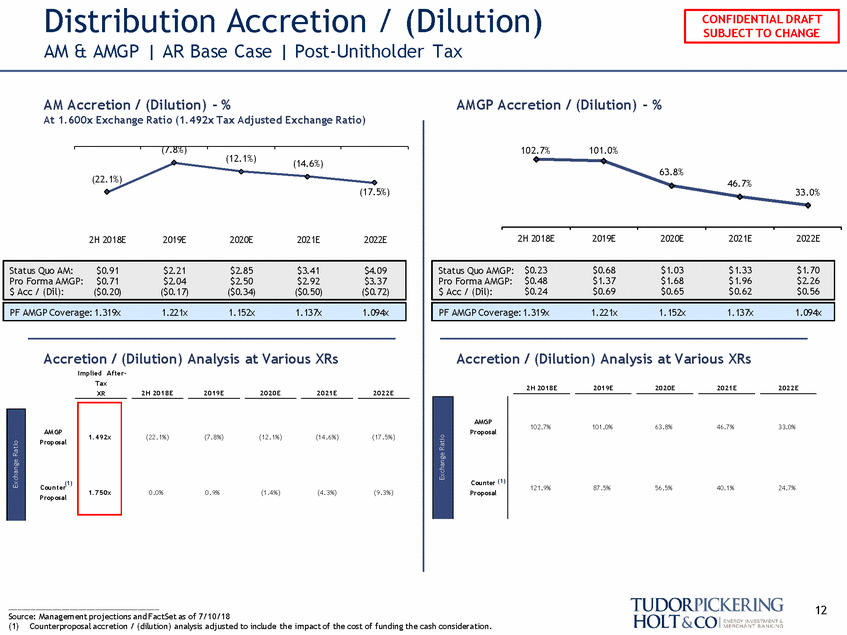
Distribution Accretion / (Dilution) AM & AMGP | AR Base Case | Post-Unitholder Tax AM Accretion / (Dilution) - % At 1.600x Exchange Ratio (1.492x Tax Adjusted Exchange Ratio) AMGP Accretion / (Dilution) - % (7.8%) 102.7% 101.0% (12.1%) (14.6%) 63.8% (22.1%) 46.7% (17.5%) 33.0% 2H 2018E 2019E 2020E 2021E 2022E 2H 2018E 2019E 2020E 2021E 2022E Accretion / (Dilution) Analysis at Various XRs Implied After-Tax Accretion / (Dilution) Analysis at Various XRs 2H 2018E 2019E 2020E 2021E 2022E 2H 2018E 2019E 2020E 2021E 2022E XR AMGP Proposal 102.7% 101.0% 63.8% 46.7% 33.0% AMGP Proposal (22.1%) (7.8%) (12.1%) (14.6%) (17.5%) Counter (1) Proposal (1) Counter 121.9% 87.5% 56.5% 40.1% 24.7% 0.0% 0.9% (1.4%) (4.3%) (9.3%) Proposal 12 Source: Management projections and FactSet as of 7/10/18 (1) Counterproposal accretion / (dilution) analysis adjusted to include the impact of the cost of funding the cash consideration. Exchange Ratio 1.492x 1.750x Exchange Ratio Status Quo AM: $0.91 $2.21 $2.85 $3.41 $4.09 Pro Forma AMGP: $0.71 $2.04 $2.50 $2.92 $3.37 $ Acc / (Dil): ($0.20) ($0.17) ($0.34) ($0.50) ($0.72) PF AMGP Coverage: 1.319x 1.221x 1.152x 1.137x 1.094x Status Quo AMGP: $0.23$0.68$1.03$1.33$1.70 Pro Forma AMGP: $0.48$1.37$1.68$1.96$2.26 $ Acc / (Dil): $0.24$0.69$0.65$0.62$0.56 PF AMGP Coverage: 1.319x1.221x1.152x1.137x1.094x CONFIDENTIAL DRAFT SUBJECT TO CHANGE
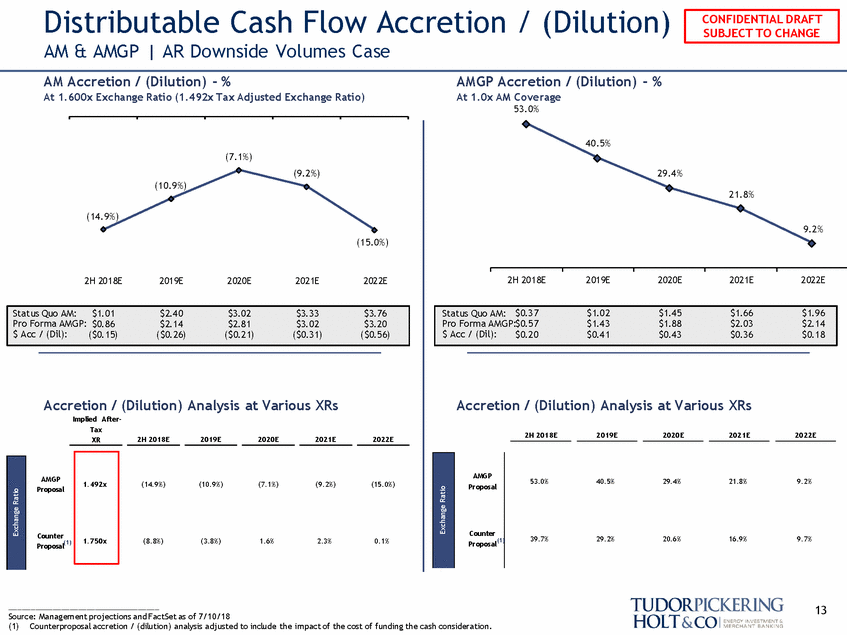
Distributable Cash Flow Accretion / (Dilution) AM & AMGP | AR Downside Volumes Case AM Accretion / (Dilution) - % At 1.600x Exchange Ratio (1.492x Tax Adjusted Exchange Ratio) AMGP Accretion / (Dilution) - % At 1.0x AM Coverage 53.0% 40.5% (7.1%) (9.2%) 29.4% (10.9%) 21.8% (14.9%) 9.2% (15.0%) 2H 2018E 2019E 2020E 2021E 2022E 2H 2018E 2019E 2020E 2021E 2022E Accretion / (Dilution) Analysis at Various XRs Implied After-Tax Accretion / (Dilution) Analysis at Various XRs 2H 2018E 2019E 2020E 2021E 2022E XR 2H 2018E 2019E 2020E 2021E 2022E AMGP Proposal AMGP Proposal 53.0% 40.5% 29.4% 21.8% 9.2% (14.9%) (10.9%) (7.1%) (9.2%) (15.0%) Counter Proposal Counter 39.7% 29.2% 20.6% 16.9% 9.7% (8.8%) (3.8%) 1.6% 2.3% 0.1% (1) (1) Proposal 13 Source: Management projections and FactSet as of 7/10/18 (1) Counterproposal accretion / (dilution) analysis adjusted to include the impact of the cost of funding the cash consideration. Exchange Ratio 1.492x 1.750x Exchange Ratio Status Quo AM: $1.01 $2.40 $3.02 $3.33 $3.76 Pro Forma AMGP: $0.86 $2.14 $2.81 $3.02 $3.20 $ Acc / (Dil): ($0.15) ($0.26) ($0.21) ($0.31) ($0.56) Status Quo AM: $0.37 $1.02 $1.45 $1.66 $1.96 Pro Forma AMGP:$0.57 $1.43 $1.88 $2.03 $2.14 $ Acc / (Dil): $0.20 $0.41 $0.43 $0.36 $0.18 CONFIDENTIAL DRAFT SUBJECT TO CHANGE
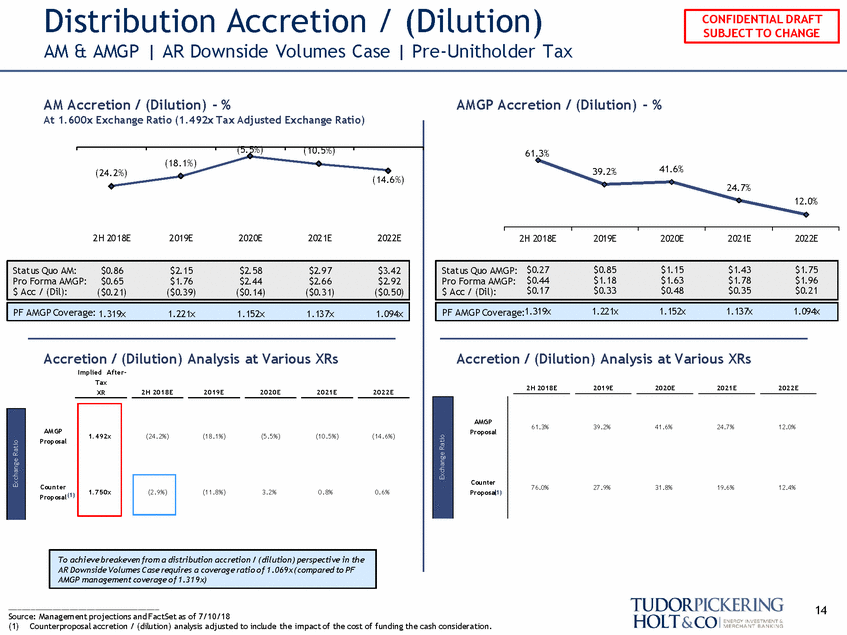
Distribution Accretion / (Dilution) AM & AMGP | AR Downside Volumes Case | Pre-Unitholder Tax AM Accretion / (Dilution) - % At 1.600x Exchange Ratio (1.492x Tax Adjusted Exchange Ratio) AMGP Accretion / (Dilution) - % 61.3% 41.6% 39.2% (14.6%) 24.7% 12.0% 2H 2018E 2019E 2020E 2021E 2022E Pro Forma AMGP: $0.65 $1.76 $2.44 $2.66 $2.92 Accretion / (Dilution) Analysis at Various XRs Accretion / (Dilution) Analysis at Various XRs 2H 2018E 2019E 2020E 2021E 2022E AMGP Proposal 61.3% 39.2% 41.6% 24.7% 12.0% AMGP Proposal Counter Proposa(l1) Counter Proposal(1) 76.0% 27.9% 31.8% 19.6% 12.4% 14 Source: Management projections and FactSet as of 7/10/18 (1) Counterproposal accretion / (dilution) analysis adjusted to include the impact of the cost of funding the cash consideration. To achieve breakeven from a distribution accretion / (dilution) perspective in the AR D AMGP management coverage of 1.319x) Exchange Ratio Exchange Ratio Status Quo AM: $0.86 $2.15 $2.58 $2.97 $3.42 $ Acc / (Dil): PF AMGP Coverage: 1.319x 1.221x 1.152x 1.137x 1.094x Status Quo AMGP: $0.27 $0.85 $1.15 $1.43 $1.75 Pro Forma AMGP: $0.44 $1.18 $1.63 $1.78 $1.96 $ Acc / (Dil): $0.17 $0.33 $0.48 $0.35 $0.21 PF AMGP Coverage:1.319x 1.221x 1.152x 1.137x 1.094x (5.5%) (10.5%) (18.1%) (24.2%) 2H 2018E 2019E 2020E 2021E 2022E ($0.21) ($0.39) ($0.14) ($0.31) ($0.50) Implied After-Tax XR2H 2018E2019E2020E2021E2022E (24.2%)(18.1%)(5.5%)(10.5%)(14.6%) (11.8%)3.2%0.8%0.6% ownside Volumes Case requires a coverage ratio of 1.069x (compared to PF (2.9%) 1.492x 1.750x CONFIDENTIAL DRAFT SUBJECT TO CHANGE
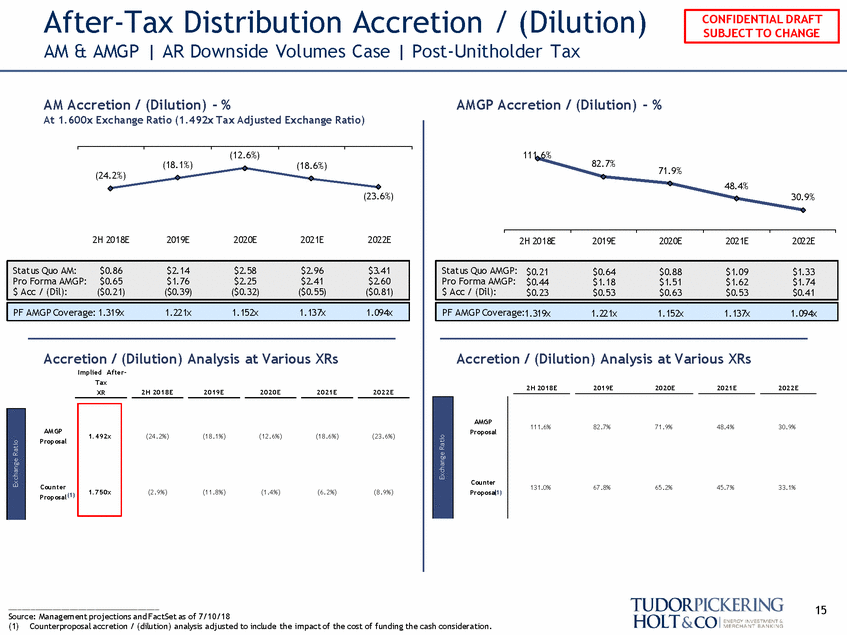
After-Tax Distribution AM & AMGP | AR Downside Volumes Accretion / (Dilution) Case | Post-Unitholder Tax AM Accretion / (Dilution) - % At 1.600x Exchange Ratio (1.492x Tax Adjusted Exchange Ratio) AMGP Accretion / (Dilution) - % (12.6%) 111.6% (18.1%) 82.7% (18.6%) 71.9% (24.2%) 48.4% (23.6%) 30.9% 2H 2018E 2019E 2020E 2021E 2022E 2H 2018E 2019E 2020E 2021E 2022E Pro Forma AMGP: $0.65 $1.76 $2.25 $2.41 $2.60 Accretion / (Dilution) Analysis at Various XRs Implied After-Tax Accretion / (Dilution) Analysis at Various XRs 2H 2018E 2019E 2020E 2021E 2022E XR 2H 2018E 2019E 2020E 2021E 2022E AMGP Proposal 111.6% 82.7% 71.9% 48.4% 30.9% AMGP Proposal (24.2%) (18.1%) (12.6%) (18.6%) (23.6%) Counter Proposa(l1) Counter Proposal(1) 131.0% 67.8% 65.2% 45.7% 33.1% (2.9%) (11.8%) (1.4%) (6.2%) (8.9%) 15 Source: Management projections and FactSet as of 7/10/18 (1) Counterproposal accretion / (dilution) analysis adjusted to include the impact of the cost of funding the cash consideration. Exchange Ratio 1.492x 1.750x Exchange Ratio Status Quo AM: $0.86 $2.14 $2.58 $2.96 $3.41 $ Acc / (Dil): ($0.21) ($0.39) ($0.32) ($0.55) ($0.81) PF AMGP Coverage: 1.319x 1.221x 1.152x 1.137x 1.094x Status Quo AMGP: $0.21 $0.64 $0.88 $1.09 $1.33 Pro Forma AMGP: $0.44 $1.18 $1.51 $1.62 $1.74 $ Acc / (Dil): $0.23 $0.53 $0.63 $0.53 $0.41 PF AMGP Coverage:1.319x 1.221x 1.152x 1.137x 1.094x CONFIDENTIAL DRAFT SUBJECT TO CHANGE
Disclosure Statement Tudor, Pickering, Holt & Co. does not provide accounting, tax or legal advice. In addition, we mutually agree that, subject to applicable law, you (and your employees, representatives and other agents) may disclose any aspects of any potential transaction or structure described herein that are necessary to support any U.S. federal income tax benefits, and all materials of any kind (including tax opinions and other tax analyses) related to those benefits, with no limitations imposed by Tudor, Pickering, Holt & Co. About The Firm Tudor, Pickering, Holt & Co. is an integrated energy investment and merchant bank, providing high quality advice and services to institutional and corporate clients. Through the company’s two broker-dealer units, Tudor, Pickering, Holt & Co. Securities, Inc. (TPHCSI) and Tudor Pickering Holt & Co Advisors LP (TPHCA), members FINRA, the company offers securities and investment banking services to the energy community. TPH Asset Management LP (TPHAM) is an SEC registered investment adviser that delivers a suite of energy investment strategies. TPH Partners Group LP is a relying advisor of TPHAM. Certain employees of TPHAM are also employees of TPHCSI. The information contained herein is confidential (except for information relating to United States tax issues) and may not be reproduced in whole or in part. Tudor, Pickering, Holt & Co. assumes no responsibility for independent verification of third-party information and has relied on such information being complete and accurate in all material respects. To the extent such information includes estimates and forecasts of future financial performance (including estimates of potential cost savings and synergies) prepared by, reviewed or discussed with the managements of your company and/ or other potential transaction participants or obtained from public sources, we have assumed that such estimates and forecasts have been reasonably prepared on bases reflecting the best currently available estimates and judgments of such managements (or, with respect to estimates and forecasts obtained from public sources, represent reasonable estimates). These materials were designed for use by specific persons familiar with the business and the affairs of your company and Tudor, Pickering, Holt & Co. materials. The firm, headquartered in Houston, Texas, has approximately 170 employees and offices in Calgary, Canada; Denver, Colorado; and New York, New York. Its affiliate, Tudor, Pickering Holt & Co. International, LLP, is located in London, England. Its Canadian affiliate, Tudor Pickering Holt & Co Securities – Canada LP, is located in Calgary, Alberta. Contact Us Houston (Research, Sales and Trading): 713-333-2960 Houston (Investment Banking): 713-333-7100 Houston (Asset Management): 713-337-3999 Denver (Sales): 303-300-1900 Denver (Investment Banking): 303-300-1900 New York (Investment Banking): 212-610-1660 New York (Research, Sales): 212-610-1600 London: +011 44(0) 20 3008 6428 Calgary: 403-705-7830 Under no circumstances is this presentation to be used or considered as an offer to sell or a solicitation of any offer to buy, any security. Prior to making any trade, you should discuss with your professional tax, accounting, or regulatory advisers how such particular trade(s) affect you. This brief statement does not disclose all of the risks and other significant aspects of entering into any particular transaction. Tudor, Pickering, Holt & Co. International, LLP is authorized and regulated by the Financial Conduct Authority and is the United Kingdom affiliate of www.TPHco.com Tudor, Pickering, Holt & Co. Copyright 2018 — Tudor, Pickering, Holt & Co. 16 CONFIDENTIAL DRAFT SUBJECT TO CHANGE
