Project Alpine Back Pocket Negotiation Materials August 14-15, 2018 CONFIDENTIAL DRAFT SUBJECT TO CHANGE

Project Alpine Back Pocket Negotiation Materials August 14-15, 2018 CONFIDENTIAL DRAFT SUBJECT TO CHANGE

Table of Contents Exchange Ratio Bid/Ask Spread Analysis I Valuation and Contribution II Pro Forma Impact – Accretion/Dilution III Pre-Tax A Step-Up B After-Tax C Leverage IV Research Perspectives V 2 CONFIDENTIAL DRAFT SUBJECT TO CHANGE
I. Exchange Ratio Bid/Ask Spread Analysis 3 CONFIDENTIAL DRAFT SUBJECT TO CHANGE
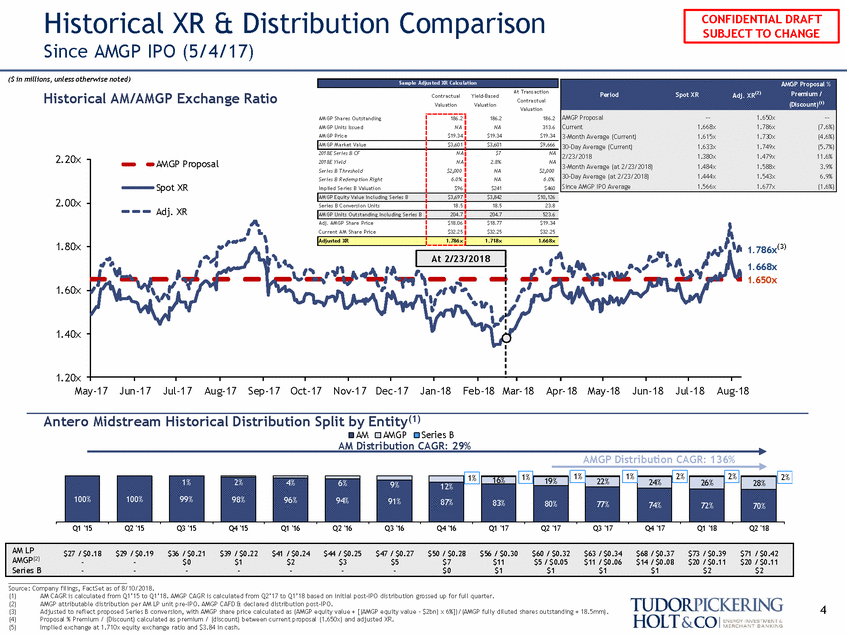
Historical XR & Distribution Since AMGP IPO (5/4/17) Comparison ($ in millions, unless otherwise noted) Premium / Historical AM/AMGP Exchange Ratio Period Spot X R Adj. X R Contrac tual Valuation Valuation 2.20x 2.00x Adj. XR 1.80x 1.786x(3) 1.668x 1.650x 1.60x 1.40x 1.20x May-17 Jun-17 Jul-17Aug-17Sep-17 Oct-17Nov-17 Dec-17 Jan-18 Feb-18 Mar-18Apr-18 May-18 Jun-18 Jul-18 Aug-18 Antero Midstream Historical Distribution Split by Entity(1) AM AMGP Series B AM Distribution CAGR: 29% AMGP Distribution CAGR: 136% 1% 1% 2% 16% 1% 1% 19% 22% 24% Q1 '15 '17 '17 70% 7 / $0.18 $29 / $0.19 $36 / $0.21 $39 / $0.22 $41 / $0.24 $44 / $0.25 $47 / $0.27 $50 / $0.28 $56 / $0.30 $60 / $0.32 $63 / $0.34 $68 / $0.37 Q1-'15 - Q2$'015/ $0.00 - Q3 '15 $1 / $0.Q041'15 - $2Q/1$'106.01 - Q2$'136/ $0.02 Q3 '16 - $5 / $0Q.043'16 - $7Q/1 $'107.04 $0 Q2$'171 / $0.06 Q3 '17 $14 / $0Q.40'817 $18Q1/'1$80.10 $1 Q2$'1282 / $0.13 - - $1 $1 $1 AMGP(2) - - $0 $1 $2 $3 $5 $7 $11 $5 / $0.05 $11 / $0.06 $14 / $0.08 $20 / $0.11 $20 / $0.11 Source: Company filings, FactSet as of 8/10/2018. (1) (2) (3) (4) (5) AM CAGR is calculated from Q1’15 to Q1’18. AMGP CAGR is calculated from Q2’17 to Q1’18 based on initial post-IPO distribution grossed up for full quarter. AMGP attributable distribution per AM LP unit pre-IPO. AMGP CAFD & declared distribution post-IPO. Adjusted to reflect proposed Series B conversion, with AMGP share price calculated as (AMGP equity value + [(AMGP equity value - $2bn) x 6%])/(AMGP fully diluted shares outstanding + 18.5mm). Proposal % Premium / (Discount) calculated as premium / (discount) between current proposal (1.650x) and adjusted XR. Implied exchange at 1.710x equity exchange ratio and $3.84 in cash. 4 AM LP$27 / $0.18 $29 / $0.19 $36 / $0.21 $39 / $0.22 $41 / $0.24 $44 / $0.25 $47 / $0.27 $50 / $0.28 $56 / $0.30 $60 / $0.32 $63 / $0.34 $68 / $0.37 $73 / $0.39 $71 / $0.42 Series B-- - - - - - $0 $1 $1 $1 $1 $2 $2 1% 1% 1% 1% 2% 2% 2% Q2 '15 100% Q3 100% '15 1% 99% Q4 2% '15 98% 4% Q1 '16 96% 6% Q2 94% '16 Q3 16% 19% 22% 24% 26% 28% 12% '16 87% Q2 9% 91% 77% Q4 '16 83% '17 74% Q1 80% Q3 '17 72% Q4 AMGP Proposal Spot XR Series B Conversion Units18.518.523.8 Adj. AM GP Share Pric e$18.06$18.77$19.34 Current AM Share Pric e$32.25$32.25$32.25 At 2/23/2018 Adjusted XR1.786x1.718x1.668x AM GP Units O utstanding Inc luding Series B204.7204.7523.6 Sample Adjusted XR Calculation AMGP Proposal % (2) (Discount)(1) At Transac tion Contrac tual Yield-Based Valuation AM GP Shares O utstanding186.2186.2186.2 AM GP Units IssuedNANA313.6 AM GP Pric e$19.34$19.34$19.34 AMGP Proposal --1.650x --Current 1.668x 1.786x (7.6%) 3-Month Average (Current) 1.615x 1.730x (4.6%) 30-Day Average (Current) 1.633x 1.749x -(5.7%) 2/23/2018 1.380x 1.479x 11.6% 3-Month Average (at 2/23/2018) 1.484x 1.588x 3.9% 30-Day Average (at 2/23/2018) 1.444x 1.543x 6.9% Since AMGP IPO Average 1.566x 1.677x (1.6%) AM GP M arket Value$3,601$3,601$9,666 2018E Series B CFNA$7NA 2018E YieldNA2.8%NA Series B Threshold$2,000 NA$2,000 Series B Redem ption Right6.0%NA6.0% Implied Series B Valuation$96$241$460 AM GP Equity Value Inc luding Series B$3,697$3,842$10,126 CONFIDENTIAL DRAFT SUBJECT TO CHANGE
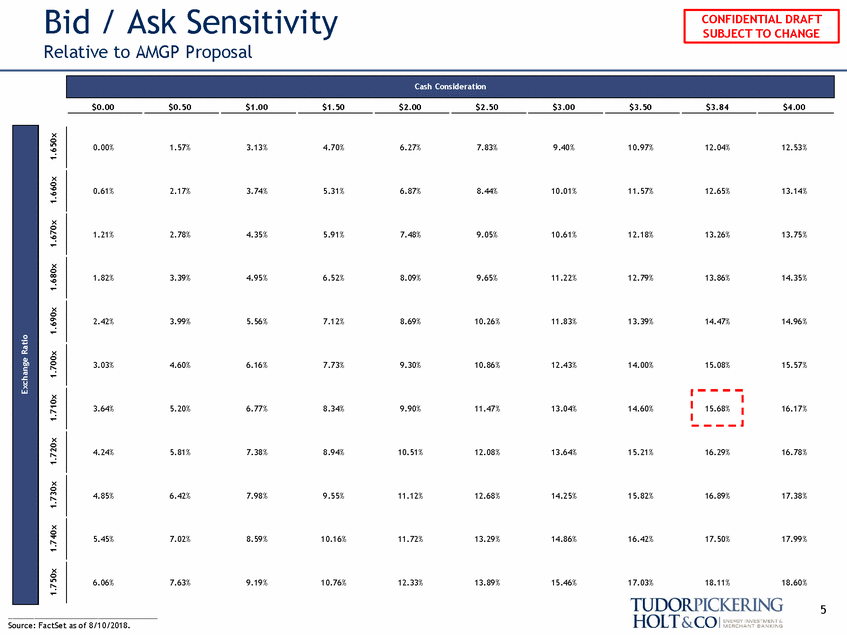
Bid / Ask Sensitivity Relative to AMGP Proposal 0.00% 1.57% 3.13% 4.70% 6.27% 7.83% 9.40% 10.97% 12.04% 12.53% 0.61% 2.17% 3.74% 5.31% 6.87% 8.44% 10.01% 11.57% 12.65% 13.14% 1.21% 2.78% 4.35% 5.91% 7.48% 9.05% 10.61% 12.18% 13.26% 13.75% 1.82% 3.39% 4.95% 6.52% 8.09% 9.65% 11.22% 12.79% 13.86% 14.35% 2.42% 3.99% 5.56% 7.12% 8.69% 10.26% 11.83% 13.39% 14.47% 14.96% 3.03% 4.60% 6.16% 7.73% 9.30% 10.86% 12.43% 14.00% 15.08% 15.57% 3.64% 5.20% 6.77% 8.34% 9.90% 11.47% 13.04% 14.60% 16.17% 4.24% 5.81% 7.38% 8.94% 10.51% 12.08% 13.64% 15.21% 16.29% 16.78% 4.85% 6.42% 7.98% 9.55% 11.12% 12.68% 14.25% 15.82% 16.89% 17.38% 5.45% 7.02% 8.59% 10.16% 11.72% 13.29% 14.86% 16.42% 17.50% 17.99% 6.06% 7.63% 9.19% 10.76% 12.33% 13.89% 15.46% 17.03% 18.11% 18.60% 5 Source: FactSet as of 8/10/2018. 1.750x 1.740x 1.730x 1.720x 1.710x 1.700x 1.690x 1.680x 1.670x 1.660x 1.650x 15.68% Exchange Ratio $0.00 $0.50 $1.00 $1.50 $2.00 $2.50 $3.00 $3.50 $3.84$4.00 Cash Consideration CONFIDENTIAL DRAFT SUBJECT TO CHANGE
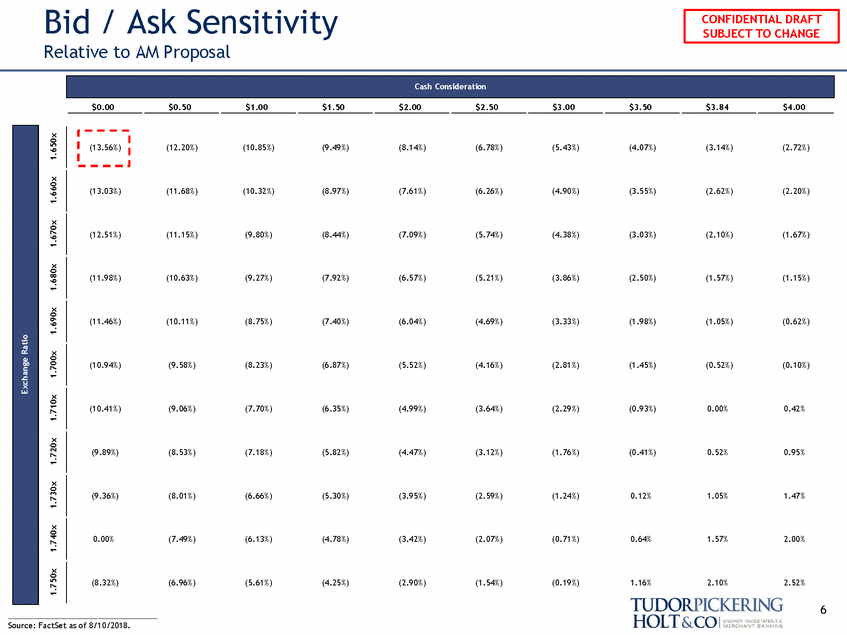
Bid / Ask Sensitivity Relative to AM Proposal (12.20%) (10.85%) (9.49%) (8.14%) (6.78%) (5.43%) (4.07%) (3.14%) (2.72%) (13.03%) (11.68%) (10.32%) (8.97%) (7.61%) (6.26%) (4.90%) (3.55%) (2.62%) (2.20%) (12.51%) (11.15%) (9.80%) (8.44%) (7.09%) (5.74%) (4.38%) (3.03%) (2.10%) (1.67%) (11.98%) (10.63%) (9.27%) (7.92%) (6.57%) (5.21%) (3.86%) (2.50%) (1.57%) (1.15%) (11.46%) (10.11%) (8.75%) (7.40%) (6.04%) (4.69%) (3.33%) (1.98%) (1.05%) (0.62%) (10.94%) (9.58%) (8.23%) (6.87%) (5.52%) (4.16%) (2.81%) (1.45%) (0.52%) (0.10%) (10.41%) (9.06%) (7.70%) (6.35%) (4.99%) (3.64%) (2.29%) (0.93%) 0.00% 0.42% (9.89%) (8.53%) (7.18%) (5.82%) (4.47%) (3.12%) (1.76%) (0.41%) 0.52% 0.95% (9.36%) (8.01%) (6.66%) (5.30%) (3.95%) (2.59%) (1.24%) 0.12% 1.05% 1.47% 0.00% (7.49%) (6.13%) (4.78%) (3.42%) (2.07%) (0.71%) 0.64% 1.57% 2.00% (8.32%) (6.96%) (5.61%) (4.25%) (2.90%) (1.54%) (0.19%) 1.16% 2.10% 2.52% 6 Source: FactSet as of 8/10/2018. 1.750x 1.740x 1.730x 1.720x 1.710x 1.700x 1.690x 1.680x 1.670x 1.660x 1.650x (13.56%) Exchange Ratio $0.00 $0.50 $1.00 $1.50 $2.00 $2.50 $3.00 $3.50 $3.84$4.00 Cash Consideration CONFIDENTIAL DRAFT SUBJECT TO CHANGE
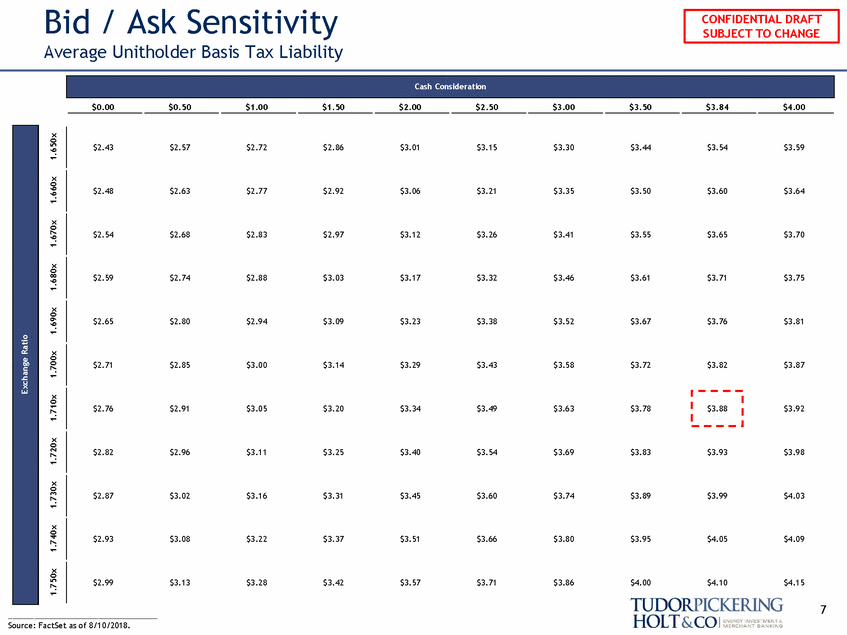
Bid / Ask Sensitivity Average Unitholder Basis Tax Liability $2.43 $2.57 $2.72 $2.86 $3.01 $3.15 $3.30 $3.44 $3.54 $3.59 $2.48 $2.63 $2.77 $2.92 $3.06 $3.21 $3.35 $3.50 $3.60 $3.64 $2.54 $2.68 $2.83 $2.97 $3.12 $3.26 $3.41 $3.55 $3.65 $3.70 $2.59 $2.74 $2.88 $3.03 $3.17 $3.32 $3.46 $3.61 $3.71 $3.75 $2.65 $2.80 $2.94 $3.09 $3.23 $3.38 $3.52 $3.67 $3.76 $3.81 $2.71 $2.85 $3.00 $3.14 $3.29 $3.43 $3.58 $3.72 $3.82 $3.87 $2.76 $2.91 $3.05 $3.20 $3.34 $3.49 $3.63 $3.78 $3.92 $2.82 $2.96 $3.11 $3.25 $3.40 $3.54 $3.69 $3.83 $3.93 $3.98 $2.87 $3.02 $3.16 $3.31 $3.45 $3.60 $3.74 $3.89 $3.99 $4.03 $2.93 $3.08 $3.22 $3.37 $3.51 $3.66 $3.80 $3.95 $4.05 $4.09 $2.99 $3.13 $3.28 $3.42 $3.57 $3.71 $3.86 $4.00 $4.10 $4.15 7 Source: FactSet as of 8/10/2018. 1.750x 1.740x 1.730x 1.720x 1.710x 1.700x 1.690x 1.680x 1.670x 1.660x 1.650x $3.88 Exchange Ratio $0.00 $0.50 $1.00 $1.50 $2.00 $2.50 $3.00 $3.50 $3.84$4.00 Cash Consideration CONFIDENTIAL DRAFT SUBJECT TO CHANGE
II. Valuation and Contribution 8 CONFIDENTIAL DRAFT SUBJECT TO CHANGE
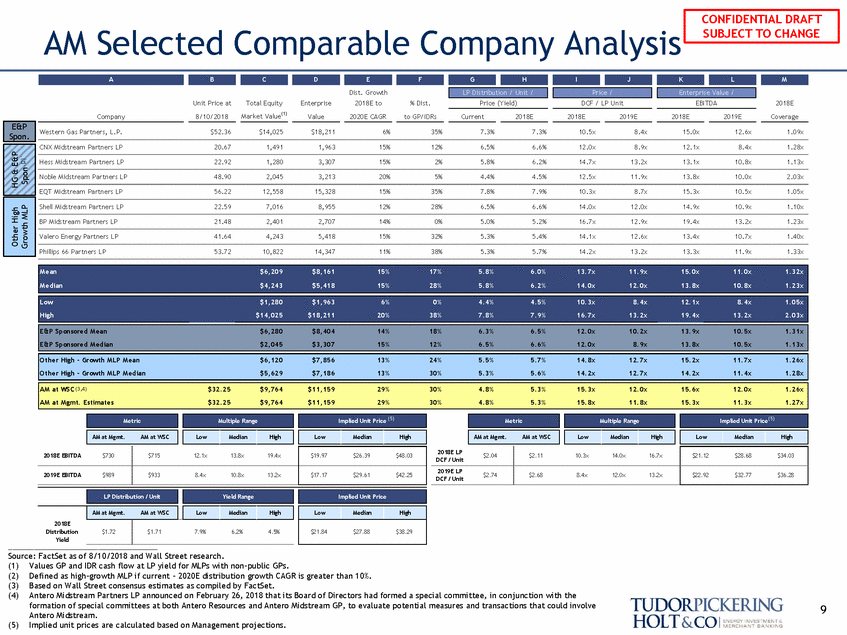
AM Selected Comparable Company Analysis Dist. Growth 2018E to 2020E CAGR Unit Price at 8/10/2018 Total Equity Market Value(1) Enterprise Value % Dist. to GP/IDRs Price (Yield) DCF / LP Unit EBITDA 2018E Coverage Company Current 2018E 2018E 2019E 2018E 2019E DCF / Unit DCF / Unit Source: FactSet as of 8/10/2018 and Wall Street research. (1) (2) (3) (4) Values GP and IDR cash flow at LP yield for MLPs with non-public GPs. Defined as high-growth MLP if current – 2020E distribution growth CAGR is greater than 10%. Based on Wall Street consensus estimates as compiled by FactSet. Antero Midstream Partners LP announced on February 26, 2018 that its Board of Directors had formed a special committee, in conjunction with the formation of special committees at both Antero Resources and Antero Midstream GP, to evaluate potential measures and transactions that could involve Antero Midstream. Implied unit prices are calculated based on Management projections. 9 (5) LP Distribution / Unit Yield Range Implied Unit Price AM at Mgmt.AM at WSC Low Median High Low Median High 2018E Distribution$1.72$1.717.9%6.2%4.5% Yield $21.84$27.88$38.29 Metric Multiple Range Implied Unit Price(5) AM at Mgmt.AM at WSC Low Median High Low Median High 2018E LP$2.04$2.1110.3x14.0x16.7x $21.12$28.68$34.03 2019E LP$2.74$2.688.4x12.0x13.2x $22.92$32.77$36.28 Metric Multiple Range Implied Unit Price (5) AM at Mgmt.AM at WSC Low Median High Low Median High 2018E EBITDA$730$71512.1x13.8x19.4x $19.97$26.39$48.03 2019E EBITDA$989$9338.4x10.8x13.2x $17.17$29.61$42.25 Mean $6,209 $8,161 15% 17% 5.8% 6.0% 13.7x 11.9x 15.0x 11.0x 1.32x Median $4,243 $5,418 15% 28% 5.8% 6.2% 14.0x 12.0x 13.8x 10.8x 1.23x Low $1,280 $1,963 6% 0% 4.4% 4.5% 10.3x 8.4x 12.1x 8.4x 1.05x High $14,025 $18,211 20% 38% 7.8% 7.9% 16.7x 13.2x 19.4x 13.2x 2.03x E&P Sponsored Mean $6,280 $8,404 14% 18% 6.3% 6.5% 12.0x 10.2x 13.9x 10.5x 1.31x E&P Sponsored Median $2,045 $3,307 15% 12% 6.5% 6.6% 12.0x 8.9x 13.8x 10.5x 1.13x Other High - Growth MLP Mean $6,120 $7,856 13% 24% 5.5% 5.7% 14.8x 12.7x 15.2x 11.7x 1.26x Other High - Growth MLP Median $5,629 $7,186 13% 30% 5.3% 5.6% 14.2x 12.7x 14.2x 11.4x 1.28x AM at WSC (3,4)$32.25 $9,764 $11,159 29% 30% 4.8% 5.3% 15.3x 12.0x 15.6x 12.0x 1.26x AM at Mgmt. Estimates $32.25 $9,764 $11,159 29% 30% 4.8% 5.3% 15.8x 11.8x 15.3x 11.3x 1.27x E&P Spon. Western Gas Partners, L.P. $52.36 $14,025 $18,211 6% 35% 7.3% 7.3% 10.5x 8.4x 15.0x 12.6x 1.09x CNX Midstream Partners LP 20.67 1,491 1,963 15% 12% 6.5% 6.6% 12.0x 8.9x 12.1x 8.4x 1.28x HG & E&P Spon.(2)` Hess Midstream Partners LP 22.92 1,280 3,307 15% 2% 5.8% 6.2% 14.7x 13.2x 13.1x 10.8x 1.13x Noble Midstream Partners LP 48.90 2,045 3,213 20% 5% 4.4% 4.5% 12.5x 11.9x 13.8x 10.0x 2.03x EQT Midstream Partners LP 56.22 12,558 15,328 15% 35% 7.8% 7.9% 10.3x 8.7x 15.3x 10.5x 1.05x Other High Growth MLP Shell Midstream Partners LP 22.59 7,016 8,955 12% 28% 6.5% 6.6% 14.0x 12.0x 14.9x 10.9x 1.10x BP Midstream Partners LP 21.48 2,401 2,707 14% 0% 5.0% 5.2% 16.7x 12.9x 19.4x 13.2x 1.23x Valero Energy Partners LP 41.64 4,243 5,418 15% 32% 5.3% 5.4% 14.1x 12.6x 13.4x 10.7x 1.40x Phillips 66 Partners LP 53.72 10,822 14,347 11% 38% 5.3% 5.7% 14.2x 13.2x 13.3x 11.9x 1.33x M K L Enterprise Value / I J Price / G H LP Distribution / Unit / F E D C B A CONFIDENTIAL DRAFT SUBJECT TO CHANGE
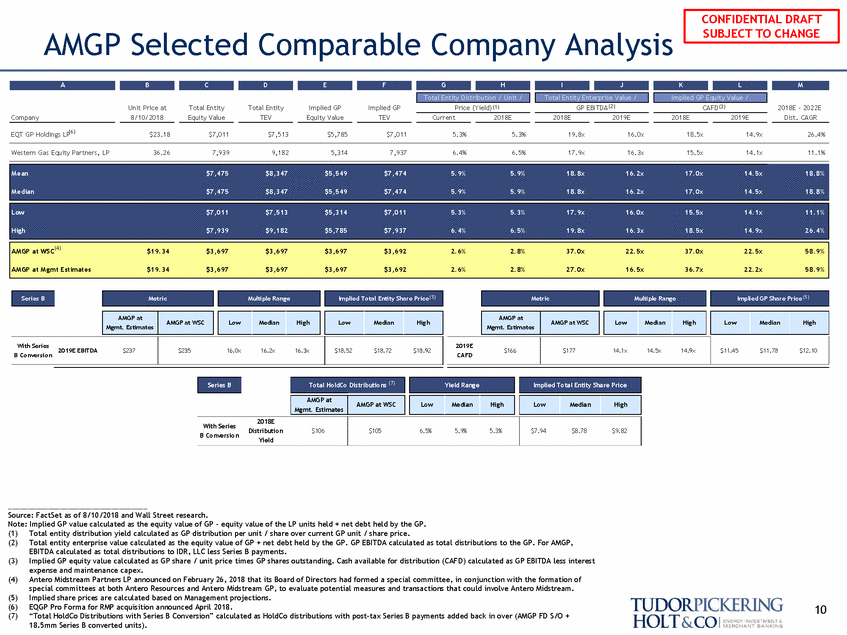
AMGP Selected Comparable Company Analysis GP EBITDA (2) CAFD (3) Unit Price at 8/10/2018 Total Entity Equity Value Total Entity TEV Implied GP Equity Value Implied GP TEV Price (Yield) (1) 2018E - 2022E Dist. CAGR Company Current 2018E 2018E 2019E 2018E 2019E EQT GP Holdings LP(6) $23.18 $7,011 $7,513 $5,785 $7,011 5.3% 5.3% 19.8x 16.0x 18.5x 14.9x 26.4% Western Gas Equity Partners, LP 36.26 7,939 9,182 5,314 7,937 6.4% 6.5% 17.9x 16.3x 15.5x 14.1x 11.1% CAFD With Series B Conversion Source: FactSet as of 8/10/2018 and Wall Street research. Note: Implied GP value calculated as the equity value of GP - equity value of the LP units held + net debt held by the GP. (1) (2) Total entity distribution yield calculated as GP distribution per unit / share over current GP unit / share price. Total entity enterprise value calculated as the equity value of GP + net debt held by the GP. GP EBITDA calculated as total distributions to the GP. For AMGP, EBITDA calculated as total distributions to IDR, LLC less Series B payments. Implied GP equity value calculated as GP share / unit price times GP shares outstanding. Cash available for distribution (CAFD) calculated as GP EBITDA less interest expense and maintenance capex. Antero Midstream Partners LP announced on February 26, 2018 that its Board of Directors had formed a special committee, in conjunction with the formation of special committees at both Antero Resources and Antero Midstream GP, to evaluate potential measures and transactions that could involve Antero Midstream. Implied share prices are calculated based on Management projections. EQGP Pro Forma for RMP acquisition announced April 2018. “Total HoldCo Distributions with Series B Conversion” calculated as HoldCo distributions with post-tax Series B payments added back in over (AMGP FD S/O + 18.5mm Series B converted units). (3) (4) (5) (6) (7) 10 Total HoldCo Distributions (7) Yield Range Implied Total Entity Share Price AMGP at Mgmt. Estimates AMGP at WSC Low Median High Low Median High 2018E Distribution $106 $105 6.5% 5.9% 5.3% Yield $7.94 $8.78 $9.82 Series B AMGP at Mgmt. Estimates AMGP at WSC Low Median High Low Median High 2019E $166 $177 14.1x 14.5x 14.9x $11.45 $11.78 $12.10 AMGP at Mgmt. Estimates AMGP at WSC Low Median High Low Median High With Series 2019E EBITDA $237 $235 16.0x 16.2x 16.3x B Conversion $18.52 $18.72 $18.92 Implied GP Share Price (5) Multiple Range Metric Implied Total Entity Share Price(5) Multiple Range Metric Series B Mean $7,475 $8,347 $5,549 $7,474 5.9% 5.9% 18.8x 16.2x 17.0x 14.5x 18.8% Median $7,475 $8,347 $5,549 $7,474 5.9% 5.9% 18.8x 16.2x 17.0x 14.5x 18.8% Low $7,011 $7,513 $5,314 $7,011 5.3% 5.3% 17.9x 16.0x 15.5x 14.1x 11.1% High $7,939 $9,182 $5,785 $7,937 6.4% 6.5% 19.8x 16.3x 18.5x 14.9x 26.4% AMGP at WSC(4) $19.34 $3,697 $3,697 $3,697 $3,692 2.6% 2.8% 37.0x 22.5x 37.0x 22.5x 58.9% AMGP at Mgmt Estimates $19.34 $3,697 $3,697 $3,697 $3,692 2.6% 2.8% 27.0x 16.5x 36.7x 22.2x 58.9% M K L Implied GP Equity Value / I J Total Entity Enterprise Value / G H Total Entity Distribution / Unit / F E D C B A CONFIDENTIAL DRAFT SUBJECT TO CHANGE
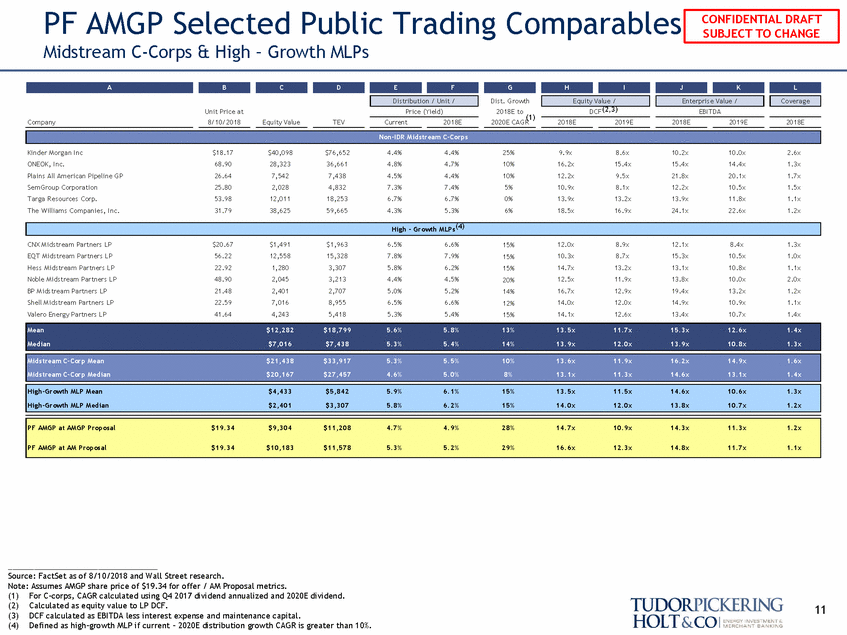
PF AMGP Selected Public Trading Comparables Midstream C-Corps & High – Growth MLPs Dist. Growth DCF (2,3) Unit Price at 8/10/2018 Price (Yield) 2018E to EBITDA (1) Company Equity Value TEV Current 2018E 2020E CAGR 2018E 2019E 2018E 2019E 2018E Kinder Morgan Inc ONEOK, Inc. Plains All American Pipeline GP SemGroup Corporation Targa Resources Corp. The Williams Companies, Inc. $18.17 68.90 26.64 25.80 53.98 31.79 $40,098 28,323 7,542 2,028 12,011 38,625 $76,652 36,661 7,438 4,832 18,253 59,665 4.4% 4.8% 4.5% 7.3% 6.7% 4.3% 4.4% 4.7% 4.4% 7.4% 6.7% 5.3% 25% 10% 10% 5% 0% 6% 9.9x 16.2x 12.2x 10.9x 13.9x 18.5x 8.6x 15.4x 9.5x 8.1x 13.2x 16.9x 10.2x 15.4x 21.8x 12.2x 13.9x 24.1x 10.0x 14.4x 20.1x 10.5x 11.8x 22.6x 2.6x 1.3x 1.7x 1.5x 1.1x 1.2x CNX Midstream Partners LP EQT Midstream Partners LP Hess Midstream Partners LP Noble Midstream Partners LP BP Midstream Partners LP Shell Midstream Partners LP Valero Energy Partners LP $20.67 56.22 22.92 48.90 21.48 22.59 41.64 $1,491 12,558 1,280 2,045 2,401 7,016 4,243 $1,963 15,328 3,307 3,213 2,707 8,955 5,418 6.5% 7.8% 5.8% 4.4% 5.0% 6.5% 5.3% 6.6% 7.9% 6.2% 4.5% 5.2% 6.6% 5.4% 12.0x 10.3x 14.7x 12.5x 16.7x 14.0x 14.1x 8.9x 8.7x 13.2x 11.9x 12.9x 12.0x 12.6x 12.1x 15.3x 13.1x 13.8x 19.4x 14.9x 13.4x 8.4x 10.5x 10.8x 10.0x 13.2x 10.9x 10.7x 1.3x 1.0x 1.1x 2.0x 1.2x 1.1x 1.4x 15% 15% 15% 20% 14% 12% 15% Source: FactSet as of 8/10/2018 and Wall Street research. Note: Assumes AMGP share price of $19.34 for offer / AM Proposal metrics. (1) (2) (3) (4) For C-corps, CAGR calculated using Q4 2017 dividend annualized and 2020E dividend. Calculated as equity value to LP DCF. DCF calculated as EBITDA less interest expense and maintenance capital. Defined as high-growth MLP if current – 2020E distribution growth CAGR is greater than 10%. 11 PF AMGP at AMGP Proposal $19.34 $9,304 $11,208 4.7% 4.9% 28% 14.7x 10.9x 14.3x 11.3x 1.2x PF AMGP at AM Proposal $19.34 $10,183 $11,578 5.3% 5.2% 29% 16.6x 12.3x 14.8x 11.7x 1.1x Mean $12,282 $18,799 5.6% 5.8% 13% 13.5x 11.7x 15.3x 12.6x 1.4x Median $7,016 $7,438 5.3% 5.4% 14% 13.9x 12.0x 13.9x 10.8x 1.3x Midstream C-Corp Mean $21,438 $33,917 5.3% 5.5% 10% 13.6x 11.9x 16.2x 14.9x 1.6x Midstream C-Corp Median $20,167 $27,457 4.6% 5.0% 8% 13.1x 11.3x 14.6x 13.1x 1.4x High-Growth MLP Mean $4,433 $5,842 5.9% 6.1% 15% 13.5x 11.5x 14.6x 10.6x 1.3x High-Growth MLP Median $2,401 $3,307 5.8% 6.2% 15% 14.0x 12.0x 13.8x 10.7x 1.2x High - Growth MLPs(4) Non-IDR Midstream C-Corps L Coverage J K Enterprise Value / H I Equity Value / G E F Distribution / Unit / D C B A CONFIDENTIAL DRAFT SUBJECT TO CHANGE
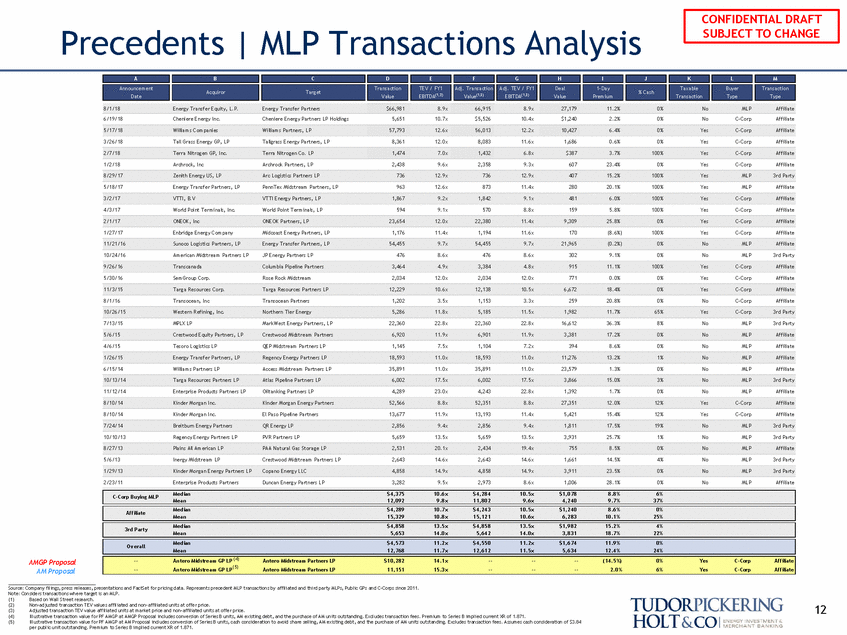
Precedents | MLP Transactions Analysis 6/19/18 Cheniere Energy Inc. Cheniere Energy Partners LP Holdings 5,651 10.7x $5,526 10.4x $1,240 2.2% 0% No C-Corp Affiliate 3/26/18 Tall Grass Energy GP, LP Tallgrass Energy Partners, LP 8,361 12.0x 8,083 11.6x 1,686 0.6% 0% Yes C-Corp Affiliate 1/2/18 Archrock, Inc Archrock Partners, LP 2,438 9.6x 2,358 9.3x 607 23.4% 0% Yes C-Corp Affiliate 5/18/17 Energy Transfer Partners, LP PennTex Midstream Partners, LP 963 12.6x 873 11.4x 280 20.1% 100% Yes MLP Affiliate 4/3/17 World Point Terminals, Inc. World Point Terminals, LP 594 9.1x 570 8.8x 159 5.8% 100% Yes C-Corp Affiliate 1/27/17 Enbridge Energy Company Midcoast Energy Partners, LP 1,176 11.4x 1,194 11.6x 170 (8.6%) 100% Yes C-Corp Affiliate 10/24/16 American Midstream Partners LP JP Energy Partners LP 476 8.6x 476 8.6x 302 9.1% 0% No MLP 3rd Party 5/30/16 SemGroup Corp. Rose Rock Midstream 2,034 12.0x 2,034 12.0x 771 0.0% 0% Yes C-Corp Affiliate 8/1/16 Transocean, Inc Transocean Partners 1,202 3.5x 1,153 3.3x 259 20.8% 0% No C-Corp Affiliate 7/13/15 MPLX LP MarkWest Energy Partners, LP 22,360 22.8x 22,360 22.8x 16,612 36.3% 8% No MLP 3rd Party 4/6/15 Tesoro Logistics LP QEP Midstream Partners LP 1,145 7.5x 1,104 7.2x 394 8.6% 0% No MLP Affiliate 6/15/14 Williams Partners LP Access Midstream Partners LP 35,891 11.0x 35,891 11.0x 23,579 1.3% 0% No MLP Affiliate 11/12/14 Enterprise Products Partners LP Oiltanking Partners LP 4,289 23.0x 4,243 22.8x 1,392 1.7% 0% No MLP Affiliate 8/10/14 Kinder Morgan Inc. El Paso Pipeline Partners 13,677 11.9x 13,193 11.4x 5,421 15.4% 12% Yes C-Corp Affiliate 10/10/13 Regency Energy Partners LP PVR Partners LP 5,659 13.5x 5,659 13.5x 3,931 25.7% 1% No MLP 3rd Party 5/6/13 Inergy Midstream LP Crestwood Midstream Partners LP 2,643 14.6x 2,643 14.6x 1,661 14.5% 4% No MLP 3rd Party 2/23/11 Enterprise Products Partners Duncan Energy Partners LP 3,282 9.5x 2,973 8.6x 1,006 28.1% 0% No MLP Affiliate Mean 12,092 9.8x 11,802 9.6x 4,240 9.7% 37% Mean 15,329 10.8x 15,121 10.6x 6,283 10.1% 25% Mean 5,653 14.0x 5,642 14.0x 3,831 18.7% 22% Mean 12,768 11.7x 12,612 11.5x 5,634 12.4% 24% AMGP Proposal AM Proposal Source: Company filings, press releases, presentations and FactSet for pricing data. Represents precedent MLP transactions by affiliated and third party MLPs, Public GPs and C-Corps since 2011. Note: Considers transactions where target is an MLP. (1) (2) (3) (4) (5) Based on Wall Street research. Non-adjusted transaction TEV values affiliated and non-affiliated units at offer price. Adjusted transaction TEV value affiliated units at market price and non-affiliated units at offer price. Illustrative transaction value for PF AMGP at AMGP Proposal includes conversion of Series B units, AM existing debt, and the purchase of AM units outstanding. Excludes transaction fees. Premium to Series B implied current XR of 1.871. Illustrative transaction value for PF AMGP at AM Proposal includes conversion of Series B units, cash consideration to avoid share selling, AM existing debt, and the purchase of AM units outstanding. Excludes transaction fees. Assumes cash consideration of $3.84 per public unit outstanding. Premium to Series B implied current XR of 1.871. 12 C-Corp Buying MLP Median $4,375 10.6x $4,284 10.5x $1,078 8.8% 6% Affiliate Median $4,289 10.7x $4,243 10.5x $1,240 8.6% 0% 3rd Party Median $4,858 13.5x $4,858 13.5x $1,982 15.2% 4% Ov erall Median $4,573 11.2x $4,550 11.2x $1,674 11.9% 0% --Antero Midstream GP LP (4)Antero Midstream Partners LP $10,282 14.1x ---- --(14.5%) 0% Yes C-Corp Affiliate --Antero Midstream GP LP(5) Antero Midstream Partners LP 11,151 15.3x ---- --2.0% 6% Yes C-Corp Affiliate 1/29/13 Kinder Morgan Energy Partners LP Copano Energy LLC 4,858 14.9x 4,858 14.9x 3,911 23.5% 0% No MLP 3rd Party 8/27/13 Plains All American LP PAA Natural Gas Storage LP 2,531 20.1x 2,434 19.4x 755 8.5% 0% No MLP Affiliate 7/24/14 Breitburn Energy Partners QR Energy LP 2,856 9.4x 2,856 9.4x 1,811 17.5% 19% No MLP 3rd Party 8/10/14 Kinder Morgan Inc. Kinder Morgan Energy Partners 52,566 8.8x 52,351 8.8x 27,351 12.0% 12% Yes C-Corp Affiliate 10/13/14 Targa Resources Partners LP Atlas Pipeline Partners LP 6,002 17.5x 6,002 17.5x 3,866 15.0% 3% No MLP 3rd Party 1/26/15 Energy Transfer Partners, LP Regency Energy Partners LP 18,593 11.0x 18,593 11.0x 11,276 13.2% 1% No MLP Affiliate 5/6/15 Crestwood Equity Partners, LP Crestwood Midstream Partners 6,920 11.9x 6,901 11.9x 3,381 17.2% 0% No MLP Affiliate 10/26/15 Western Refining, Inc. Northern Tier Energy 5,286 11.8x 5,185 11.5x 1,982 11.7% 65% Yes C-Corp 3rd Party 11/3/15 Targa Resources Corp. Targa Resources Partners LP 12,229 10.6x 12,138 10.5x 6,672 18.4% 0% Yes C-Corp Affiliate 9/26/16 TranscanadaColumbia Pipeline Partners 3,464 4.9x 3,384 4.8x 915 11.1% 100% Yes C-Corp Affiliate 11/21/16 Sunoco Logistics Partners, LP Energy Transfer Partners, LP 54,455 9.7x 54,455 9.7x 21,965 (0.2%) 0% No MLP Affiliate 2/1/17 ONEOK, Inc ONEOK Partners, LP 23,654 12.0x 22,380 11.4x 9,309 25.8% 0% Yes C-Corp Affiliate 3/2/17 VTTI, B.V VTTI Energy Partners, LP 1,867 9.2x 1,842 9.1x 481 6.0% 100% Yes C-Corp Affiliate 8/29/17 Zenith Energy US, LP Arc Logistics Partners LP 736 12.9x 736 12.9x 407 15.2% 100% Yes MLP 3rd Party 2/7/18 Terra Nitrogen GP, Inc. Terra Nitrogen Co. LP 1,474 7.0x 1,432 6.8x $387 3.7% 100% Yes C-Corp Affiliate 5/17/18 Williams CompaniesWilliams Partners, LP 57,793 12.6x 56,013 12.2x 10,427 6.4% 0% Yes C-Corp Affiliate A B C D E F G H I J K L M Announcement Date Acquiror Target Transaction Value TEV / FY1 EBITDA(1,2) Adj. Transaction Value(1,3) Adj. TEV / FY1 EBITDA(1,3) Deal Value 1-Day Premium % Cash Taxable Transaction Buyer Type Transaction Type 8/1/18 Energy Transfer Equity, L.P. Energy Transfer Partners $66,981 8.9x 66,915 8.9x 27,179 11.2% 0% No MLP Affiliate CONFIDENTIAL DRAFT SUBJECT TO CHANGE
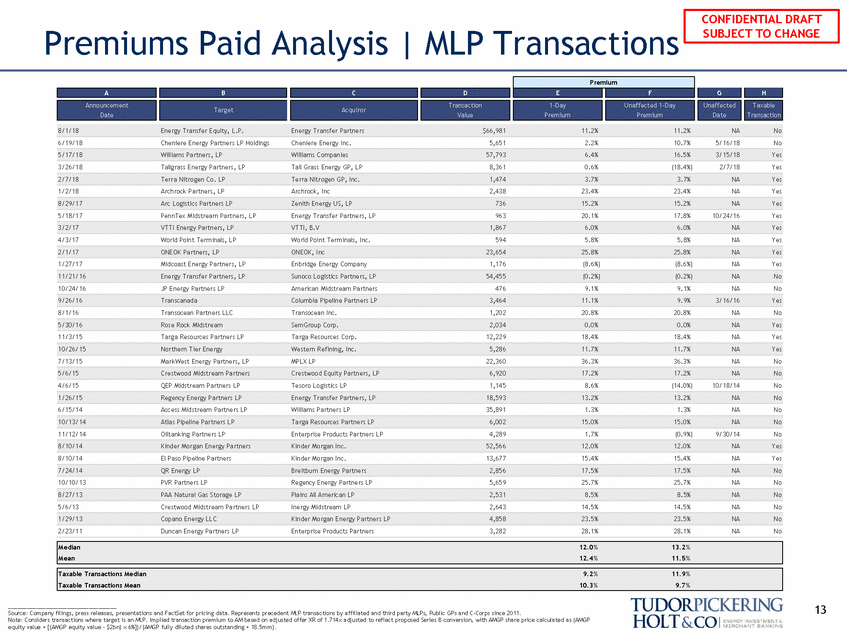
Premiums Paid Analysis | MLP Transactions 6/19/18 Cheniere Energy Partners LP Holdings Cheniere Energy Inc. 5,651 2.2% 10.7% 5/16/18 No 3/26/18 Tallgrass Energy Partners, LP Tall Grass Energy GP, LP 8,361 0.6% (18.4%) 2/7/18 Yes 1/2/18 Archrock Partners, LP Archrock, Inc 2,438 23.4% 23.4% NA Yes 5/18/17 PennTex Midstream Partners, LP Energy Transfer Partners, LP 963 20.1% 17.8% 10/24/16 Yes 4/3/17 World Point Terminals, LP World Point Terminals, Inc. 594 5.8% 5.8% NA Yes 1/27/17 Midcoast Energy Partners, LP Enbridge Energy Company 1,176 (8.6%) (8.6%) NA Yes 10/24/16 JP Energy Partners LP American Midstream Partners 476 9.1% 9.1% NA No 8/1/16 Transocean Partners LLC Transocean Inc. 1,202 20.8% 20.8% NA No 11/3/15 Targa Resources Partners LP Targa Resources Corp. 12,229 18.4% 18.4% NA Yes 7/13/15 MarkWest Energy Partners, LP MPLX LP 22,360 36.3% 36.3% NA No 4/6/15 QEP Midstream Partners LP Tesoro Logistics LP 1,145 8.6% (14.0%) 10/18/14 No 6/15/14 Access Midstream Partners LP Williams Partners LP 35,891 1.3% 1.3% NA No 11/12/14 Oiltanking Partners LP Enterprise Products Partners LP 4,289 1.7% (0.9%) 9/30/14 No 8/10/14 El Paso Pipeline Partners Kinder Morgan Inc. 13,677 15.4% 15.4% NA Yes 10/10/13 PVR Partners LP Regency Energy Partners LP 5,659 25.7% 25.7% NA No 5/6/13 Crestwood Midstream Partners LP Inergy Midstream LP 2,643 14.5% 14.5% NA No 2/23/11 Duncan Energy Partners LP Enterprise Products Partners 3,282 28.1% 28.1% NA No 13 Source: Company filings, press releases, presentations and FactSet for pricing data. Represents precedent MLP transactions by affiliated and third party MLPs, Public GPs and C-Corps since 2011. Note: Considers transactions where target is an MLP. Implied transaction premium to AM based on adjusted offer XR of 1.714x adjusted to reflect proposed Series B conversion, with AMGP share price calculated as (AMGP equity value + [(AMGP equity value - $2bn) x 6%])/(AMGP fully diluted shares outstanding + 18.5mm). Median12.0%13.2% Mean12.4%11.5% Taxable Transactions Median9.2%11.9% Taxable Transactions Mean10.3%9.7% 1/29/13Copano Energy LLCKinder Morgan Energy Partners LP4,85823.5%23.5%NANo 8/27/13PAA Natural Gas Storage LPPlains All American LP2,5318.5%8.5%NANo 7/24/14QR Energy LPBreitburn Energy Partners2,85617.5%17.5%NANo 8/10/14Kinder Morgan Energy PartnersKinder Morgan Inc.52,56612.0%12.0%NAYes 10/13/14Atlas Pipeline Partners LPTarga Resources Partners LP6,00215.0%15.0%NANo 1/26/15Regency Energy Partners LPEnergy Transfer Partners, LP18,59313.2%13.2%NANo 5/6/15Crestwood Midstream PartnersCrestwood Equity Partners, LP6,92017.2%17.2%NANo 10/26/15Northern Tier EnergyWestern Refining, Inc.5,28611.7%11.7%NAYes 5/30/16Rose Rock MidstreamSemGroup Corp.2,0340.0%0.0%NAYes 9/26/16TranscanadaColumbia Pipeline Partners LP3,46411.1%9.9%3/16/16Yes 11/21/16Energy Transfer Partners, LPSunoco Logistics Partners, LP54,455(0.2%)(0.2%)NANo 2/1/17ONEOK Partners, LPONEOK, Inc23,65425.8%25.8%NAYes 3/2/17VTTI Energy Partners, LPVTTI, B.V1,8676.0%6.0%NAYes 8/29/17Arc Logistics Partners LPZenith Energy US, LP73615.2%15.2%NAYes 2/7/18Terra Nitrogen Co. LPTerra Nitrogen GP, Inc.1,4743.7%3.7%NAYes 5/17/18Williams Partners, LPWilliams Companies57,7936.4%16.5%3/15/18Yes 8/1/18Energy Transfer Equity, L.P.Energy Transfer Partners$66,98111.2%11.2%NANo Premium A B C D E F G H Announcement Date Target Acquiror Transaction Value 1-Day Premium Unaffected 1-Day Premium Unaffected Date Taxable Transaction CONFIDENTIAL DRAFT SUBJECT TO CHANGE
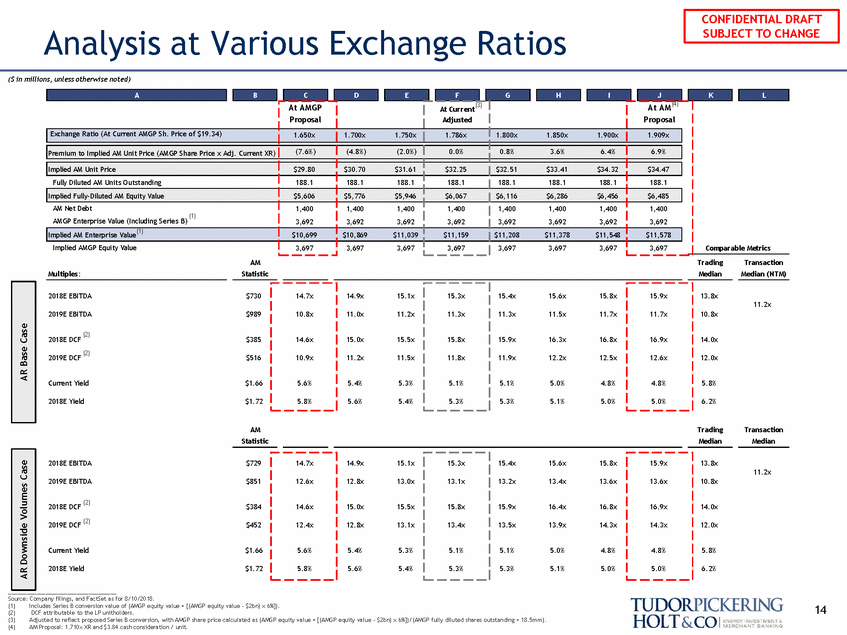
Analysis at Various Exchange Ratios ($ in millions, unless otherwise noted) At AM AM Statistic Trading Median Transaction Median (NTM) Multiples: 2018E EBITDA $730 14.9x 15.1x 15.4x 15.6x 15.8x 13.8x 11.2x 2019E EBITDA $989 11.0x 11.2x 11.3x 11.5x 11.7x 10.8x (2) 2018E DCF $385 15.0x 15.5x 15.9x 16.3x 16.8x 14.0x (2) 2019E DCF $516 11.2x 11.5x 11.9x 12.2x 12.5x 12.0x Current Yield $1.66 5.4% 5.3% 5.1% 5.0% 4.8% 5.8% 2018E Yield $1.72 5.6% 5.4% 5.3% 5.1% 5.0% 6.2% AM Statistic Trading Median Transaction Median 2018E EBITDA $729 14.9x 15.1x 15.4x 15.6x 15.8x 13.8x 11.2x 2019E EBITDA $851 12.8x 13.0x 13.2x 13.4x 13.6x 10.8x 2018E DCF (2) 2019E DCF (2) $384 15.0x 15.5x 15.9x 16.4x 16.8x 14.0x $452 12.8x 13.1x 13.5x 13.9x 14.3x 12.0x Current Yield $1.66 5.4% 5.3% 5.1% 5.0% 4.8% 5.8% 2018E Yield $1.72 5.6% 5.4% 5.3% 5.1% 5.0% 6.2% Source: Company filings, and FactSet as for 8/10/2018. (1) (2) (3) (4) Includes Series B conversion value of (AMGP equity value + [(AMGP equity value - $2bn) x 6%]). DCF attributable to the LP unitholders. Adjusted to reflect proposed Series B conversion, with AMGP share price calculated as (AMGP equity value + [(AMGP equity value - $2bn) x 6%])/(AMGP fully diluted shares outstanding + 18.5mm). AM Proposal: 1.710x XR and $3.84 cash consideration / unit. 14 15.9x 13.6x 16.9x 14.3x 4.8% 5.0% 14.7x 12.6x 14.6x 12.4x 5.6% 5.8% 15.3x 13.1x 15.8x 13.4x 5.1% 5.3% AR Downside Volumes Case AR Base Case 15.9x 11.7x 16.9x 12.6x 4.8% 5.0% 14.7x 10.8x 14.6x 10.9x 5.6% 5.8% 15.3x 11.3x 15.8x 11.8x 5.1% 5.3% B C D E F G I J K L At AMGP Proposal (3) At Current Adjusted (4) Proposal Comparable Metrics Exchange Ratio (At Current AMGP Sh. Price of $19.34) 1.650x 1.700x1.750x 1.786x 1.800x1.850x1.900x 1.909x Premium to Implied AM Unit Price (AMGP Share Price x Adj. Current XR) (7.6%) (4.8%)(2.0%) 0.0% 0.8%3.6%6.4% 6.9% Implied AM Unit Price $29.80 $30.70$31.61 $32.25 $32.51$33.41$34.32 $34.47 Fully Diluted AM Units Outstanding 188.1 188.1188.1 188.1 188.1188.1188.1 188.1 Implied Fully-Diluted AM Equity Value $5,606 $5,776$5,946 $6,067 $6,116$6,286$6,456 $6,485 AM Net Debt (1) AMGP Enterprise Value (Including Series B) 1,400 3,692 1,4001,400 3,6923,692 1,400 3,692 1,4001,4001,400 3,6923,6923,692 1,400 3,692 (1) Implied AM Enterprise Value $10,699 $10,869$11,039 $11,159 $11,208$11,378$11,548 $11,578 Implied AMGP Equity Value 3,697 3,6973,697 3,697 3,6973,6973,697 3,697 H A CONFIDENTIAL DRAFT SUBJECT TO CHANGE
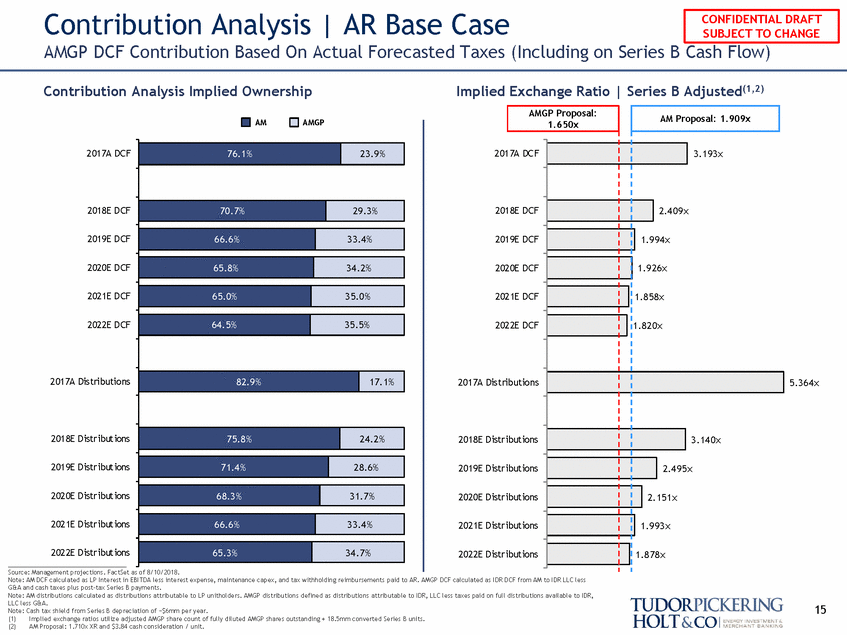
Contribution Analysis | AR Base Case AMGP DCF Contribution Based On Actual Forecasted Taxes (Including on Series B Cash Flow) Contribution Analysis Implied Ownership Implied Exchange Ratio | Series B Adjusted(1,2) AM AMGP 2017A DCF 2017A DCF 2018E DCF 2018E DCF 2019E DCF 2019E DCF 2020E DCF 2020E DCF 2021E DCF 2021E DCF 2022E DCF 2022E DCF 2017A Distributions 2017A Distributions 5.364x 2018E Distributions 2018E Distributions 2019E Distributions 2019E Distributions 2020E Distributions 2020E Distributions 2021E Distributions 2021E Distributions 2022E Distributions 2022E Distributions Source: Management projections. FactSet as of 8/10/2018. Note: AM DCF calculated as LP Interest in EBITDA less interest expense, maintenance capex, and tax withholding reimbursements paid to AR. AMGP DCF calculated as IDR DCF from AM to IDR LLC less G&A and cash taxes plus post-tax Series B payments. Note: AM distributions calculated as distributions attributable to LP unitholders. AMGP distributions defined as distributions attributable to IDR, LLC less taxes paid on full distributions available to IDR, LLC less G&A. Note: Cash tax shield from Series B depreciation of ~$6mm per year. (1)Implied exchange ratios utilize adjusted AMGP share count of fully diluted AMGP shares outstanding + 18.5mm converted Series B units. (2)AM Proposal: 1.710x XR and $3.84 cash consideration / unit. 15 76.1% 23.9% 70.7% 29.3% 66.6% 33.4% 65.8% 34.2% 65.0% 35.0% 64.5% 35.5% 82.9% 17.1% 75.8% 24.2% 71.4% 28.6% 68.3% 31.7% 66.6% 33.4% 65.3% 34.7% AMGP Proposal: 1.650x AM Proposal: 1.909x 3.193x 2.409x 1.994x 1.926x 1.858x 1.820x 3.140x 2.495x 2.151x 1.993x 1.878x CONFIDENTIAL DRAFT SUBJECT TO CHANGE
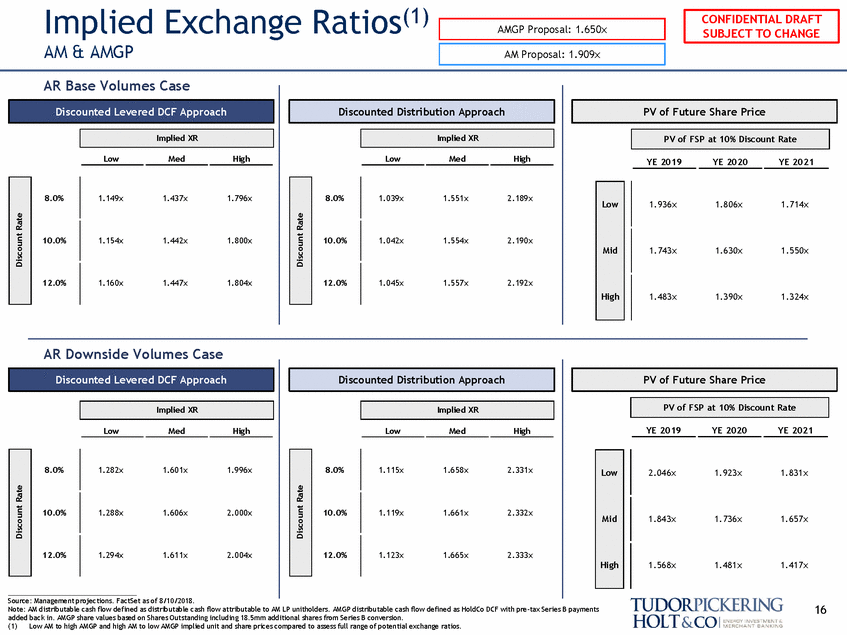
(1) Implied Exchange AM & AMGP Ratios AR Base Volumes Case 8.0% 1.437x 1.796x 8.0% 1.551x 2.189x 1.806x 1.714x 10.0% 1.442x 1.800x 10.0% 1.554x 2.190x 1.630x 1.550x 12.0% 1.447x 1.804x 12.0% 1.557x 2.192x 1.390x 1.324x AR Downside Volumes Case 8.0% 1.601x 1.996x 8.0% 1.658x 2.331x 1.923x 1.831x 10.0% 1.606x 2.000x 10.0% 1.661x 2.332x 1.736x 1.657x 12.0% 1.611x 2.004x 12.0% 1.665x 2.333x 1.481x 1.417x Source: Management projections. FactSet as of 8/10/2018. 16 Note: AM distributable cash flow defined as distributable cash flow attributable to AM LP unitholders. AMGP distributable cash flow defined as HoldCo DCF with pre-tax Series B payments added back in. AMGP share values based on Shares Outstanding including 18.5mm additional shares from Series B conversion. (1)Low AM to high AMGP and high AM to low AMGP implied unit and share prices compared to assess full range of potential exchange ratios. 2.046x 1.843x 1.568x 1.115x 1.119x 1.123x 1.282x 1.288x 1.294x Low Mid High Discount Rate Discount Rate YE 2019 YE 2020 YE 2021 Low MedHigh Low MedHigh Implied XR Implied XR PV of FSP at 10% Discount Rate PV of Future Share Price Discounted Distribution Approach Discounted Levered DCF Approach 1.936x 1.743x 1.483x 1.039x 1.042x 1.045x 1.149x 1.154x 1.160x Low Mid High Discount Rate Discount Rate YE 2019 YE 2020 YE 2021 Low MedHigh Low MedHigh PV of FSP at 10% Discount Rate Implied XR Implied XR PV of Future Share Price Discounted Distribution Approach Discounted Levered DCF Approach AMGP Proposal: 1.650x AM Proposal: 1.909x CONFIDENTIAL DRAFT SUBJECT TO CHANGE
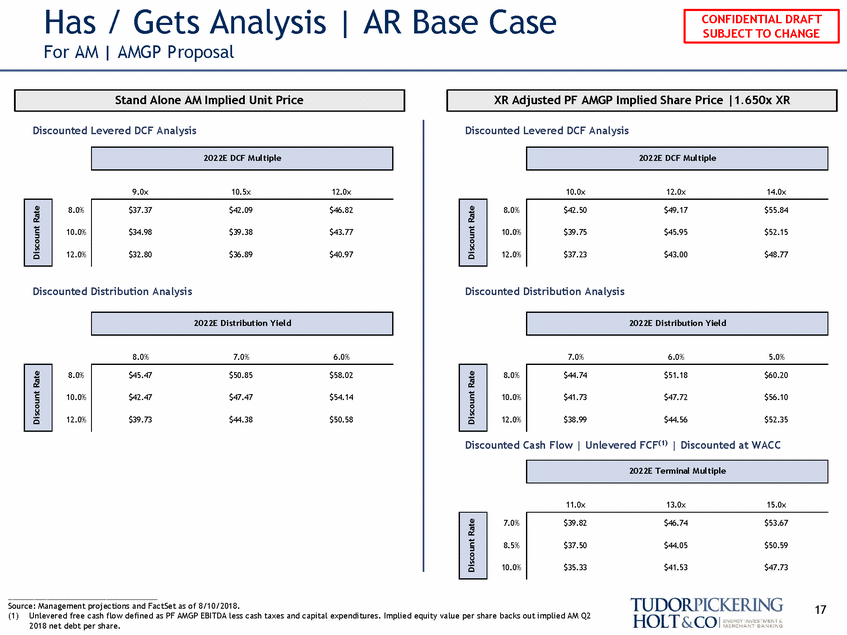
Has / Gets Analysis | For AM | AMGP Proposal AR Base Case Discounted Levered DCF Analysis Discounted Levered DCF Analysis 9.0x 10.5x 12.0x 10.0x 12.0x 14.0x 8.0% 8.0% 10.0% 10.0% 12.0% 12.0% Discounted Distribution Analysis Discounted Distribution Analysis 8.0% 7.0% 6.0% 7.0% 6.0% 5.0% 8.0% 8.0% 10.0% 10.0% 12.0% 12.0% Discounted Cash Flow | Unlevered FCF(1) | Discounted at WACC 11.0x 13.0x 15.0x 7.0% 8.5% 10.0% Source: Management projections and FactSet as of 8/10/2018. (1) Unlevered free cash flow defined as PF AMGP EBITDA less cash taxes and capital expenditures. Implied equity value per share backs out implied AM Q2 2018 net debt per share. 17 $39.82 $46.74 $53.67 $37.50 $44.05 $50.59 $35.33 $41.53 $47.73 Discount Rate 2022E Terminal M ultiple $44.74 $51.18 $60.20 $41.73 $47.72 $56.10 $38.99 $44.56 $52.35 Discount Rate $45.47 $50.85 $58.02 $42.47 $47.47 $54.14 $39.73 $44.38 $50.58 Discount Rate 2022E Distribution Yield 2022E Distribution Yield $42.50 $49.17 $55.84 $39.75 $45.95 $52.15 $37.23 $43.00 $48.77 Discount Rate $37.37 $42.09 $46.82 $34.98 $39.38 $43.77 $32.80 $36.89 $40.97 Discount Rate 2022E DCF M ultiple 2022E DCF M ultiple XR Adjusted PF AMGP Implied Share Price |1.650x XR Stand Alone AM Implied Unit Price CONFIDENTIAL DRAFT SUBJECT TO CHANGE
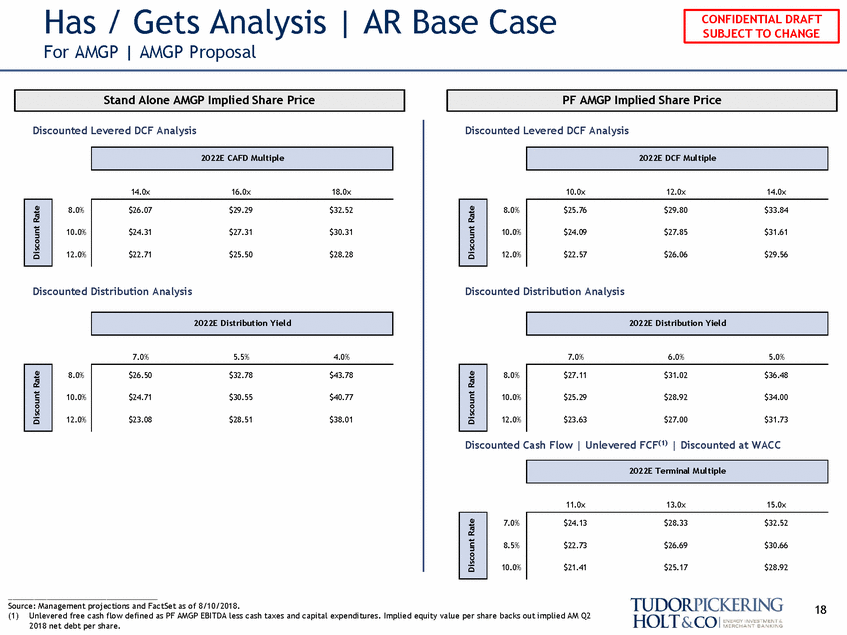
Has / Gets Analysis | For AMGP | AMGP Proposal AR Base Case Discounted Levered DCF Analysis Discounted Levered DCF Analysis 14.0x 16.0x 18.0x 10.0x 12.0x 14.0x 8.0% 8.0% 10.0% 10.0% 12.0% 12.0% Discounted Distribution Analysis Discounted Distribution Analysis 7.0% 5.5% 4.0% 7.0% 6.0% 5.0% 8.0% 8.0% 10.0% 10.0% 12.0% 12.0% Discounted Cash Flow | Unlevered FCF(1) | Discounted at WACC 11.0x 13.0x 15.0x 7.0% 8.5% 10.0% Source: Management projections and FactSet as of 8/10/2018. (1) Unlevered free cash flow defined as PF AMGP EBITDA less cash taxes and capital expenditures. Implied equity value per share backs out implied AM Q2 2018 net debt per share. 18 $24.13 $28.33 $32.52 $22.73 $26.69 $30.66 $21.41 $25.17 $28.92 Discount Rate 2022E Terminal M ultiple $27.11 $31.02 $36.48 $25.29 $28.92 $34.00 $23.63 $27.00 $31.73 Discount Rate $26.50 $32.78 $43.78 $24.71 $30.55 $40.77 $23.08 $28.51 $38.01 Discount Rate 2022E Distribution Yield 2022E Distribution Yield $25.76 $29.80 $33.84 $24.09 $27.85 $31.61 $22.57 $26.06 $29.56 Discount Rate $26.07 $29.29 $32.52 $24.31 $27.31 $30.31 $22.71 $25.50 $28.28 Discount Rate 2022E DCF M ultiple 2022E CAFD M ultiple PF AMGP Implied Share Price Stand Alone AMGP Implied Share Price CONFIDENTIAL DRAFT SUBJECT TO CHANGE
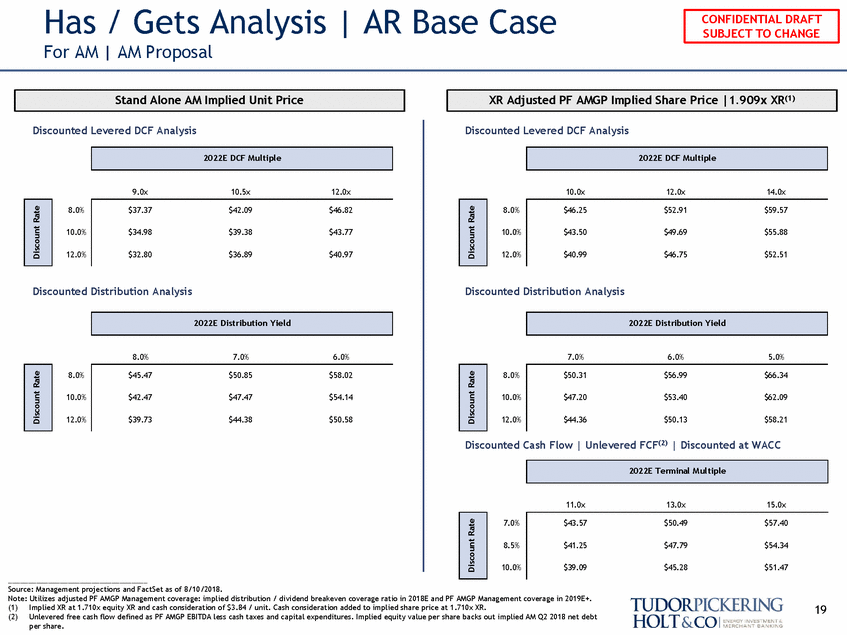
Has / Gets Analysis | For AM | AM Proposal AR Base Case Discounted Levered DCF Analysis Discounted Levered DCF Analysis 9.0x 10.5x 12.0x 10.0x 12.0x 14.0x 8.0% 8.0% 10.0% 10.0% 12.0% 12.0% Discounted Distribution Analysis Discounted Distribution Analysis 8.0% 7.0% 6.0% 7.0% 6.0% 5.0% 8.0% 8.0% 10.0% 10.0% 12.0% 12.0% Discounted Cash Flow | Unlevered FCF(2) | Discounted at WACC 11.0x 13.0x 15.0x 7.0% 8.5% 10.0% Source: Management projections and FactSet as of 8/10/2018. Note: Utilizes adjusted PF AMGP Management coverage: implied distribution / dividend breakeven coverage ratio in 2018E and PF AMGP Management coverage in 2019E+. (1) Implied XR at 1.710x equity XR and cash consideration of $3.84 / unit. Cash consideration added to implied share price at 1.710x XR. (2) Unlevered free cash flow defined as PF AMGP EBITDA less cash taxes and capital expenditures. Implied equity value per share backs out implied AM Q2 2018 net debt per share. 19 $43.57 $50.49 $57.40 $41.25 $47.79 $54.34 $39.09 $45.28 $51.47 Discount Rate 2022E Terminal M ultiple $50.31 $56.99 $66.34 $47.20 $53.40 $62.09 $44.36 $50.13 $58.21 Discount Rate $45.47 $50.85 $58.02 $42.47 $47.47 $54.14 $39.73 $44.38 $50.58 Discount Rate 2022E Distribution Yield 2022E Distribution Yield $46.25 $52.91 $59.57 $43.50 $49.69 $55.88 $40.99 $46.75 $52.51 Discount Rate $37.37 $42.09 $46.82 $34.98 $39.38 $43.77 $32.80 $36.89 $40.97 Discount Rate 2022E DCF M ultiple 2022E DCF M ultiple XR Adjusted PF AMGP Implied Share Price |1.909x XR(1) Stand Alone AM Implied Unit Price CONFIDENTIAL DRAFT SUBJECT TO CHANGE
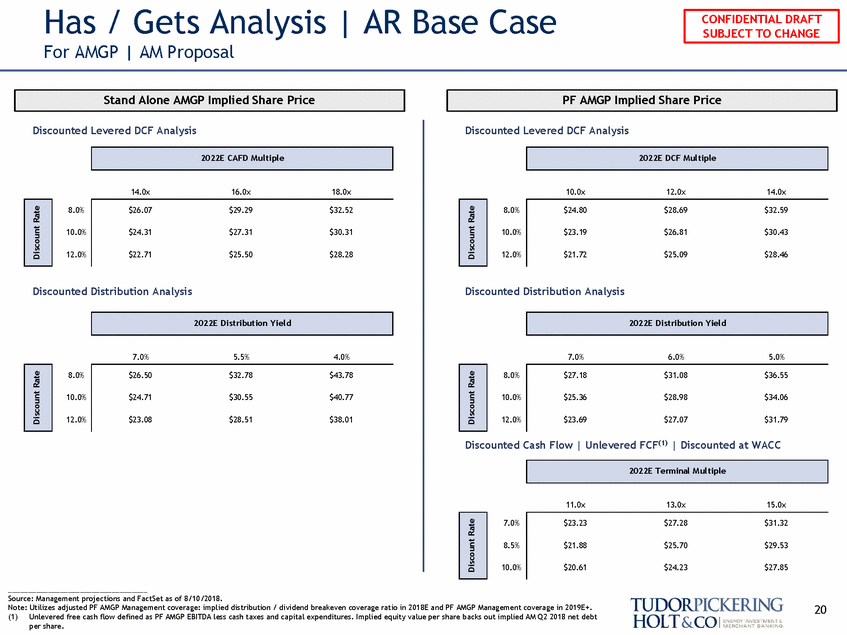
Has / Gets Analysis | For AMGP | AM Proposal AR Base Case Discounted Levered DCF Analysis Discounted Levered DCF Analysis 14.0x 16.0x 18.0x 10.0x 12.0x 14.0x 8.0% 8.0% 10.0% 10.0% 12.0% 12.0% Discounted Distribution Analysis Discounted Distribution Analysis 7.0% 5.5% 4.0% 7.0% 6.0% 5.0% 8.0% 8.0% 10.0% 10.0% 12.0% 12.0% Discounted Cash Flow | Unlevered FCF(1) | Discounted at WACC 11.0x 13.0x 15.0x 7.0% 8.5% 10.0% Source: Management projections and FactSet as of 8/10/2018. Note: Utilizes adjusted PF AMGP Management coverage: implied distribution / dividend breakeven coverage ratio in 2018E and PF AMGP Management coverage in 2019E+. (1) Unlevered free cash flow defined as PF AMGP EBITDA less cash taxes and capital expenditures. Implied equity value per share backs out implied AM Q2 2018 net debt per share. 20 $23.23 $27.28 $31.32 $21.88 $25.70 $29.53 $20.61 $24.23 $27.85 Discount Rate 2022E Terminal M ultiple $27.18 $31.08 $36.55 $25.36 $28.98 $34.06 $23.69 $27.07 $31.79 Discount Rate $26.50 $32.78 $43.78 $24.71 $30.55 $40.77 $23.08 $28.51 $38.01 Discount Rate 2022E Distribution Yield 2022E Distribution Yield $24.80 $28.69 $32.59 $23.19 $26.81 $30.43 $21.72 $25.09 $28.46 Discount Rate $26.07 $29.29 $32.52 $24.31 $27.31 $30.31 $22.71 $25.50 $28.28 Discount Rate 2022E DCF M ultiple 2022E CAFD M ultiple PF AMGP Implied Share Price Stand Alone AMGP Implied Share Price CONFIDENTIAL DRAFT SUBJECT TO CHANGE
III. Pro Forma Impact – Accretion/Dilution 21 CONFIDENTIAL DRAFT SUBJECT TO CHANGE
A. Pre-Tax 22 CONFIDENTIAL DRAFT SUBJECT TO CHANGE
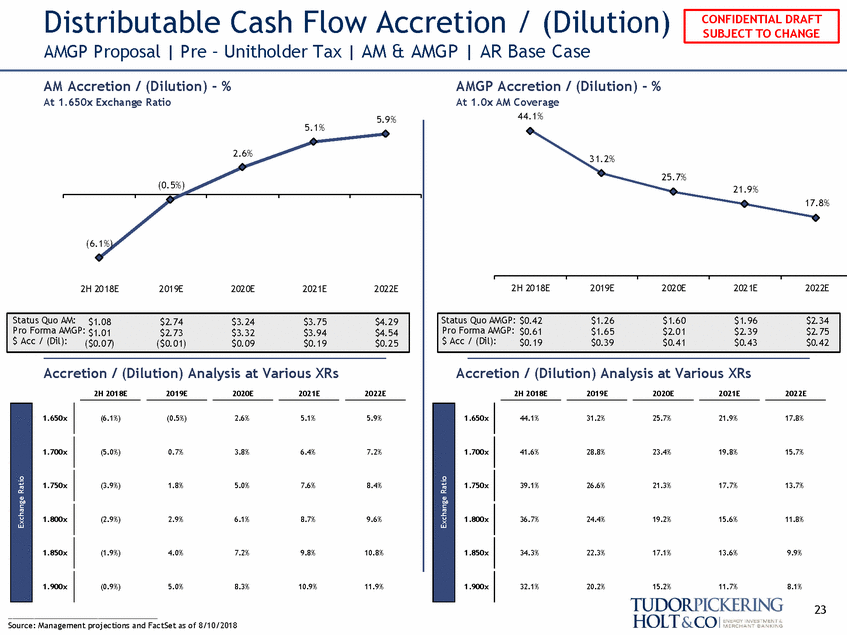
Distributable Cash Flow Accretion / (Dilution) AMGP Proposal | Pre – Unitholder Tax | AM & AMGP | AR Base Case AM Accretion / (Dilution) - % At 1.650x Exchange Ratio AMGP Accretion / (Dilution) - % At 1.0x AM Coverage 44.1% 5.9% 5.1% 2.6% 31.2% 25.7% (0.5%) 21.9% 17.8% (6.1%) 2H 2018E 2019E 2020E 2021E 2022E 2H 2018E 2019E 2020E 2021E 2022E Pro Forma AMGP: $0.61 $1.65 $2.01 $2.39 $2.75 Accretion / (Dilution) Analysis at Various XRs Accretion / (Dilution) Analysis at Various XRs 2H 2018E 2019E 2020E 2021E 2022E 2H 2018E 2019E 2020E 2021E 2022E 1.650x (6.1%) (0.5%) 2.6% 5.1% 5.9% 1.650x 44.1% 31.2% 25.7% 21.9% 17.8% 1.700x (5.0%) 0.7% 3.8% 6.4% 7.2% 1.700x 41.6% 28.8% 23.4% 19.8% 15.7% 1.750x (3.9%) 1.8% 5.0% 7.6% 8.4% 1.750x 39.1% 26.6% 21.3% 17.7% 13.7% 1.800x (2.9%) 2.9% 6.1% 8.7% 9.6% 1.800x 36.7% 24.4% 19.2% 15.6% 11.8% 1.850x (1.9%) 4.0% 7.2% 9.8% 10.8% 1.850x 34.3% 22.3% 17.1% 13.6% 9.9% 1.900x (0.9%) 5.0% 8.3% 10.9% 11.9% 1.900x 32.1% 20.2% 15.2% 11.7% 8.1% 23 Source: Management projections and FactSet as of 8/10/2018 Exchange Ratio Exchange Ratio Status Quo AMGP: $0.42 $1.26 $1.60 $1.96 $2.34 $ Acc / (Dil):$0.19 $0.39 $0.41 $0.43 $0.42 Status Quo AM: $1.08 $2.74 $3.24 $3.75 $4.29 Pro Forma AMGP: $1.01 $2.73 $3.32 $3.94 $4.54 $ Acc / (Dil):($0.07) ($0.01) $0.09 $0.19 $0.25 CONFIDENTIAL DRAFT SUBJECT TO CHANGE
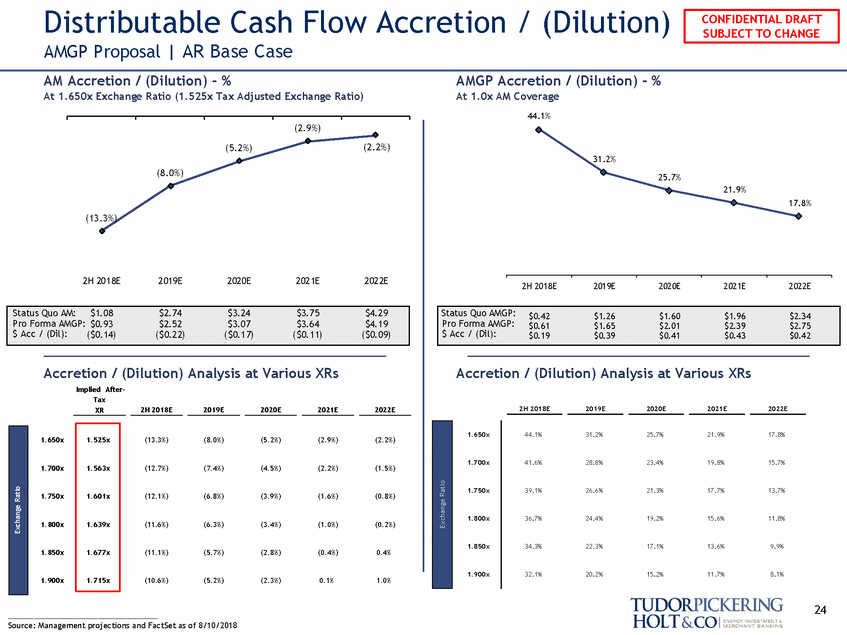
Distributable Cash Flow AMGP Proposal | AR Base Case Accretion / (Dilution) AM Accretion / (Dilution) - % At 1.650x Exchange Ratio (1.525x Tax Adjusted Exchange Ratio) AMGP Accretion / (Dilution) - % At 1.0x AM Coverage 44.1% (2.9%) (2.2%) (5.2%) 31.2% (8.0%) 25.7% 21.9% 17.8% (13.3%) 2H 2018E 2019E 2020E 2021E 2022E 2H 2018E 2019E 2020E 2021E 2022E Pro Forma AMGP: $0.61 $1.65 $2.01 $2.39 $2.75 Accretion / (Dilution) Analysis at Various XRs Implied After-Tax Accretion / (Dilution) Analysis at Various XRs 2H 2018E 2019E 2020E 2021E 2022E XR 2H 2018E 2019E 2020E 2021E 2022E 1.650x 44.1% 31.2% 25.7% 21.9% 17.8% 1.650x (13.3%) (8.0%) (5.2%) (2.9%) (2.2%) 1.700x 41.6% 28.8% 23.4% 19.8% 15.7% 1.700x (12.7%) (7.4%) (4.5%) (2.2%) (1.5%) 1.750x 39.1% 26.6% 21.3% 17.7% 13.7% 1.750x (12.1%) (6.8%) (3.9%) (1.6%) (0.8%) 1.800x 36.7% 24.4% 19.2% 15.6% 11.8% 1.800x (11.6%) (6.3%) (3.4%) (1.0%) (0.2%) 1.850x 34.3% 22.3% 17.1% 13.6% 9.9% 1.850x (11.1%) (5.7%) (2.8%) (0.4%) 0.4% 1.900x 32.1% 20.2% 15.2% 11.7% 8.1% 1.900x (10.6%) (5.2%) (2.3%) 0.1% 1.0% 24 Source: Management projections and FactSet as of 8/10/2018 1.525x 1.563x 1.601x 1.639x 1.677x 1.715x Exchange Ratio Exchange Ratio Status Quo AMGP:$0.42$1.26$1.60$1.96$2.34 $ Acc / (Dil):$0.19$0.39$0.41$0.43$0.42 Status Quo AM:$1.08 $2.74 $3.24 $3.75 $4.29 Pro Forma AMGP: $0.93 $2.52 $3.07 $3.64 $4.19 $ Acc / (Dil):($0.14) ($0.22) ($0.17) ($0.11) ($0.09) CONFIDENTIAL DRAFT SUBJECT TO CHANGE
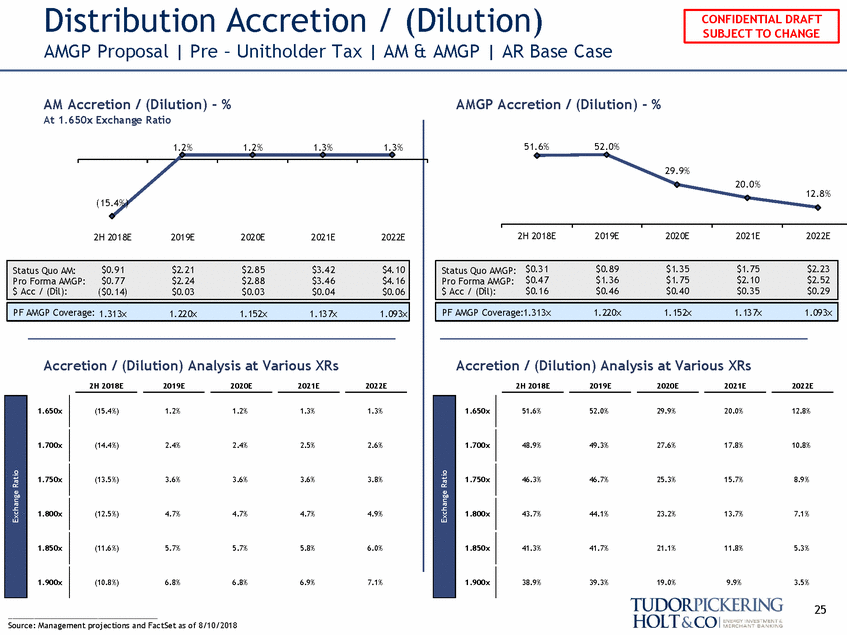
Distribution Accretion / (Dilution) AMGP Proposal | Pre – Unitholder Tax | AM & AMGP | AR Base Case AM Accretion / (Dilution) - % At 1.650x Exchange Ratio AMGP Accretion / (Dilution) - % 51.6% 52.0% 29.9% 20.0% 12.8% 2H 2018E 2019E 2020E 2021E 2022E Pro Forma AMGP: $0.77 $2.24 $2.88 $3.46 $4.16 Accretion / (Dilution) Analysis at Various XRs Accretion / (Dilution) Analysis at Various XRs 2H 2018E 2019E 2020E 2021E 2022E 1.650x 1.650x 51.6% 52.0% 29.9% 20.0% 12.8% 1.700x 1.700x 48.9% 49.3% 27.6% 17.8% 10.8% 1.750x 1.750x 46.3% 46.7% 25.3% 15.7% 8.9% 1.800x 1.800x 43.7% 44.1% 23.2% 13.7% 7.1% 1.850x 1.850x 41.3% 41.7% 21.1% 11.8% 5.3% 1.900x (10.8%) 6.8% 6.8% 6.9% 7.1% 1.900x 38.9% 39.3% 19.0% 9.9% 3.5% 25 Source: Management projections and FactSet as of 8/10/2018 Exchange Ratio Exchange Ratio Status Quo AM: $ Acc / (Dil): PF AMGP Cover Status Quo AMGP: $0.31 $0.89 $1.35 $1.75 $2.23 Pro Forma AMGP: $0.47 $1.36 $1.75 $2.10 $2.52 $ Acc / (Dil):$0.16 $0.46 $0.40 $0.35 $0.29 PF AMGP Coverage:1.313x 1.220x 1.152x 1.137x 1.093x 1.2% 1.2% 1.3% 1.3% (15.4%) 2H 2018E 2019E 2020E 2021E 2022E $0.91 $2.21 $2.85 $3.42 $4.10 ($0.14) $0.03 $0.03 $0.04 $0.06 age: 1.313x 1.220x 1.152x 1.137x 1.093x 2H 2018E 2019E 2020E 2021E 2022E (15.4%) 1.2% 1.2% 1.3% 1.3% (14.4%) 2.4% 2.4% 2.5% 2.6% (13.5%) 3.6% 3.6% 3.6% 3.8% (12.5%) 4.7% 4.7% 4.7% 4.9% (11.6%) 5.7% 5.7% 5.8% 6.0% CONFIDENTIAL DRAFT SUBJECT TO CHANGE
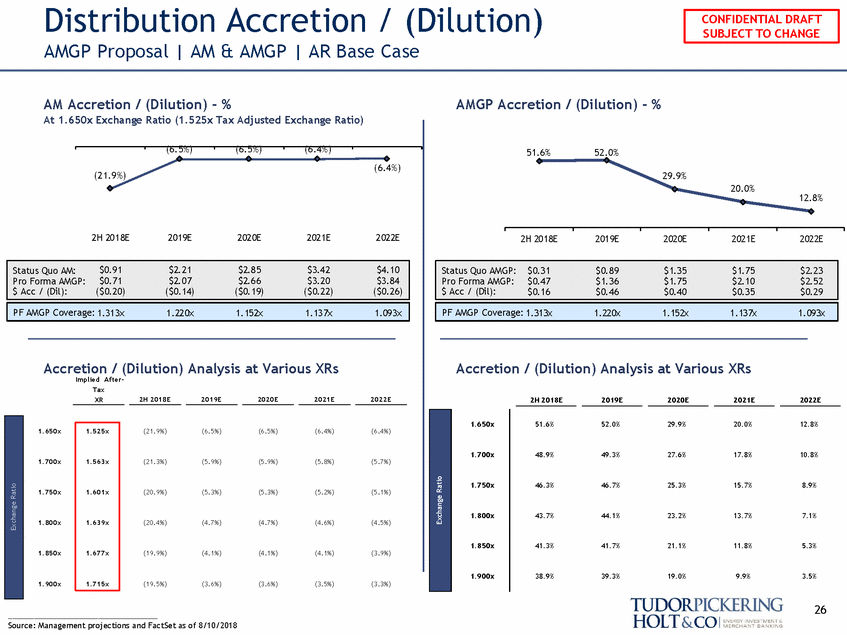
Distribution Accretion / (Dilution) AMGP Proposal | AM & AMGP | AR Base Case AM Accretion / (Dilution) - % At 1.650x Exchange Ratio (1.525x Tax Adjusted Exchange Ratio) AMGP Accretion / (Dilution) - % 51.6% 52.0% 29.9% 20.0% 12.8% 2H 2018E 2019E 2020E 2021E 2022E Accretion / (Dilution) Analysis at Various XRs Accretion / (Dilution) Analysis at Various XRs 2H 2018E 2019E 2020E 2021E 2022E 1.650x 51.6% 52.0% 29.9% 20.0% 12.8% 1.650x 1.700x 48.9% 49.3% 27.6% 17.8% 10.8% 1.700x 1.750x 46.3% 46.7% 25.3% 15.7% 8.9% 1.750x 1.800x 43.7% 44.1% 23.2% 13.7% 7.1% 1.800x 1.850x 41.3% 41.7% 21.1% 11.8% 5.3% 1.850x 1.900x 38.9% 39.3% 19.0% 9.9% 3.5% 1.900x (19.5%) (3.6%) (3.6%) (3.5%) (3.3%) 26 Source: Management projections and FactSet as of 8/10/2018 1.715x Exchange Ratio Exchange Ratio Status Quo AM:$0.91 $2.21 $2.85 $3.42 $4.10 Pro Forma AMGP:$0.71 $2.07 $2.66 $3.20 $3.84 $ Acc / (Dil): PF AMGP Coverage: 1.313x 1.220x 1.152x 1.137x 1.093x Status Quo AMGP: $0.31$0.89$1.35$1.75$2.23 Pro Forma AMGP:$0.47$1.36$1.75$2.10$2.52 $ Acc / (Dil):$0.16$0.46$0.40$0.35$0.29 PF AMGP Coverage: 1.313x1.220x1.152x1.137x1.093x (6.5%) (6.5%) (6.4%) (6.4%) (21.9%) 2H 2018E 2019E 2020E 2021E 2022E ($0.20) ($0.14) ($0.19) ($0.22) ($0.26) Implied After-Tax XR2H 2018E2019E2020E2021E2022E 1.525x(21.9%)(6.5%)(6.5%)(6.4%)(6.4%) 1.563x(21.3%)(5.9%)(5.9%)(5.8%)(5.7%) 1.601x(20.9%)(5.3%)(5.3%)(5.2%)(5.1%) 1.639x(20.4%)(4.7%)(4.7%)(4.6%)(4.5%) 1.677x(19.9%)(4.1%)(4.1%)(4.1%)(3.9%) CONFIDENTIAL DRAFT SUBJECT TO CHANGE
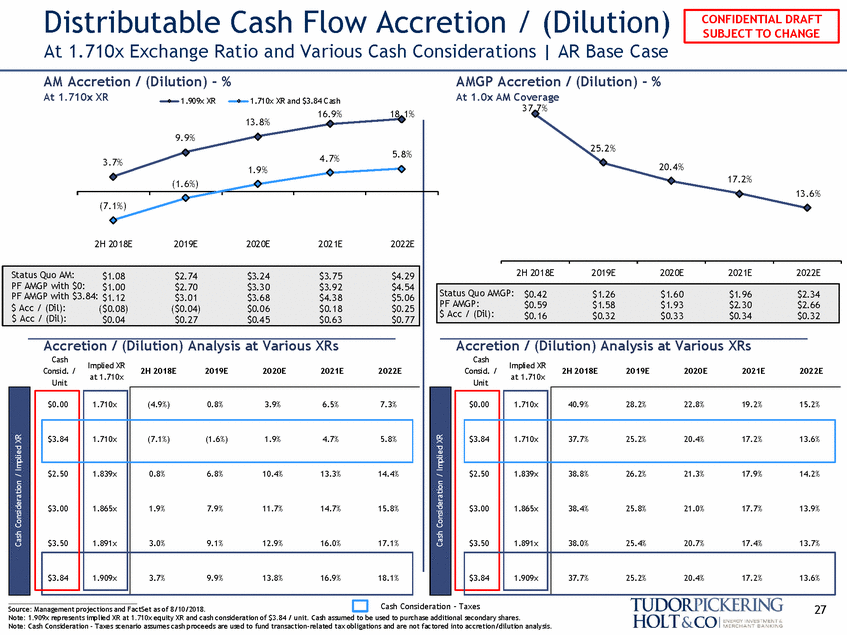
Distributable Cash Flow Accretion / (Dilution) At 1.710x Exchange Ratio and Various Cash Considerations | AR Base Case AM Accretion / (Dilution) - % AMGP Accretion / (Dilution) - % At 1.0x AM Coverage 37.7% At 1.710x XR 1.909x XR 1.710x XR and $3.84 Cash 16.9% 18.1% 25.2% 3.7% 20.4% 1.9% 17.2% 13.6% 16.9% (7.1%) 3.7% (7.1%) 13.8% 9.9% 2H 2018E 2019E 2020E 2021E 2022E 2H 2018E 2019E 2020E 2021E 2022E PF AMGP: $0.59 $1.58 $1.93 $2.30 $2.66 Accretion / (Dilution) Analysis at Various XRs Accretion / (Dilution) Analysis at Various XRs Cash Cash Consid. / Unit Implied XR at 1.710x Consid. / Unit 2H 2018E 2019E 2020E 2021E 2022E Cash Consideration - Taxes 27 Source: Management projections and FactSet as of 8/10/2018. Note: 1.909x represents implied XR at 1.710x equity XR and cash consideration of $3.84 / unit. Cash assumed to be used to purchase additional secondary shares. Note: Cash Consideration – Taxes scenario assumes cash proceeds are used to fund transaction-related tax obligations and are not factored into accretion/dilution analysis. $0.00 $3.84 $2.50 $3.00 $3.50 $3.84 1.909x 3.7% 9.9% 13.8% 16.9% 18.1% Cash Consideration / Implied XR 40.9% 28.2% 22.8% 19.2% 15.2% $0.00 1.710x $3.84 1.710x 37.7% 25.2% 20.4% 17.2% 13.6% $2.50 $3.00 $3.50 1.839x 1.865x 1.891x 38.8% 26.2% 21.3% 17.9% 14.2% 38.4% 25.8% 21.0% 17.7% 13.9% 38.0% 25.4% 20.7% 17.4% 13.7% $3.84 1.909x 37.7% 25.2% 20.4% 17.2% 13.6% Cash Consideration / Implied XR Status Quo AMGP: $0.42 $1.26 $1.60 $1.96 $2.34 $ Acc / (Dil):$0.16 $0.32 $0.33 $0.34 $0.32 Status Quo AM: PF AMGP with $0:$1.00 $2.70 $3.30 $3.92 $4.54 PF AMGP with $3.84: $1.12 $3.01 $3.68 $4.38 $5.06 $ Acc / (Dil): $ Acc / (Dil): 13.8% 9.9% 4.7%5.8% (1.6%) 18.1% (1.6%) 1.9% 4.7% 5.8% 2H 2018E 2019E 2020E 2021E 2022E $1.0$81.08… $$22..7744… $3$.234.…24 $3.75$…3.75 $4.29… $4.29 ($0.08) ($0.04) $0.06 $0.18 $0.25 $0.04 $0.27 $0.45 $0.63 $0.77 Implied XR 2H 2018E 2019E 2020E 2021E 2022E at 1.710x 1.710x (4.9%) 0.8% 3.9% 6.5% 7.3% 1.710x (7.1%) (1.6%) 1.9% 4.7% 5.8% 1.839x 0.8% 6.8% 10.4% 13.3% 14.4% 1.865x 1.9% 7.9% 11.7% 14.7% 15.8% 1.891x 3.0% 9.1% 12.9% 16.0% 17.1% CONFIDENTIAL DRAFT SUBJECT TO CHANGE
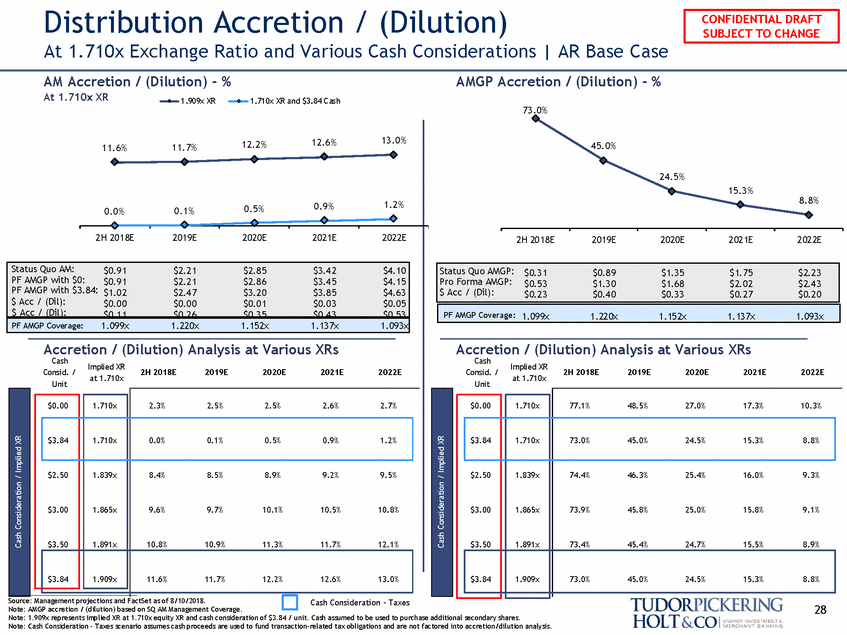
Distribution Accretion / (Dilution) At 1.710x Exchange Ratio and Various Cash Considerations | AR Base Case AM Accretion / (Dilution) - % AMGP Accretion / (Dilution) - % At 1.710x XR 1.909x XR 1.710x XR and $3.84 Cash 73.0% 45.0% 24.5% 15.3% 8.8% 1.2% 130..85%% 0.9% 0.91.9%% 0.0% 3.7% 2H 2018E 2019E 2020E 2021E 2022E PF AMGP with $0: $0.9$11.08… $2$.22.714… $$3.22.48…6 $3.7$53….45 $4.29…$4.15 $ Acc / (Dil): Accretion / (Dilution) Analysis at Various XRs Accretion / (Dilution) Analysis at Various XRs Cash Cash Consid. / Unit Implied XR at 1.710x Consid. / Unit 2H 2018E 2019E 2020E 2021E 2022E 28 Note: AMGP accretion / (dilution) based on SQ AM Management Coverage. Note: 1.909x represents implied XR at 1.710x equity XR and cash consideration of $3.84 / unit. Cash assumed to be used to purchase additional secondary shares. Note: Cash Consideration – Taxes scenario assumes cash proceeds are used to fund transaction-related tax obligations and are not factored into accretion/dilution analysis. Cash Consideration / Implied XR Cash Consideration / Implied XR $0.00 $3.84 $2.50 $3.00 $3.50 $3.84 1.909x 11.6% 11.7% 12.2% 12.6% 13.0% Source: Management projections and Fac tSet as of 8/10/2018. Cash Consideration - Taxes 77.1% 48.5% 27.0% 17.3% 10.3% $0.00 1.710x $3.84 1.710x 73.0% 45.0% 24.5% 15.3% 8.8% $2.50 $3.00 $3.50 1.839x 1.865x 1.891x 74.4% 46.3% 25.4% 16.0% 9.3% 73.9% 45.8% 25.0% 15.8% 9.1% 73.4% 45.4% 24.7% 15.5% 8.9% $3.84 1.909x 73.0% 45.0% 24.5% 15.3% 8.8% Status Quo AM: PF AMGP with $3.84: $1.02 $2.47 $3.20 $3.85 $4.63 $ Acc / (Dil): PF AMGP Coverage:1.099x 1.220x 1.152x 1.137x 1.093x Status Quo AMGP: $0.31 $0.89 $1.35 $1.75 $2.23 Pro Forma AMGP: $0.53 $1.30 $1.68 $2.02 $2.43 $ Acc / (Dil):$0.23 $0.40 $0.33 $0.27 $0.20 PF AMGP Coverage: 1.099x 1.220x 1.152x 1.137x 1.093x 11.6% 11.7% 12.2% 12.6% 13.0% 16.9% 18.1% (1.6%) 1.9% 4.7% 5.8% (7.1%) 2H 2018E 2019E 2020E 2021E 2022E 2H 2018E 2019E 2020E 2021E 2022E $0.91 $2.21 $2.85 $3.42 $4.10 $0.00 $0.00 $0.01 $0.03 $0.05 $0.11 $0.26 $0.35 $0.43 $0.53 Implied XR 2H 2018E 2019E 2020E 2021E 2022E at 1.710x 1.710x 2.3% 2.5% 2.5% 2.6% 2.7% 1.710x 0.0% 0.1% 0.5% 0.9% 1.2% 1.839x 8.4% 8.5% 8.9% 9.2% 9.5% 1.865x 9.6% 9.7% 10.1% 10.5% 10.8% 1.891x 10.8% 10.9% 11.3% 11.7% 12.1% CONFIDENTIAL DRAFT SUBJECT TO CHANGE
B. Step-Up 29 CONFIDENTIAL DRAFT SUBJECT TO CHANGE
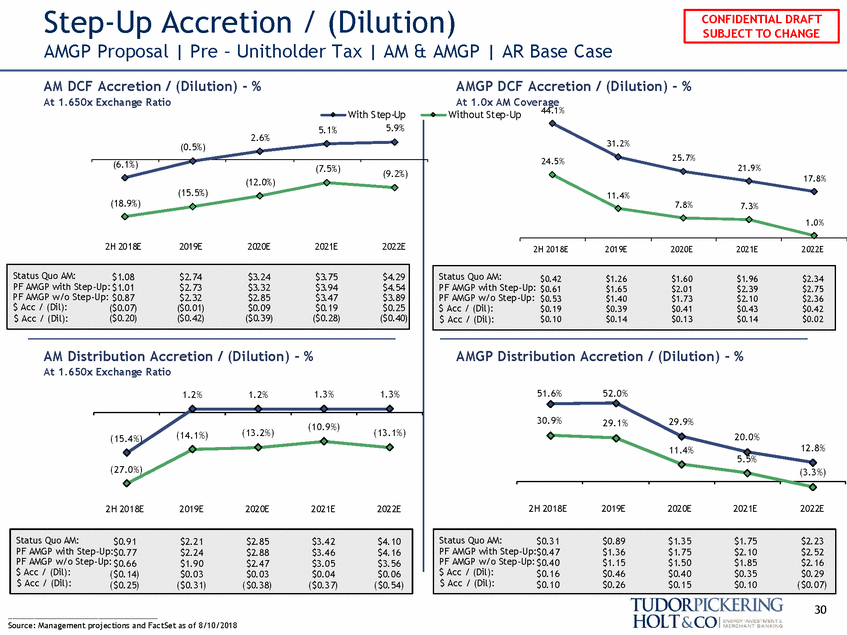
Step-Up Accretion / (Dilution) AMGP Proposal | Pre – Unitholder Tax | AM & AMGP | AR Base Case AM DCF Accretion / (Dilution) - % At 1.650x Exchange Ratio AMGP DCF Accretion / (Dilution) - % At 1.0x AM Coverage 44.1% With Step-Up Without Step-Up 2.6% 31.2% 25.7% 24.5% 21.9% 17.8% 11.4% 7% 21.9% 7.8% 7.3% 17.8% 1.0% % 7.3% 1.0% 2H 2018E 2022E 2019E 2020E 2021E 2022E 0E 2021E PF AMGP with Step-Up: $0.61 $1.65 $2.01 $2.39 $2.75 $1.60 1 3 1 3 $0.43 $0.42 $0.14 $0.02 AM Distribution Accretion / (Dilution) - % AMGP Distribution Accretion / (Dilution) - % At 1.650x 51.6% 52.0% 30.9% 29.9% 29.1% 20.0% 12.8% 11.4% 5.5% (3.3%) 2H 2018E 2019E 2020E 2021E 2022E PF AMGP w/o Step-Up: $0.40 $1.15 $1.50 $1.85 $2.16 $ Acc / (Dil): $0.10 $0.26 $0.15 $0.10 ($0.07) 30 Source: Management projections and FactSet as of 8/10/2018 Status Quo AM:$0.31 $0.89 $1.35 $1.75 $2.23 PF AMGP with Step-Up:$0.47 $1.36 $1.75 $2.10 $2.52 $ Acc / (Dil):$0.16 $0.46 $0.40 $0.35 $0.29 Status Quo AM: PF AMGP with Step-Up:$0.77 $2.24 $2.88 $3.46 $4.16 PF AMGP w/o Step-Up: $0.66 $1.90 $2.47 $3.05 $3.56 $ Acc / (Dil):($0.14) $0.03 $0.03 $0.04 $0.06 $ Acc / (Dil):($0.25) ($0.31) ($0.38) ($0.37) ($0.54) Status Quo AM:$0.42$1.26$1.60$1.96$2.34 PF AMGP w$/1o.9S6tep-Up: $0.5$32.34 $1.40$1.73$2.10$2.36 $ Acc / (D$il2):.39 $0.1$92.75 $0.39$0.41$0.43$0.42 $ Acc / (D$il2).:10 $0.1$02.36 $0.14$0.13$0.14$0.02 Status Quo AM: PF AMGP with Step PF AMGP w/o Step-Up: $0.87 $2.32 $2$.805.42 $3.4$71.26 $3.89 $ Acc / (Dil): $ Acc / (Dil): 5.1%5.9% (0.5%) (6.1%) 44.1% (7.5%) (9.2%) (12.0%) (15.5%) 31.2%25. (18.9%) 24.5% 11.4%7.8 2H 2018E 2019E 2020E 2021E 2022E 2H 2018E2019E202 $1.08 $2.74 $3.24 $3.75 $4.29 -Up: $1.01 $2.73 $3.32 $3.94 $4.54 ($0.07) ($0.01) $0$.009.61 $0.1$91.65 $0.25 $2.0 ($0.20) ($0.42) ($0$.309.)53 ($0.2$81) .40 ($0.40)$1.7 $0.19 $0.39 $0.4 $0.10 $0.14 $0.1 Exchange Ratio 1.2% 1.2% 1.3% 1.3% (10.9%) (15.4%) (14.1%) (13.2%) (13.1%) (27.0%) 2H 2018E 2019E 2020E 2021E 2022E $0.91 $2.21 $2.85 $3.42 $4.10 CONFIDENTIAL DRAFT SUBJECT TO CHANGE
C. After-Tax 31 CONFIDENTIAL DRAFT SUBJECT TO CHANGE
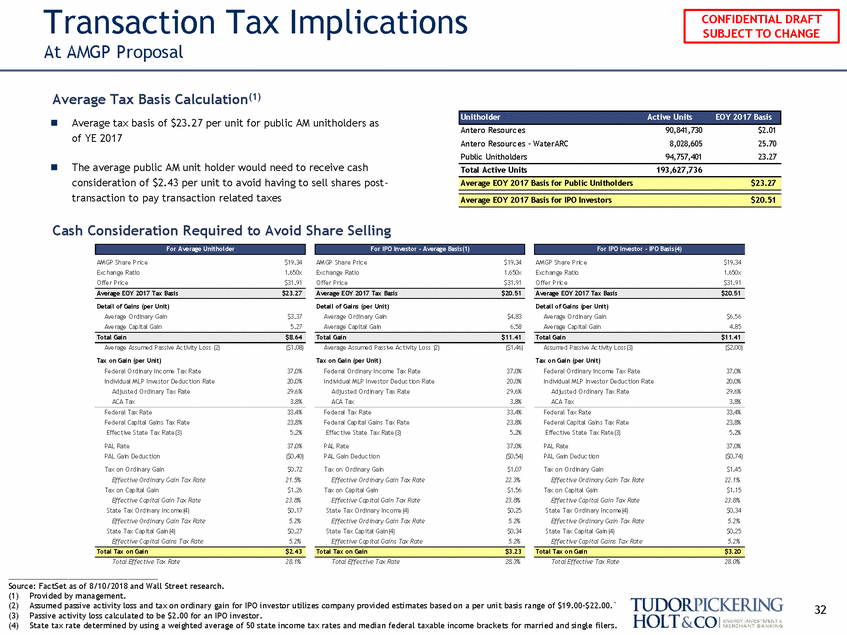
Transaction Tax Implications At AMGP Proposal Average Tax Basis Calculation(1) Average tax basis of $23.27 per unit for public AM unitholders as of YE 2017 Antero Resourc es Antero Resourc es - WaterARC Public Unitholders 90,841,730 8,028,605 94,757,401 $2.01 25.70 23.27 The average public AM unit holder would need to receive cash consideration of $2.43 per unit to avoid having to sell shares post-transaction to pay transaction related taxes Total Active Units 193,627,736 Cash Consideration Required to Avoid Share Selling AM GP Share Pric e Exc hange Ratio O ffer Pric e $19.34 1.650x $31.91 AM GP Share Pric e Exc hange Ratio O ffer Pric e $19.34 1.650x $31.91 AM GP Share Pric e Exc hange Ratio O ffer Pric e $19.34 1.650x $31.91 Detail of Gains (per Unit) Average O rdinary Gain Average Capital Gain Detail of Gains (per Unit) Average O rdinary Gain Average Capital Gain Detail of Gains (per Unit) Average O rdinary Gain Average Capital Gain $3.37 5.27 $4.83 6.58 $6.56 4.85 Average Assumed Passive Ac tivity Loss (2) Tax on Gain (per Unit) Federal O rdinary Inc ome Tax Rate Individual M LP Investor Deduc tion Rate Adjusted O rdinary Tax Rate ACA Tax Federal Tax Rate Federal Capital Gains Tax Rate Effec tive State Tax Rate(3) ($1.08) Average Assumed Passive Ac tivity Loss (2) Tax on Gain (per Unit) Federal O rdinary Inc ome Tax Rate Individual M LP Investor Deduc tion Rate Adjusted O rdinary Tax Rate ACA Tax Federal Tax Rate Federal Capital Gains Tax Rate Effec tive State Tax Rate(3) ($1.46) Assumed Passive Ac tivity Loss(3) Tax on Gain (per Unit) Federal O rdinary Inc ome Tax Rate Individual M LP Investor Deduc tion Rate Adjusted O rdinary Tax Rate ACA Tax Federal Tax Rate Federal Capital Gains Tax Rate Effec tive State Tax Rate(3) ($2.00) 37.0% 20.0% 29.6% 3.8% 33.4% 23.8% 5.2% 37.0% 20.0% 29.6% 3.8% 33.4% 23.8% 5.2% 37.0% 20.0% 29.6% 3.8% 33.4% 23.8% 5.2% PAL Rate PAL Gain Deduc tion 37.0% ($0.40) PAL Rate PAL Gain Deduc tion 37.0% ($0.54) PAL Rate PAL Gain Deduc tion 37.0% ($0.74) Tax on O rdinary Gain Effective Ordinary Gain Tax Rate Tax on Capital Gain Effective Capital Gain Tax Rate State Tax O rdinary Inc ome(4) Effective Ordinary Gain Tax Rate State Tax Capital Gain(4) Effective Capital Gains Tax Rate $0.72 21.5% $1.26 23.8% $0.17 5.2% $0.27 5.2% Tax on O rdinary Gain Effective Ordinary Gain Tax Rate Tax on Capital Gain Effective Capital Gain Tax Rate State Tax O rdinary Inc ome(4) Effective Ordinary Gain Tax Rate State Tax Capital Gain(4) Effective Capital Gains Tax Rate $1.07 22.3% $1.56 23.8% $0.25 5.2% $0.34 5.2% Tax on O rdinary Gain Effective Ordinary Gain Tax Rate Tax on Capital Gain Effective Capital Gain Tax Rate State Tax O rdinary Inc ome(4) Effective Ordinary Gain Tax Rate State Tax Capital Gain(4) Effective Capital Gains Tax Rate $1.45 22.1% $1.15 23.8% $0.34 5.2% $0.25 5.2% Total Effective Tax Rate 28.1% Total Effective Tax Rate 28.3% Total Effective Tax Rate 28.0% Source: FactSet as of 8/10/2018 and Wall Street research. (1) (2) (3) (4) Provided by management. Assumed passive activity loss and tax on ordinary gain for IPO investor utilizes company provided estimates based on a per unit basis range of $19.00-$22.00.` Passive activity loss calculated to be $2.00 for an IPO investor. State tax rate determined by using a weighted average of 50 state income tax rates and median federal taxable income brackets for married and single filers. 32 Total Tax on Gain $3.20 Total Tax on Gain $3.23 Total Tax on Gain $2.43 Total Gain $11.41 Total Gain $11.41 Total Gain $8.64 Average EOY 2017 Tax Basis $20.51 Average EOY 2017 Tax Basis $20.51 Average EOY 2017 Tax Basis $23.27 For IPO Investor - IPO Basis(4) For IPO Investor - Average Basis(1) For Average Unitholder Average EOY 2017 Basis for Public Unitholders $23.27 Average EOY 2017 Basis for IPO Investors $20.51 Unitholder Active Units EOY 2017 Basis CONFIDENTIAL DRAFT SUBJECT TO CHANGE
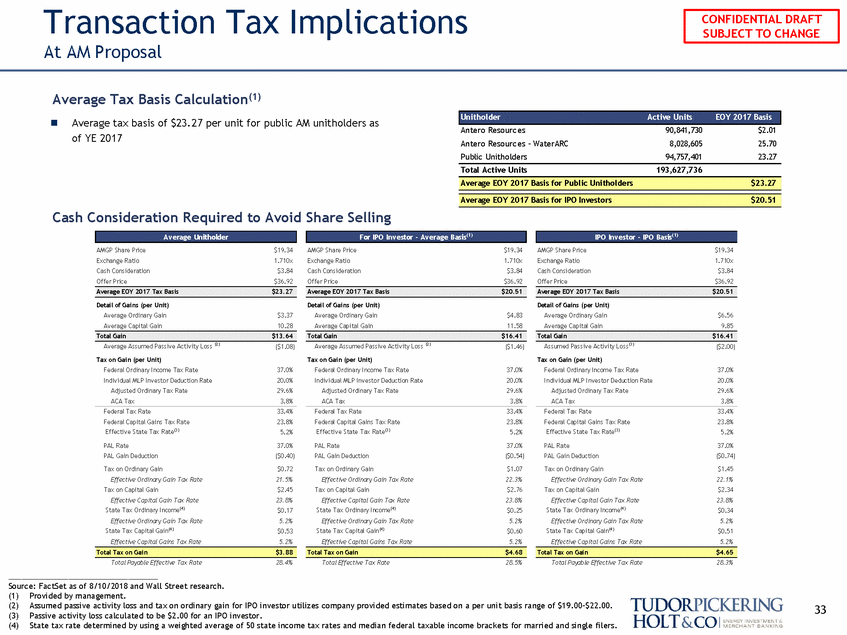
Transaction Tax Implications At AM Proposal Average Tax Basis Calculation(1) Average tax basis of $23.27 per unit for public AM unitholders as of YE 2017 Antero Resourc es Antero Resourc es - WaterARC Public Unitholders 90,841,730 8,028,605 94,757,401 $2.01 25.70 23.27 Total Active Units 193,627,736 Cash Consideration Required to Avoid Share Selling AMGP Share Price Exchange Ratio Cash Consideration Offer Price $19.34 1.710x $3.84 $36.92 AMGP Share Price Exchange Ratio Cash Consideration Offer Price $19.34 1.710x $3.84 $36.92 AMGP Share Price Exchange Ratio Cash Consideration Offer Price $19.34 1.710x $3.84 $36.92 Detail of Gains (per Unit) Average Ordinary Gain Average Capital Gain Detail of Gains (per Unit) Average Ordinary Gain Average Capital Gain Detail of Gains (per Unit) Average Ordinary Gain Average Capital Gain $3.37 10.28 $4.83 11.58 $6.56 9.85 Average Assumed Passive Activity Loss (2) Average Assumed Passive Activity Loss (2) Assumed Passive Activity Loss (3) ($1.08) ($1.46) ($2.00) Tax on Gain (per Unit) Federal Ordinary Income Tax Rate Individual MLP Investor Deduction Rate Adjusted Ordinary Tax Rate ACA Tax Federal Tax Rate Federal Capital Gains Tax Rate Effective State Tax Rate(3) Tax on Gain (per Unit) Federal Ordinary Income Tax Rate Individual MLP Investor Deduction Rate Adjusted Ordinary Tax Rate ACA Tax Federal Tax Rate Federal Capital Gains Tax Rate Effective State Tax Rate(3) Tax on Gain (per Unit) Federal Ordinary Income Tax Rate Individual MLP Investor Deduction Rate Adjusted Ordinary Tax Rate ACA Tax Federal Tax Rate Federal Capital Gains Tax Rate Effective State Tax Rate(3) 37.0% 20.0% 29.6% 3.8% 33.4% 23.8% 5.2% 37.0% 20.0% 29.6% 3.8% 33.4% 23.8% 5.2% 37.0% 20.0% 29.6% 3.8% 33.4% 23.8% 5.2% PAL Rate PAL Gain Deduction 37.0% ($0.40) PAL Rate PAL Gain Deduction 37.0% ($0.54) PAL Rate PAL Gain Deduction 37.0% ($0.74) Tax on Ordinary Gain Effective Ordinary Gain Tax Rate Tax on Capital Gain Effective Capital Gain Tax Rate State Tax Ordinary Income(4) Effective Ordinary Gain Tax Rate State Tax Capital Gain(4) Effective Capital Gains Tax Rate $0.72 21.5% $2.45 23.8% $0.17 5.2% $0.53 5.2% Tax on Ordinary Gain Effective Ordinary Gain Tax Rate Tax on Capital Gain Effective Capital Gain Tax Rate State Tax Ordinary Income(4) Effective Ordinary Gain Tax Rate State Tax Capital Gain(4) Effective Capital Gains Tax Rate $1.07 22.3% $2.76 23.8% $0.25 5.2% $0.60 5.2% Tax on Ordinary Gain Effective Ordinary Gain Tax Rate Tax on Capital Gain Effective Capital Gain Tax Rate State Tax Ordinary Income(4) Effective Ordinary Gain Tax Rate State Tax Capital Gain(4) Effective Capital Gains Tax Rate $1.45 22.1% $2.34 23.8% $0.34 5.2% $0.51 5.2% Total Payable Effective Tax Rate 28.4% Total Effective Tax Rate 28.5% Total Payable Effective Tax Rate 28.3% Source: FactSet as of 8/10/2018 and Wall Street research. (1) (2) (3) (4) Provided by management. Assumed passive activity loss and tax on ordinary gain for IPO investor utilizes company provided estimates based on a per unit basis range of $19.00-$22.00. Passive activity loss calculated to be $2.00 for an IPO investor. State tax rate determined by using a weighted average of 50 state income tax rates and median federal taxable income brackets for married and single filers. 33 Total Tax on Gain $4.65 Total Tax on Gain $4.68 Total Tax on Gain $3.88 Total Gain $16.41 Total Gain $16.41 Total Gain $13.64 Average EOY 2017 Tax Basis $20.51 Average EOY 2017 Tax Basis $20.51 Average EOY 2017 Tax Basis $23.27 IPO Investor - IPO Basis(1) For IPO Investor - Average Basis(1) Average Unitholder Average EOY 2017 Basis for Public Unitholders $23.27 Average EOY 2017 Basis for IPO Investors $20.51 Unitholder Active Units EOY 2017 Basis CONFIDENTIAL DRAFT SUBJECT TO CHANGE
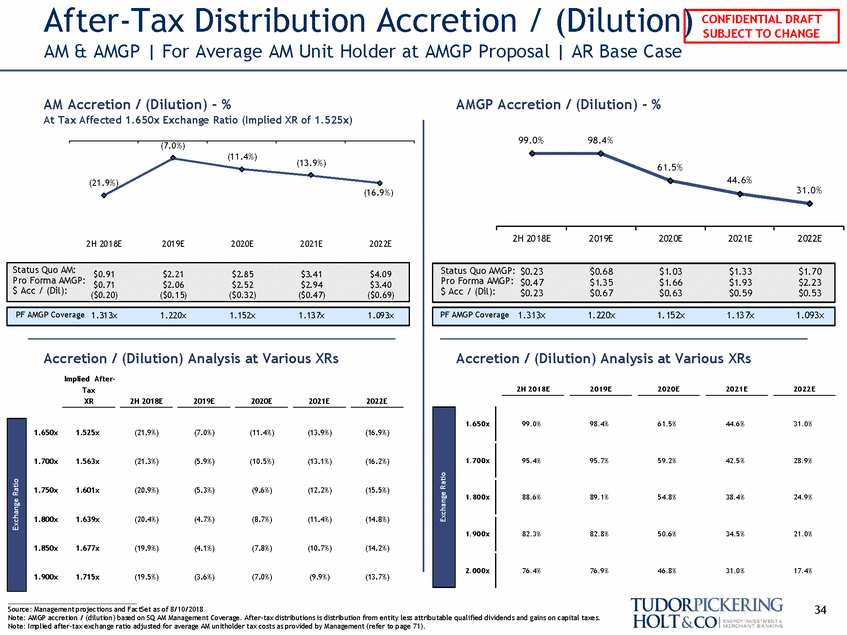
After-Tax Distribution Accretion / (Dilution) CONFIDENTIAL DRAFT AM & AMGP | For Average AM Unit Holder at AMGP Proposal | AR Base Case AM Accretion / (Dilution) - % At Tax Affected 1.650x Exchange Ratio (Implied XR of 1.525x) AMGP Accretion / (Dilution) - % 99.0% 98.4% (7.0%) (11.4%) (13.9%) 61.5% 44.6% (21.9%) 31.0% (16.9%) 2H 2018E 2019E 2020E 2021E 2022E 2H 2018E 2019E 2020E 2021E 2022E Pro Forma AMGP: $0.47 $1.35 $1.66 $1.93 $2.23 Accretion / (Dilution) Analysis at Various XRs Implied After-Tax Accretion / (Dilution) Analysis at Various XRs 2H 2018E 2019E 2020E 2021E 2022E XR 2H 2018E 2019E 2020E 2021E 2022E 1.650x 99.0% 98.4% 61.5% 44.6% 31.0% 1.650x 1.525x (21.9%) (7.0%) (11.4%) (13.9%) (16.9%) 1.700x 1.563x (21.3%) (5.9%) (10.5%) (13.1%) (16.2%) 1.700x 95.4% 95.7% 59.2% 42.5% 28.9% 1.750x 1.601x (20.9%) (5.3%) (9.6%) (12.2%) (15.5%) 1.800x 88.6% 89.1% 54.8% 38.4% 24.9% 1.800x 1.639x (20.4%) (4.7%) (8.7%) (11.4%) (14.8%) 1.900x 82.3% 82.8% 50.6% 34.5% 21.0% 1.850x 1.677x (19.9%) (4.1%) (7.8%) (10.7%) (14.2%) 2.000x 76.4% 76.9% 46.8% 31.0% 17.4% 1.900x 1.715x (19.5%) (3.6%) (7.0%) (9.9%) (13.7%) 34 Source: Management projections and FactSet as of 8/10/2018 Note: AMGP accretion / (dilution) based on SQ AM Management Coverage. After-tax distributions is distribution from entity less attributable qualified dividends and gains on capital taxes. Note: Implied after-tax exchange ratio adjusted for average AM unitholder tax costs as provided by Management (refer to page 71). Exchange Ratio Exchange Ratio PF AMGP Coverage 1.313x 1.220x 1.152x 1.137x 1.093x PF AMGP Coverage 1.313x 1.220x 1.152x 1.137x 1.093x Status Quo AMGP: $0.23 $0.68 $1.03 $1.33 $1.70 $ Acc / (Dil):$0.23 $0.67 $0.63 $0.59 $0.53 Status Quo AM:$0.91 $2.21 $2.85 $3.41 $4.09 Pro Forma AMGP: $0.71 $2.06 $2.52 $2.94 $3.40 $ Acc / (Dil):($0.20) ($0.15) ($0.32) ($0.47) ($0.69) SUBJECT TO CHANGE
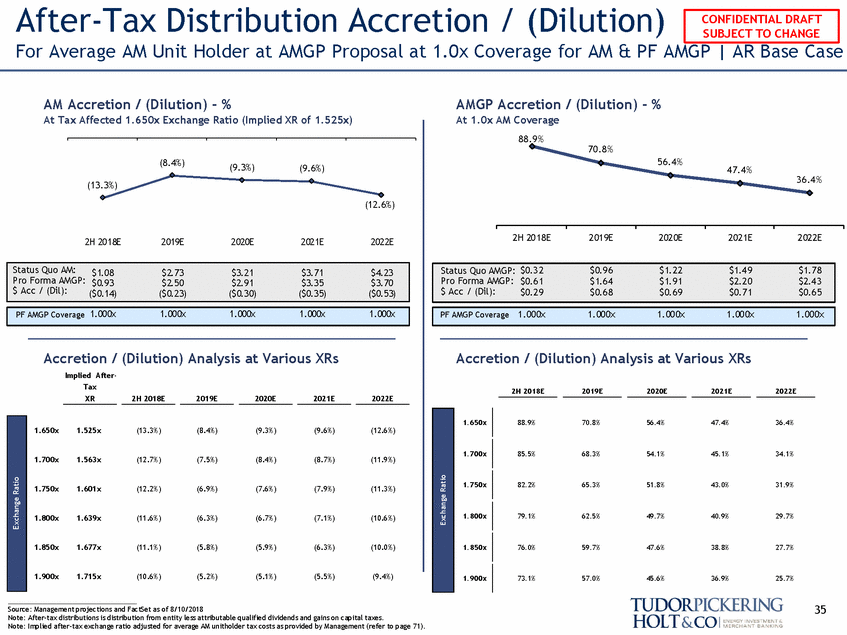
After-Tax Distribution Accretion / (Dilution) For Average AM Unit Holder at AMGP Proposal at 1.0x Coverage for AM & PF AMGP | AR Base Case AM Accretion / (Dilution) - % At Tax Affected 1.650x Exchange Ratio (Implied XR of 1.525x) AMGP Accretion / (Dilution) - % At 1.0x AM Coverage 88.9% 70.8% 56.4% (8.4%) (9.3%) (9.6%) 47.4% 36.4% (13.3%) (12.6%) 2H 2018E 2019E 2020E 2021E 2022E 2H 2018E 2019E 2020E 2021E 2022E Pro Forma AMGP: $0.61 $1.64 $1.91 $2.20 $2.43 Accretion / (Dilution) Analysis at Various XRs Implied After-Tax Accretion / (Dilution) Analysis at Various XRs 2H 2018E 2019E 2020E 2021E 2022E XR 2H 2018E 2019E 2020E 2021E 2022E 1.650x 88.9% 70.8% 56.4% 47.4% 36.4% 1.650x 1.525x (13.3%) (8.4%) (9.3%) (9.6%) (12.6%) 1.700x 85.5% 68.3% 54.1% 45.1% 34.1% 1.700x 1.563x (12.7%) (7.5%) (8.4%) (8.7%) (11.9%) 1.750x 82.2% 65.3% 51.8% 43.0% 31.9% 1.750x 1.601x (12.2%) (6.9%) (7.6%) (7.9%) (11.3%) 1.800x 79.1% 62.5% 49.7% 40.9% 29.7% 1.800x 1.639x (11.6%) (6.3%) (6.7%) (7.1%) (10.6%) 1.850x 1.677x (11.1%) (5.8%) (5.9%) (6.3%) (10.0%) 1.850x 76.0% 59.7% 47.6% 38.8% 27.7% 1.900x 1.715x (10.6%) (5.2%) (5.1%) (5.5%) (9.4%) 1.900x 73.1% 57.0% 45.6% 36.9% 25.7% 35 Source: Management projections and FactSet as of 8/10/2018 Note: After-tax distributions is distribution from entity less attributable qualified dividends and gains on capital taxes. Note: Implied after-tax exchange ratio adjusted for average AM unitholder tax costs as provided by Management (refer to page 71). Exchange Ratio Exchange Ratio PF AMGP Coverage 1.000x 1.000x 1.000x 1.000x 1.000x PF AMGP Coverage 1.000x 1.000x 1.000x 1.000x 1.000x Status Quo AMGP: $0.32 $0.96 $1.22 $1.49 $1.78 $ Acc / (Dil):$0.29 $0.68 $0.69 $0.71 $0.65 Status Quo AM:$1.08 $2.73 $3.21 $3.71 $4.23 Pro Forma AMGP: $0.93 $2.50 $2.91 $3.35 $3.70 $ Acc / (Dil):($0.14) ($0.23) ($0.30) ($0.35) ($0.53) CONFIDENTIAL DRAFT SUBJECT TO CHANGE
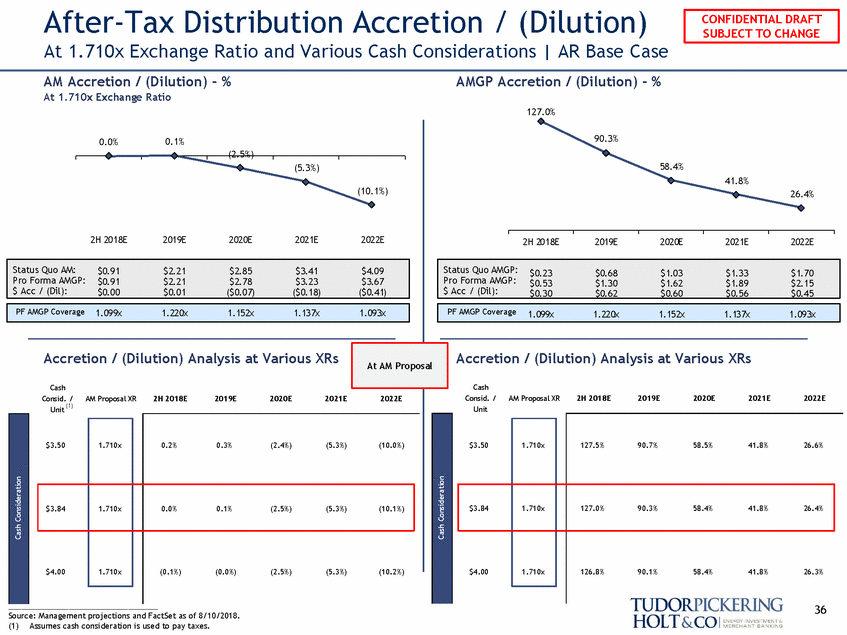
After-Tax Distribution Accretion / (Dilution) At 1.710x Exchange Ratio and Various Cash Considerations | AR Base Case AM Accretion / (Dilution) - % At 1.710x Exchange Ratio AMGP Accretion / (Dilution) - % 127.0% 90.3% 0.0% 0.1% (2.5%) 58.4% (5.3%) 41.8% 26.4% 2H 2018E 2019E 2020E 2021E 2H 2018E 2019E 2020E 2021E 2022E ro Forma AMGP: $0.53 $1.30 $1.62 $1.89 $2.15 Accretion / (Dilution) Analysis at Various XRs Accretion / (Dilution) Analysis at Various XRs Cash Consid. / Unit Cash Consid. / Unit (1) AM Proposal XR 2H 2018E 2019E 2020E 2021E AM Proposal XR 2H 2018E 2019E 2020E 2021E 2022E 36 Source: Management projections and FactSet as of 8/10/2018. (1) Assumes cash consideration is used to pay taxes. 0.2%0.3%(2.4%)(5.3%) $3.50 1.710x $3.84 1.710x 0.0%0.1%(2.5%)(5.3%) $4.00 1.710x (0.1%)(0.0%)(2.5%)(5.3%)(10.2%) Cash Consideration 127.5%90.7%58.5%41.8%26.6% $3.50 1.710x $3.84 1.710x 127.0%90.3%58.4%41.8%26.4% $4.00 1.710x 126.8%90.1%58.4%41.8%26.3% (10.1%) 2022E P At AM Proposal 2022E (10.0%) (10.1%) Cash Consideration PF AMGP Coverage 1.099x 1.220x 1.152x 1.137x 1.093x PF AMGP Coverage 1.099x1.220x1.152x1.137x1.093x Status Quo AMGP: $0.23 $0.68 $1.03 $1.33 $1.70 $ Acc / (Dil):$0.30 $0.62 $0.60 $0.56 $0.45 Status Quo AM:$0.91 $2.21 $2.85 $3.41 $4.09 Pro Forma AMGP: $0.91 $2.21 $2.78 $3.23 $3.67 $ Acc / (Dil):$0.00 $0.01 ($0.07) ($0.18) ($0.41) CONFIDENTIAL DRAFT SUBJECT TO CHANGE
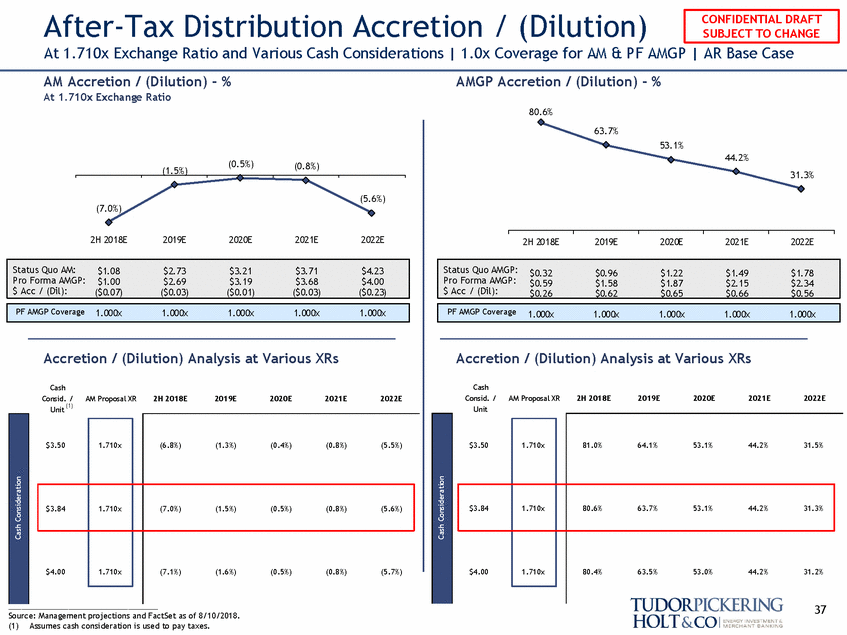
After-Tax Distribution Accretion / (Dilution) At 1.710x Exchange Ratio and Various Cash Considerations | 1.0x Coverage for AM & PF AMGP | AR Base Case AM Accretion / (Dilution) - % At 1.710x Exchange Ratio AMGP Accretion / (Dilution) - % 80.6% 63.7% 53.1% 44.2% (0.5%) (0.8%) (1.5%) 31.3% (5.6%) (7.0%) 2H 2018E 2019E 2020E 2021E 2022E 2H 2018E 2019E 2020E 2021E 2022E Pro Forma AMGP: $0.59 $1.58 $1.87 $2.15 $2.34 Accretion / (Dilution) Analysis at Various XRs Accretion / (Dilution) Analysis at Various XRs Cash Consid. / Unit Cash Consid. / Unit (1) AM Proposal XR 2H 2018E 2019E 2020E 2021E 2022E AM Proposal XR 2H 2018E 2019E 2020E 2021E 2022E 37 Source: Management projections and FactSet as of 8/10/2018. (1) Assumes cash consideration is used to pay taxes. (6.8%)(1.3%)(0.4%)(0.8%)(5.5%) $3.50 1.710x $3.84 1.710x (7.0%)(1.5%)(0.5%)(0.8%)(5.6%) $4.00 1.710x (7.1%)(1.6%)(0.5%)(0.8%)(5.7%) Cash Consideration 81.0%64.1%53.1%44.2%31.5% $3.50 1.710x $3.84 1.710x 80.6%63.7%53.1%44.2%31.3% $4.00 1.710x 80.4%63.5%53.0%44.2%31.2% Cash Consideration PF AMGP Coverage 1.000x 1.000x 1.000x 1.000x 1.000x PF AMGP Coverage 1.000x1.000x1.000x1.000x1.000x Status Quo AMGP: $0.32 $0.96 $1.22 $1.49 $1.78 $ Acc / (Dil):$0.26 $0.62 $0.65 $0.66 $0.56 Status Quo AM:$1.08 $2.73 $3.21 $3.71 $4.23 Pro Forma AMGP: $1.00 $2.69 $3.19 $3.68 $4.00 $ Acc / (Dil):($0.07) ($0.03) ($0.01) ($0.03) ($0.23) CONFIDENTIAL DRAFT SUBJECT TO CHANGE
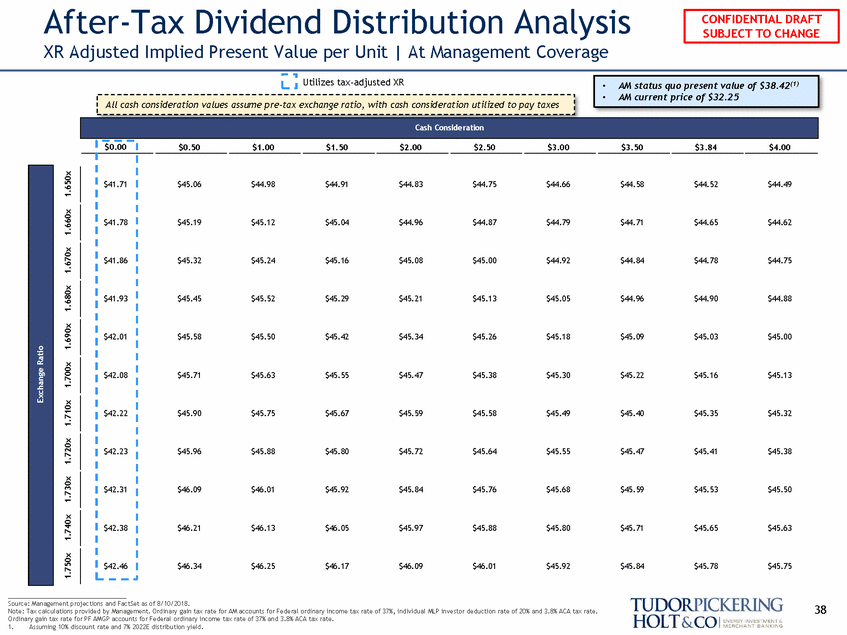
After-Tax Dividend Distribution Analysis XR Adjusted Implied Present Value per Unit | At Management Coverage Utilizes tax-adjusted XR Source: Management projections and FactSet as of 8/10/2018. Note: Tax calculations provided by Management. Ordinary gain tax rate for AM accounts for Federal ordinary income tax rate of 37%, individual MLP investor deduction rate of 20% and 3.8% ACA tax rate. Ordinary gain tax rate for PF AMGP accounts for Federal ordinary income tax rate of 37% and 3.8% ACA tax rate. 38 1. Assuming 10% discount rate and 7% 2022E distribution yield. 1.750x 1.740x 1.730x 1.720x 1.710x 1.700x 1.690x 1.680x 1.670x 1.660x 1.650x Exchange Ratio All cash consideration values assume pre-tax exchange ratio, with cash consideration utilized to pay taxes Cash Consideration $0.00 $0.50 $1.00 $1.50 $2.00 $2.50 $3.00 $3.50 $3.84 $4.00 $41.71 $41.78 $41.86 $41.93 $42.01 $42.08 $42.22 $42.23 $42.31 $42.38 $42.46 $45.06 $44.98 $44.91 $44.83 $44.75 $44.66 $44.58 $44.52 $44.49 $45.19 $45.12 $45.04 $44.96 $44.87 $44.79 $44.71 $44.65 $44.62 $45.32 $45.24 $45.16 $45.08 $45.00 $44.92 $44.84 $44.78 $44.75 $45.45 $45.52 $45.29 $45.21 $45.13 $45.05 $44.96 $44.90 $44.88 $45.58 $45.50 $45.42 $45.34 $45.26 $45.18 $45.09 $45.03 $45.00 $45.71 $45.63 $45.55 $45.47 $45.38 $45.30 $45.22 $45.16 $45.13 $45.90 $45.75 $45.67 $45.59 $45.58 $45.49 $45.40 $45.35 $45.32 $45.96 $45.88 $45.80 $45.72 $45.64 $45.55 $45.47 $45.41 $45.38 $46.09 $46.01 $45.92 $45.84 $45.76 $45.68 $45.59 $45.53 $45.50 $46.21 $46.13 $46.05 $45.97 $45.88 $45.80 $45.71 $45.65 $45.63 $46.34 $46.25 $46.17 $46.09 $46.01 $45.92 $45.84 $45.78 $45.75 •AM status quo present value of $38.42(1) •AM current price of $32.25 CONFIDENTIAL DRAFT SUBJECT TO CHANGE
IV. Leverage 39 CONFIDENTIAL DRAFT SUBJECT TO CHANGE
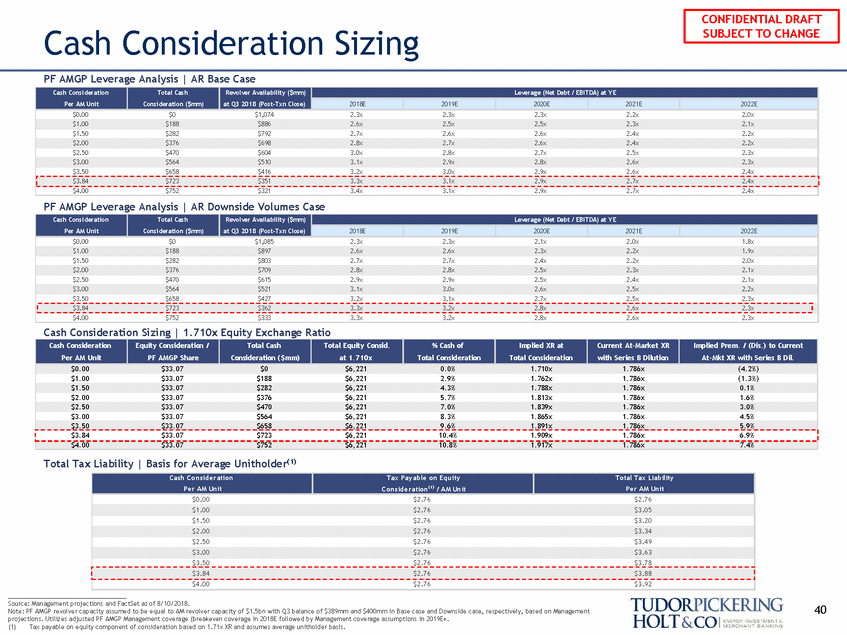
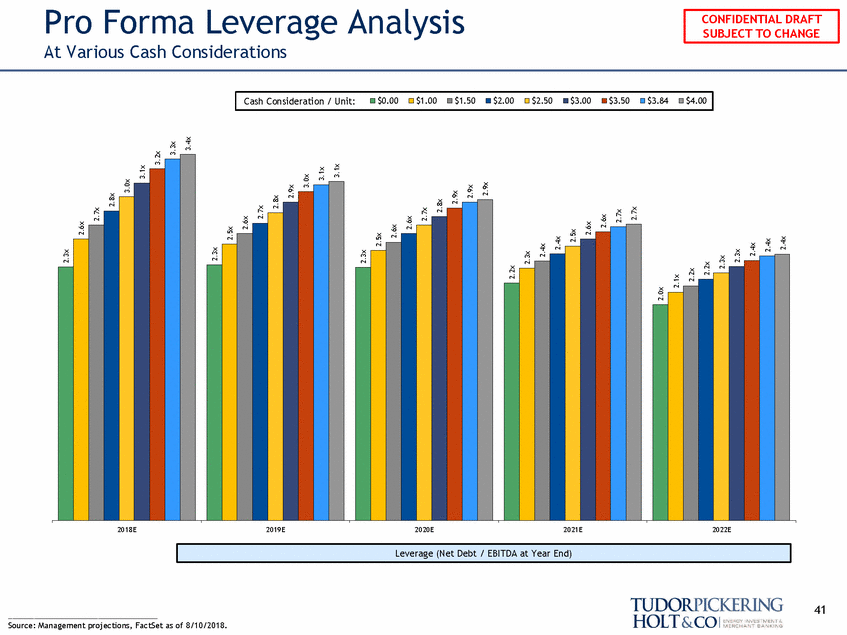
Cash Consideration Sizing PF AMGP Leverage Analysis | AR Base Case PF AMGP Leverage Analysis | AR Downside Volumes Case Cash Consideration Sizing | 1.710x Equity Exchange Ratio Total Tax Liability | Basis for Average Unitholder(1) Source: Management projections and FactSet as of 8/10/2018. Note: PF AMGP revolver capacity assumed to be equal to AM revolver capacity of $1.5bn with Q3 balance of $389mm and $400mm in Base case and Downside case, respectively, based on Management projections. Utilizes adjusted PF AMGP Management coverage (breakeven coverage in 2018E followed by Management coverage assumptions in 2019E+. (1)Tax payable on equity component of consideration based on 1.71x XR and assumes average unitholder basis. 40 Cash Consideration Per A M Unit Tax Pay able on Equity Consideration(1) / A M Unit Total Tax Liability Per A M Unit $0.00 $2.76 $2.76 $1.00 $2.76 $3.05 $1.50 $2.76 $3.20 $2.00 $2.76 $3.34 $2.50 $2.76 $3.49 $3.00 $2.76 $3.63 $3.50 $2.76 $3.78 $3.84 $2.76 $3.88 $4.00 $2.76 $3.92 Cash Consideration Per AM Unit Equity Consideration / PF AMGP Share Total Cash Consideration ($mm) Total Equity Consid. at 1.710x % Cash of Total Consideration Implied XR at Total Consideration Current At-Market XR with Series B Dilution Implied Prem. / (Dis.) to Current At-Mkt XR with Series B Dil. $0.00 $33.07 $0 $6,221 0.0% 1.710x 1.786x (4.2%) $1.00 $33.07 $188 $6,221 2.9% 1.762x 1.786x (1.3%) $1.50 $33.07 $282 $6,221 4.3% 1.788x 1.786x 0.1% $2.00 $33.07 $376 $6,221 5.7% 1.813x 1.786x 1.6% $2.50 $33.07 $470 $6,221 7.0% 1.839x 1.786x 3.0% $3.00 $33.07 $564 $6,221 8.3% 1.865x 1.786x 4.5% $3.50 $33.07 $658 $6,221 9.6% 1.891x 1.786x 5.9% $3.84 $33.07 $723 $6,221 10.4% 1.909x 1.786x 6.9% $4.00 $33.07 $752 $6,221 10.8% 1.917x 1.786x 7.4% Cash Consideration Total Cash Revolver Availability ($mm) Leverage (Net Debt / EBITDA) at Y E Per AM Unit Consideration ($mm) at Q3 2018 (Post-Txn Close) 2018E 2019E 2020E 2021E 2022E $0.00 $0 $1,085 2.3x 2.3x 2.1x 2.0x 1.8x $1.00 $188 $897 2.6x 2.6x 2.3x 2.2x 1.9x $1.50 $282 $803 2.7x 2.7x 2.4x 2.2x 2.0x $2.00 $376 $709 2.8x 2.8x 2.5x 2.3x 2.1x $2.50 $470 $615 2.9x 2.9x 2.5x 2.4x 2.1x $3.00 $564 $521 3.1x 3.0x 2.6x 2.5x 2.2x $3.50 $658 $427 3.2x 3.1x 2.7x 2.5x 2.3x $3.84 $723 $362 3.3x 3.2x 2.8x 2.6x 2.3x $4.00 $752 $333 3.3x 3.2x 2.8x 2.6x 2.3x Cash Consideration Total Cash Revolver Availability ($mm) Leverage (Net Debt / EBITDA) at Y E Per AM Unit Consideration ($mm) at Q3 2018 (Post-Txn Close) 2018E 2019E 2020E 2021E 2022E $0.00 $0 $1,074 2.3x 2.3x 2.3x 2.2x 2.0x $1.00 $188 $886 2.6x 2.5x 2.5x 2.3x 2.1x $1.50 $282 $792 2.7x 2.6x 2.6x 2.4x 2.2x $2.00 $376 $698 2.8x 2.7x 2.6x 2.4x 2.2x $2.50 $470 $604 3.0x 2.8x 2.7x 2.5x 2.3x $3.00 $564 $510 3.1x 2.9x 2.8x 2.6x 2.3x $3.50 $658 $416 3.2x 3.0x 2.9x 2.6x 2.4x $3.84 $723 $351 3.3x 3.1x 2.9x 2.7x 2.4x $4.00 $752 $321 3.4x 3.1x 2.9x 2.7x 2.4x CONFIDENTIAL DRAFT SUBJECT TO CHANGE
Pro Forma Leverage At Various Cash Considerations Analysis 2018E 2019E 2020E 2021E 2022E 41 Source: Management projections, FactSet as of 8/10/2018. 2.3x 2.6x 2.7x 2.8x 3.0x 3.1x 3.2x 3.3x 3.4x 2.3x 2.5x 2.6x 2.7x 2.8x 2.9x 3.0x 3.1x 3.1x 2.3x 2.5x 2.6x 2.6x 2.7x 2.8x 2.9x 2.9x 2.9x 2.2x 2.3x 2.4x 2.4x 2.5x 2.6x 2.6x 2.7x 2.7x 2.0x 2.1x 2.2x 2.2x 2.3x 2.3x 2.4x 2.4x 2.4x Leverage (Net Debt / EBITDA at Year End) Cash Consideration / Unit:$0.00$1.00$1.50$2.00$2.50$3.00$3.50$3.84$4.00 CONFIDENTIAL DRAFT SUBJECT TO CHANGE
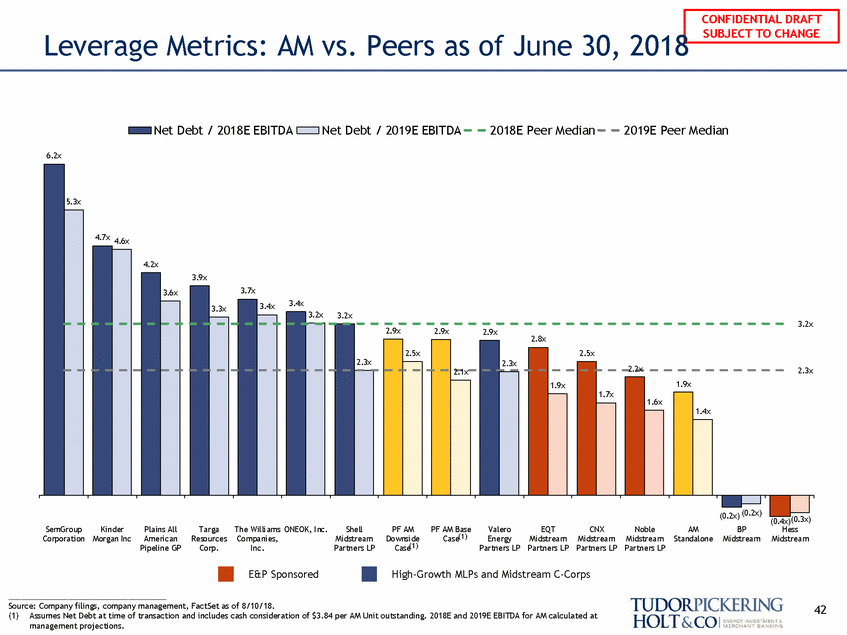
Leverage Metrics: AM vs. Peers as of June 30, 2018 Net Debt / 2018E EBITDA Net Debt / 2019E EBITDA 2018E Peer Median 2019E Peer Median 6.2x 3.4x 2.8x 2.2x (0.3x) (0.4x) SemGroup Corporation Kinder Plains All Morgan Inc American Pipeline GP Targa Resources Corp. The Williams ONEOK, Inc. Companies, Inc. Shell Midstream Partners LP PF AM PF AM Base Valero Energy Partners LP EQ T Midstream Partners LP CNX Midstream Partners LP Noble Midstream Partners LP AM Standalone BP Hess Case(1) Downside Case(1) Midstream Midstream E&P Sponsored High-Growth MLPs and Midstream C-Corps Source: Company filings, company management, FactSet as of 8/10/18. (1) Assumes Net Debt at time of transaction and includes cash consideration of $3.84 per AM Unit outstanding. 2018E and 2019E EBITDA for AM calculated at management projections. 42 5.3x 3.2x 2.3x 4.7x 4.6x 4.2x 3.9x 3.6x 3.7x 3.3x 3.4x 3.2x 3.2x 2.9x 2.9x 2.9x 2.3x 2.5x 2.3x 2.5x 2.1x 1.9x 1.7x 1.9x 1.6x 1.4x (0.2x) (0.2x) CONFIDENTIAL DRAFT SUBJECT TO CHANGE
V. Research Perspective 43 CONFIDENTIAL DRAFT SUBJECT TO CHANGE
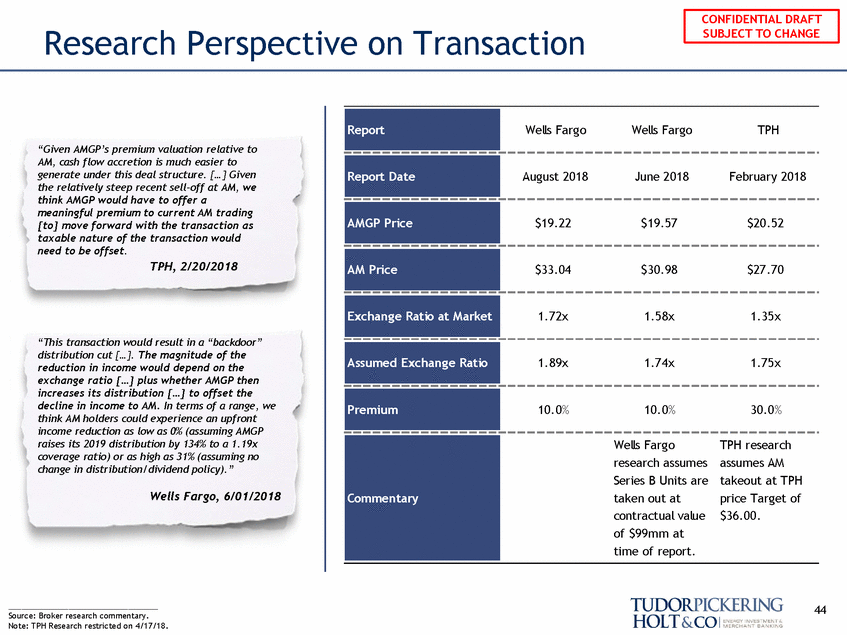
Research Perspective on Transaction “Given AMGP’s premium valuation relative to AM, cash flow accretion is much easier to generate under this deal structure. […] Given the relatively steep recent sell-off at AM, we think AMGP would have to offer a meaningful premium to current AM trading [to] move forward with the transaction as taxable nature of the transaction would need to be offset. TPH, 2/20/2018 August 2018 June 2018 February 2018 $19.22 $19.57 $20.52 $33.04 $30.98 $27.70 1.72x 1.58x 1.35x “This transaction would result in a “backdoor” distribution cut […]. The magnitude of the reduction in income would depend on the exchange ratio […] plus whether AMGP then increases its distribution […] to offset the decline in income to AM. In terms of a range, we think AM holders could experience an upfront income reduction as low as 0% (assuming AMGP raises its 2019 distribution by 134% to a 1.19x coverage ratio) or as high as 31% (assuming no change in distribution/dividend policy).” 1.89x 1.74x 1.75x 10.0% 10.0% 30.0% Wells Fargo, 6/01/2018 44 Source: Broker research commentary. Note: TPH Research restricted on 4/17/18. Commentary Wells Fargo TPH research research assumes assumes AM Series B Units are takeout at TPH taken out at price Target of contractual value $36.00. of $99mm at time of report. Premium Assumed Exchange Ratio Exchange Ratio at Market AM Price AMGP Price Report Date Report Wells Fargo Wells Fargo TPH CONFIDENTIAL DRAFT SUBJECT TO CHANGE
Disclosure Statement Tudor, Pickering, Holt & Co. does not provide accounting, tax or legal advice. In addition, we mutually agree that, subject to applicable law, you (and your employees, representatives and other agents) may disclose any aspects of any potential transaction or structure described herein that are necessary to support any U.S. federal income tax benefits, and all materials of any kind (including tax opinions and other tax analyses) related to those benefits, with no limitations imposed by Tudor, Pickering, Holt & Co. About The Firm Tudor, Pickering, Holt & Co. is an integrated energy investment and merchant bank, providing high quality advice and services to institutional and corporate clients. Through the company’s two broker-dealer units, Tudor, Pickering, Holt & Co. Securities, Inc. (TPHCSI) and Tudor Pickering Holt & Co Advisors LP (TPHCA), members FINRA, the company offers securities and investment banking services to the energy community. TPH Asset Management LP (TPHAM) is an SEC registered investment adviser that delivers a suite of energy investment strategies. TPH Partners Group LP is a relying advisor of TPHAM. Certain employees of TPHAM are also employees of TPHCSI. The information contained herein is confidential (except for information relating to United States tax issues) and may not be reproduced in whole or in part. Tudor, Pickering, Holt & Co. assumes no responsibility for independent verification of third-party information and has relied on such information being complete and accurate in all material respects. To the extent such information includes estimates and forecasts of future financial performance (including estimates of potential cost savings and synergies) prepared by, reviewed or discussed with the managements of your company and/ or other potential transaction participants or obtained from public sources, we have assumed that such estimates and forecasts have been reasonably prepared on bases reflecting the best currently available estimates and judgments of such managements (or, with respect to estimates and forecasts obtained from public sources, represent reasonable estimates). These materials were designed for use by specific persons familiar with the business and the affairs of your company and Tudor, Pickering, Holt & Co. materials. The firm, headquartered in Houston, Texas, has approximately 170 employees and offices in Calgary, Canada; Denver, Colorado; and New York, New York. Its affiliate, Tudor, Pickering Holt & Co. International, LLP, is located in London, England. Its Canadian affiliate, Tudor Pickering Holt & Co Securities – Canada LP, is located in Calgary, Alberta. Contact Us Houston (Research, Sales and Trading): 713-333-2960 Houston (Investment Banking): 713-333-7100 Houston (Asset Management): 713-337-3999 Denver (Sales): 303-300-1900 Denver (Investment Banking): 303-300-1900 New York (Investment Banking): 212-610-1660 New York (Research, Sales): 212-610-1600 London: +011 44(0) 20 3008 6428 Calgary: 403-705-7830 Under no circumstances is this presentation to be used or considered as an offer to sell or a solicitation of any offer to buy, any security. Prior to making any trade, you should discuss with your professional tax, accounting, or regulatory advisers how such particular trade(s) affect you. This brief statement does not disclose all of the risks and other significant aspects of entering into any particular transaction. Tudor, Pickering, Holt & Co. International, LLP is authorized and regulated by the Financial Conduct Authority and is the United Kingdom affiliate of www.TPHco.com Tudor, Pickering, Holt & Co. Copyright 2018 — Tudor, Pickering, Holt & Co. 45 CONFIDENTIAL DRAFT SUBJECT TO CHANGE
