Project Alpine VWAP Exchange Ratio Analysis August 31, 2018 CONFIDENTIAL DRAFT SUBJECT TO CHANGE
Project Alpine VWAP Exchange Ratio Analysis August 31, 2018 CONFIDENTIAL DRAFT SUBJECT TO CHANGE

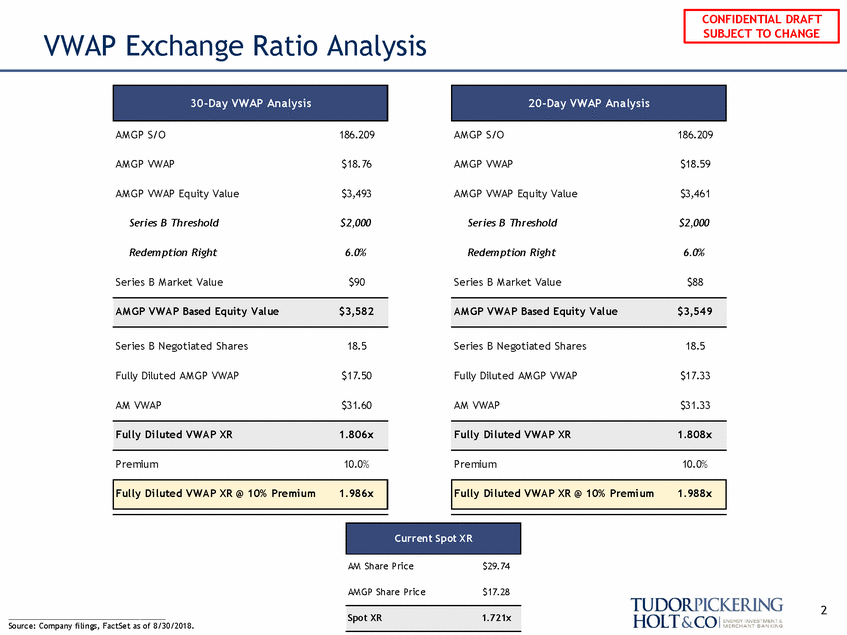
VWAP Exchange Ratio Analysis AM GP S/O 186.209 AM GP S/O 186.209 AM GP VWAP $18.76 AM GP VWAP $18.59 AM GP VWAP Equity Value $3,493 AM GP VWAP Equity Value $3,461 Series B Threshold $2,000 Series B Threshold $2,000 Redem ption Right 6.0% Redem ption Right 6.0% Series B M arket Value $90 Series B M arket Value $88 Series B Negotiated Shares 18.5 Series B Negotiated Shares 18.5 Fully Diluted AM GP VWAP $17.50 Fully Diluted AM GP VWAP $17.33 AM VWAP $31.60 AM VWAP $31.33 Premium 10.0% Premium 10.0% AM Share Pric e $29.74 AM GP Share Pric e $17.28 2 Spot XR 1.721x Source: Company filings, FactSet as of 8/30/2018. Current Spot X R Fully Diluted VWAP XR @ 10% Premium 1.988x Fully Diluted VWAP XR @ 10% Premium 1.986x Fully Diluted VWAP XR 1.808x Fully Diluted VWAP XR 1.806x AM GP VWAP Based Equity Value $3,549 AM GP VWAP Based Equity Value $3,582 20-Day VWAP Analysis 30-Day VWAP Analysis CONFIDENTIAL DRAFT SUBJECT TO CHANGE
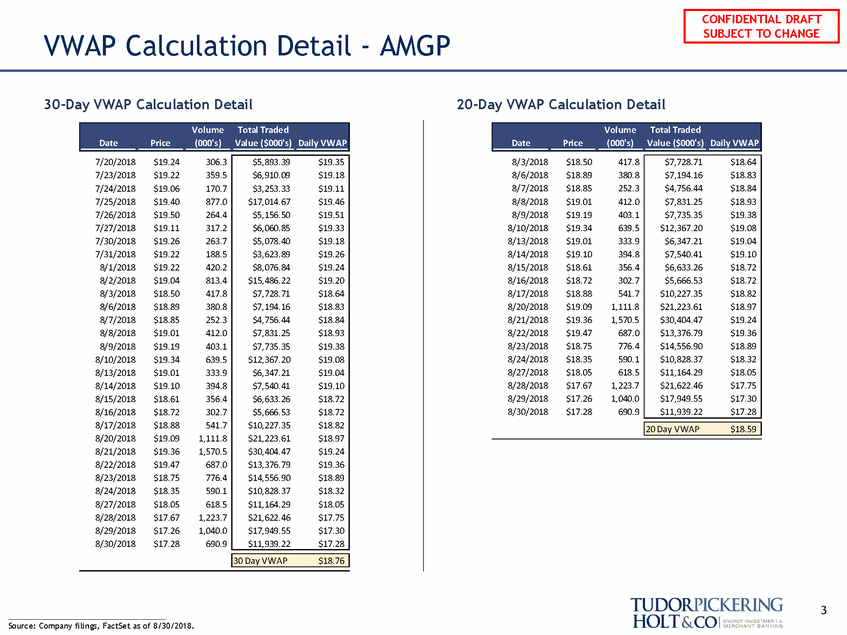
VWAP Calculation Detail - AMGP 30-Day VWAP Calculation Detail 20-Day VWAP Calculation Detail 3 Source: Company filings, FactSet as of 8/30/2018. Volume Total Traded Date Price (000's) Value ($000's) Daily VWAP 8/3/2018 $18.50 417.8 8/6/2018 $18.89 380.8 8/7/2018 $18.85 252.3 8/8/2018 $19.01 412.0 8/9/2018 $19.19 403.1 8/10/2018 $19.34 639.5 8/13/2018 $19.01 333.9 8/14/2018 $19.10 394.8 8/15/2018 $18.61 356.4 8/16/2018 $18.72 302.7 8/17/2018 $18.88 541.7 8/20/2018 $19.09 1,111.8 8/21/2018 $19.36 1,570.5 8/22/2018 $19.47 687.0 8/23/2018 $18.75 776.4 8/24/2018 $18.35 590.1 8/27/2018 $18.05 618.5 8/28/2018 $17.67 1,223.7 8/29/2018 $17.26 1,040.0 8/30/2018 $17.28 690.9 $7,728.71 $18.64 $7,194.16 $18.83 $4,756.44 $18.84 $7,831.25 $18.93 $7,735.35 $19.38 $12,367.20 $19.08 $6,347.21 $19.04 $7,540.41 $19.10 $6,633.26 $18.72 $5,666.53 $18.72 $10,227.35 $18.82 $21,223.61 $18.97 $30,404.47 $19.24 $13,376.79 $19.36 $14,556.90 $18.89 $10,828.37 $18.32 $11,164.29 $18.05 $21,622.46 $17.75 $17,949.55 $17.30 $11,939.22 $17.28 20 Day VWAP $18.59 Volume Total Traded Date Price (000's) Value ($000's) Daily VWAP 7/20/2018 $19.24 306.3 7/23/2018 $19.22 359.5 7/24/2018 $19.06 170.7 7/25/2018 $19.40 877.0 7/26/2018 $19.50 264.4 7/27/2018 $19.11 317.2 7/30/2018 $19.26 263.7 7/31/2018 $19.22 188.5 8/1/2018 $19.22 420.2 8/2/2018 $19.04 813.4 8/3/2018 $18.50 417.8 8/6/2018 $18.89 380.8 8/7/2018 $18.85 252.3 8/8/2018 $19.01 412.0 8/9/2018 $19.19 403.1 8/10/2018 $19.34 639.5 8/13/2018 $19.01 333.9 8/14/2018 $19.10 394.8 8/15/2018 $18.61 356.4 8/16/2018 $18.72 302.7 8/17/2018 $18.88 541.7 8/20/2018 $19.09 1,111.8 8/21/2018 $19.36 1,570.5 8/22/2018 $19.47 687.0 8/23/2018 $18.75 776.4 8/24/2018 $18.35 590.1 8/27/2018 $18.05 618.5 8/28/2018 $17.67 1,223.7 8/29/2018 $17.26 1,040.0 8/30/2018 $17.28 690.9 $5,893.39 $19.35 $6,910.09 $19.18 $3,253.33 $19.11 $17,014.67 $19.46 $5,156.50 $19.51 $6,060.85 $19.33 $5,078.40 $19.18 $3,623.89 $19.26 $8,076.84 $19.24 $15,486.22 $19.20 $7,728.71 $18.64 $7,194.16 $18.83 $4,756.44 $18.84 $7,831.25 $18.93 $7,735.35 $19.38 $12,367.20 $19.08 $6,347.21 $19.04 $7,540.41 $19.10 $6,633.26 $18.72 $5,666.53 $18.72 $10,227.35 $18.82 $21,223.61 $18.97 $30,404.47 $19.24 $13,376.79 $19.36 $14,556.90 $18.89 $10,828.37 $18.32 $11,164.29 $18.05 $21,622.46 $17.75 $17,949.55 $17.30 $11,939.22 $17.28 30 Day VWAP $18.76 CONFIDENTIAL DRAFT SUBJECT TO CHANGE
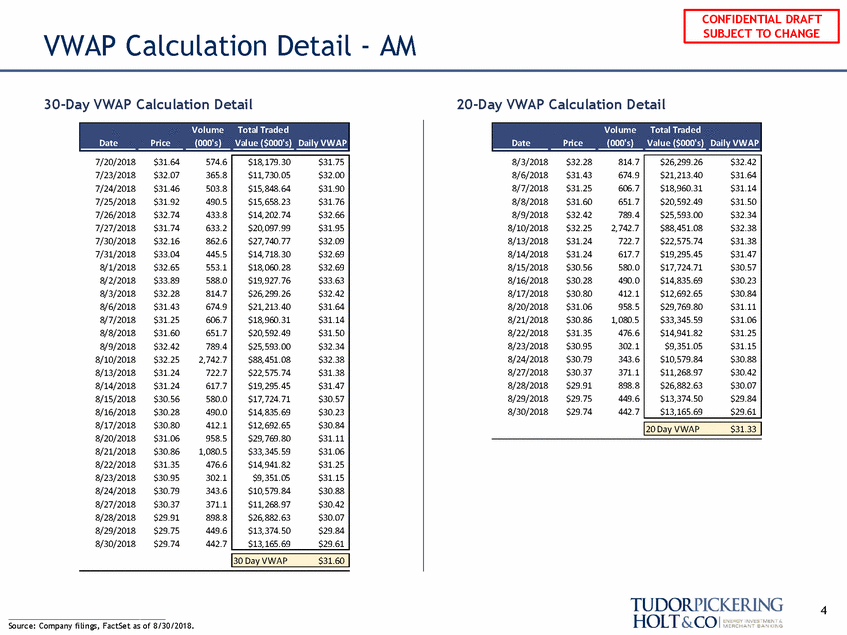
VWAP Calculation Detail - AM 30-Day VWAP Calculation Detail 20-Day VWAP Calculation Detail 4 Source: Company filings, FactSet as of 8/30/2018. Volume Total Traded Date Price (000's) Value ($000's) Daily VWAP 8/3/2018 $32.28 814.7 8/6/2018 $31.43 674.9 8/7/2018 $31.25 606.7 8/8/2018 $31.60 651.7 8/9/2018 $32.42 789.4 8/10/2018 $32.25 2,742.7 8/13/2018 $31.24 722.7 8/14/2018 $31.24 617.7 8/15/2018 $30.56 580.0 8/16/2018 $30.28 490.0 8/17/2018 $30.80 412.1 8/20/2018 $31.06 958.5 8/21/2018 $30.86 1,080.5 8/22/2018 $31.35 476.6 8/23/2018 $30.95 302.1 8/24/2018 $30.79 343.6 8/27/2018 $30.37 371.1 8/28/2018 $29.91 898.8 8/29/2018 $29.75 449.6 8/30/2018 $29.74 442.7 $26,299.26 $32.42 $21,213.40 $31.64 $18,960.31 $31.14 $20,592.49 $31.50 $25,593.00 $32.34 $88,451.08 $32.38 $22,575.74 $31.38 $19,295.45 $31.47 $17,724.71 $30.57 $14,835.69 $30.23 $12,692.65 $30.84 $29,769.80 $31.11 $33,345.59 $31.06 $14,941.82 $31.25 $9,351.05 $31.15 $10,579.84 $30.88 $11,268.97 $30.42 $26,882.63 $30.07 $13,374.50 $29.84 $13,165.69 $29.61 20 Day VWAP $31.33 Volume Total Traded Date Price (000's) Value ($000's) Daily VWAP 7/20/2018 $31.64 574.6 7/23/2018 $32.07 365.8 7/24/2018 $31.46 503.8 7/25/2018 $31.92 490.5 7/26/2018 $32.74 433.8 7/27/2018 $31.74 633.2 7/30/2018 $32.16 862.6 7/31/2018 $33.04 445.5 8/1/2018 $32.65 553.1 8/2/2018 $33.89 588.0 8/3/2018 $32.28 814.7 8/6/2018 $31.43 674.9 8/7/2018 $31.25 606.7 8/8/2018 $31.60 651.7 8/9/2018 $32.42 789.4 8/10/2018 $32.25 2,742.7 8/13/2018 $31.24 722.7 8/14/2018 $31.24 617.7 8/15/2018 $30.56 580.0 8/16/2018 $30.28 490.0 8/17/2018 $30.80 412.1 8/20/2018 $31.06 958.5 8/21/2018 $30.86 1,080.5 8/22/2018 $31.35 476.6 8/23/2018 $30.95 302.1 8/24/2018 $30.79 343.6 8/27/2018 $30.37 371.1 8/28/2018 $29.91 898.8 8/29/2018 $29.75 449.6 8/30/2018 $29.74 442.7 $18,179.30 $31.75 $11,730.05 $32.00 $15,848.64 $31.90 $15,658.23 $31.76 $14,202.74 $32.66 $20,097.99 $31.95 $27,740.77 $32.09 $14,718.30 $32.69 $18,060.28 $32.69 $19,927.76 $33.63 $26,299.26 $32.42 $21,213.40 $31.64 $18,960.31 $31.14 $20,592.49 $31.50 $25,593.00 $32.34 $88,451.08 $32.38 $22,575.74 $31.38 $19,295.45 $31.47 $17,724.71 $30.57 $14,835.69 $30.23 $12,692.65 $30.84 $29,769.80 $31.11 $33,345.59 $31.06 $14,941.82 $31.25 $9,351.05 $31.15 $10,579.84 $30.88 $11,268.97 $30.42 $26,882.63 $30.07 $13,374.50 $29.84 $13,165.69 $29.61 30 Day VWAP $31.60 CONFIDENTIAL DRAFT SUBJECT TO CHANGE
Disclosure Statement Tudor, Pickering, Holt & Co. does not provide accounting, tax or legal advice. In addition, we mutually agree that, subject to applicable law, you (and your employees, representatives and other agents) may disclose any aspects of any potential transaction or structure described herein that are necessary to support any U.S. federal income tax benefits, and all materials of any kind (including tax opinions and other tax analyses) related to those benefits, with no limitations imposed by Tudor, Pickering, Holt & Co. About The Firm Tudor, Pickering, Holt & Co. is an integrated energy investment and merchant bank, providing high quality advice and services to institutional and corporate clients. Through the company’s two broker-dealer units, Tudor, Pickering, Holt & Co. Securities, Inc. (TPHCSI) and Tudor Pickering Holt & Co Advisors LP (TPHCA), members FINRA, the company offers securities and investment banking services to the energy community. TPH Asset Management LP (TPHAM) is an SEC registered investment adviser that delivers a suite of energy investment strategies. TPH Partners Group LP is a relying advisor of TPHAM. Certain employees of TPHAM are also employees of TPHCSI. The information contained herein is confidential (except for information relating to United States tax issues) and may not be reproduced in whole or in part. Tudor, Pickering, Holt & Co. assumes no responsibility for independent verification of third-party information and has relied on such information being complete and accurate in all material respects. To the extent such information includes estimates and forecasts of future financial performance (including estimates of potential cost savings and synergies) prepared by, reviewed or discussed with the managements of your company and/ or other potential transaction participants or obtained from public sources, we have assumed that such estimates and forecasts have been reasonably prepared on bases reflecting the best currently available estimates and judgments of such managements (or, with respect to estimates and forecasts obtained from public sources, represent reasonable estimates). These materials were designed for use by specific persons familiar with the business and the affairs of your company and Tudor, Pickering, Holt & Co. materials. The firm, headquartered in Houston, Texas, has approximately 170 employees and offices in Calgary, Canada; Denver, Colorado; and New York, New York. Its affiliate, Tudor, Pickering Holt & Co. International, LLP, is located in London, England. Its Canadian affiliate, Tudor Pickering Holt & Co Securities – Canada LP, is located in Calgary, Alberta. Contact Us Houston (Research, Sales and Trading): 713-333-2960 Houston (Investment Banking): 713-333-7100 Houston (Asset Management): 713-337-3999 Denver (Sales): 303-300-1900 Denver (Investment Banking): 303-300-1900 New York (Investment Banking): 212-610-1660 New York (Research, Sales): 212-610-1600 London: +011 44(0) 20 3008 6428 Calgary: 403-705-7830 Under no circumstances is this presentation to be used or considered as an offer to sell or a solicitation of any offer to buy, any security. Prior to making any trade, you should discuss with your professional tax, accounting, or regulatory advisers how such particular trade(s) affect you. This brief statement does not disclose all of the risks and other significant aspects of entering into any particular transaction. Tudor, Pickering, Holt & Co. International, LLP is authorized and regulated by the Financial Conduct Authority and is the United Kingdom affiliate of www.TPHco.com Tudor, Pickering, Holt & Co. Copyright 2018 — Tudor, Pickering, Holt & Co. 5 CONFIDENTIAL DRAFT SUBJECT TO CHANGE
