Preliminary and Confidential – Subject to Further Review and Revision Citigroup Global Markets Inc. | Global Energy Group September 2018 Discussion Project Francis Materials
Preliminary and Confidential – Subject to Further Review and Revision Citigroup Global Markets Inc. | Global Energy Group September 2018 Discussion Project Francis Materials

Preliminary and Confidential – Subject to Further Review and Revision Table of Contents 1. Preliminary Valuation Analysis 2 A. Preliminary Series B Financial Analysis 8 2. Preliminary Pro Forma Impacts 12 A. AMGP Acquires AM 13 B. AM Acquires AMGP 19 C. AM GP / IDR Buy-In 21 D. AR Buys AMGP 24 Appendix 25 A. Preliminary AM Financial Analysis 34 B. Preliminary AMGP Financial Analysis 38 Has / Gets Supporting Materials 41
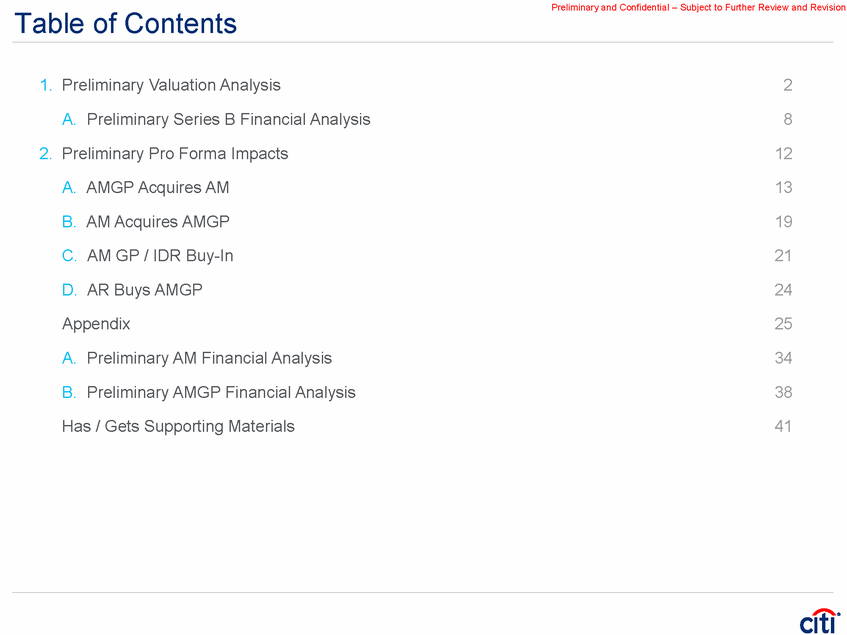
Preliminary and Confidential – Subject to Further Review and Revision Goals Various Alternatives Based on Shared AMGP Buys AM AM Buys IDRs AM Buys AMGP AR Buys AMGP 1 Removes Current Overhang PP PPPP Simplifies Structure PP X PP PP Improves Cost of Capital PP PP P X Increases Liquidity PP X P X Midstream Corporate Structure PP PX X Market Reaction (Consistent with Precedents) PP PX X
Preliminary and Confidential – Subject to Further Review and Revision 1. Preliminary Valuation Analysis
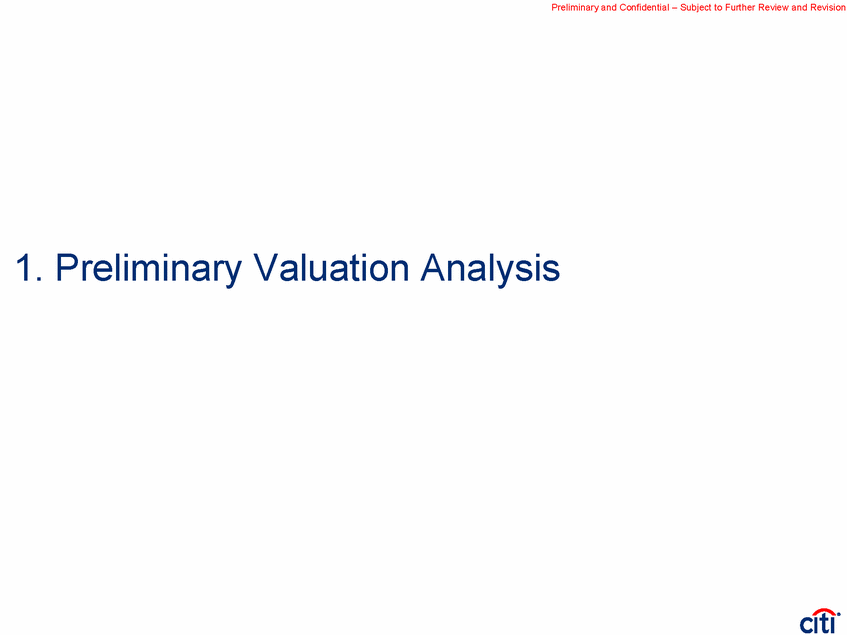
Preliminary and Confidential – Subject to Further Review and Revision Relative Historical Trading Performance Price Performance Since AMGP IPO (%) 40.0% (9.6%) 30.0% 20.0% 10.0% 0.0% (10.5%) (12.6%) (10.0%) (20.0%) (28.8%) (30.0%) A BC D (40.0%) May-17 Aug-17 Nov-17 Feb-18 May-18 Sep-18 AMGP AM AMZ Recent Events A• B• C• D• E• 1/24/2018: Chapter IV Investors sends letter to Antero urging simplification 2/13/2018: AM and AMGP Announce Q4 and FY2018 Earnings 2/26/2018: Antero Announces Formation of Special Committee 4/25/2018: AM and AMGP Announce Q1 Earnings 8/1/2018: AM and AMGP Announce Q2 Earnings Source: Company filings, FactSet. Market data as of 9/7/2018. 2 E 20.0% 15.0% 10.0% 5.0% 0.0%(0.3%) (5.0%) (10.0%)(13.0%) (15.0%) (20.0%) Aug-18Aug-18Aug-18Aug-18Sep-18 AMGPAMAMZ Price Performance Since Q2 Earnings
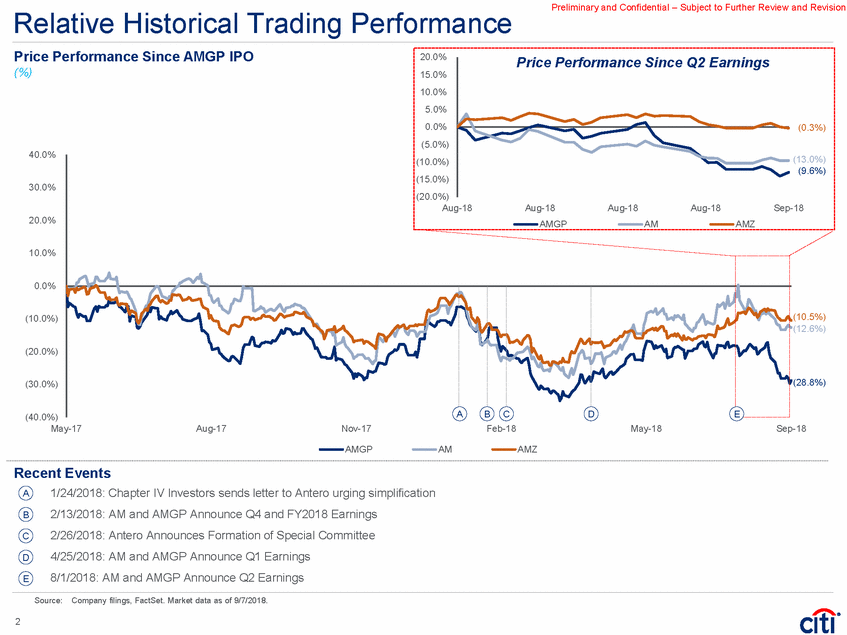
Preliminary and Confidential – Subject to Further Review and Revision Historical Exchange Ratio Exchange Ratio Since AMGP IPO (AM / AMGP; x) % Im plie d Pre m ium / (Dis count) Curre nt Ratio Illus trative Ratio Pe riod Exchange Ratio 1.764x 1.775x 1.850x Current Last 10 Days Last 20 Days Last 30 Days Last 1 Month Last 3 Months 1.764x 1.733 1.683 1.687 1.682 1.646 0.0% 1.8% 4.8% 4.5% 4.9% 7.2% 0.6% 2.4% 5.5% 5.2% 5.5% 7.9% 4.9% 6.7% 9.9% 9.6% 10.0% 12.4% 2.000x % % % % 1.900x 1.800x 1.764x 1.800x 1.700x 1.682x 1.646x 1.607x 1.572x 1.600x 1.563x 1.500x 1.400x 1.300x 1.200x May-17 Aug-17 Last 1 Month Nov-17 Feb-18 May-18 Since IPO Sep-18 @ 1.800x Exchange Ratio Current Last 3 Months Last 6 Months Last 12 Months Recent Events A• B• C• D• E• 1/24/2018: Chapter IV Investors sends letter to Antero urging simplification 2/13/2018: AM and AMGP Announce Q4 and FY2018 Earnings 2/26/2018: Antero Announces Formation of Special Committee 4/25/2018: AM and AMGP Announce Q1 Earnings 8/1/2018: AM and AMGP Announce Q2 Earnings Source: Company filings, FactSet. Market data as of 9/7/2018. 3 Last 6 Months 1.607 9.7% 10.4% 15.1 Last 12 Months 1.563 12.9% 13.6% 18.4 Since IPO 1.572 12.2% 12.9% 17.6 @ 1.800x Exchange Ratio 1.800 (2.0%) (1.4%) 2.8 E D A B C
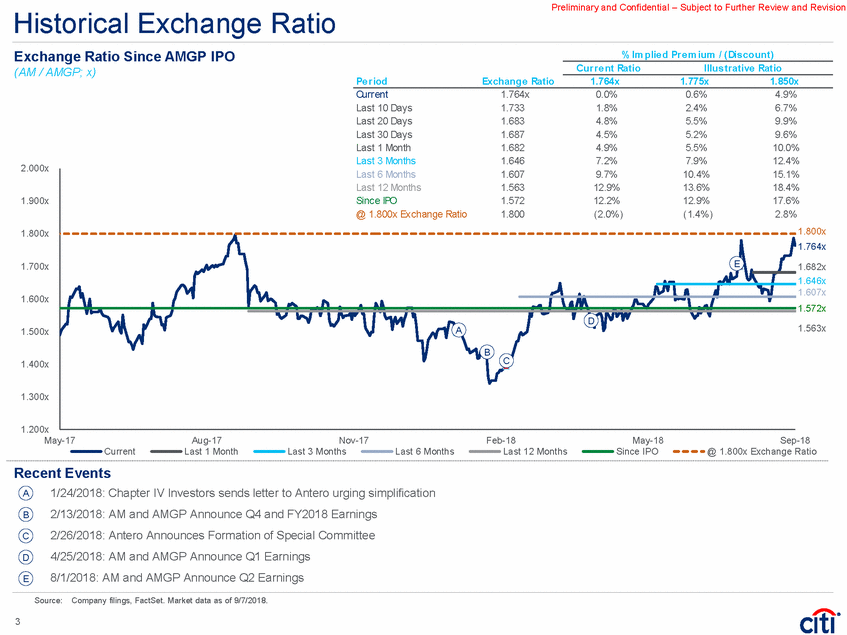
Preliminary and Confidential – Subject to Further Review and Revision Preliminary AM Financial Analysis Methodology Implied Reference Range ($/unit) Assumptions • Excludes outlier of $51.00 33.00 $40.00 $51.00 • 2020E FV / EBITDA: 8.2x - 11.0x • 2020E P / DCF: 9.3x - 11.4x • One-Month Purchase Price Premium: 0.0% - 26.9% Source: Company filings, management projections, FactSet. Market data as of 9/7/2018. Note: Valuation ranges rounded to nearest $0.25 / unit except 52-Week High/Low. 4 Current Unit Price: $29.51 For Informational Purposes 52-Wk High/Low$24.20 $34.18 Analyst Price Targets$ $29.25 •2019E FV / EBITDA: 10.2x - 12.3x $37.00•2019E P / DCF: 10.5x - 12.5x Selected Precedent Transactions $30.00 $38.00•One-Day Purchase Price Premium: 0.0% - 25.8% Discounted Cash Flow Analysis •Cost of Equity: 9.0% - 11.0% $38.25$46.75•Terminal P / DCF per LP Unit range of 10.5x - 12.5x •Based on 1.0x Distribution Coverage Selected Comparable Companies Analysis
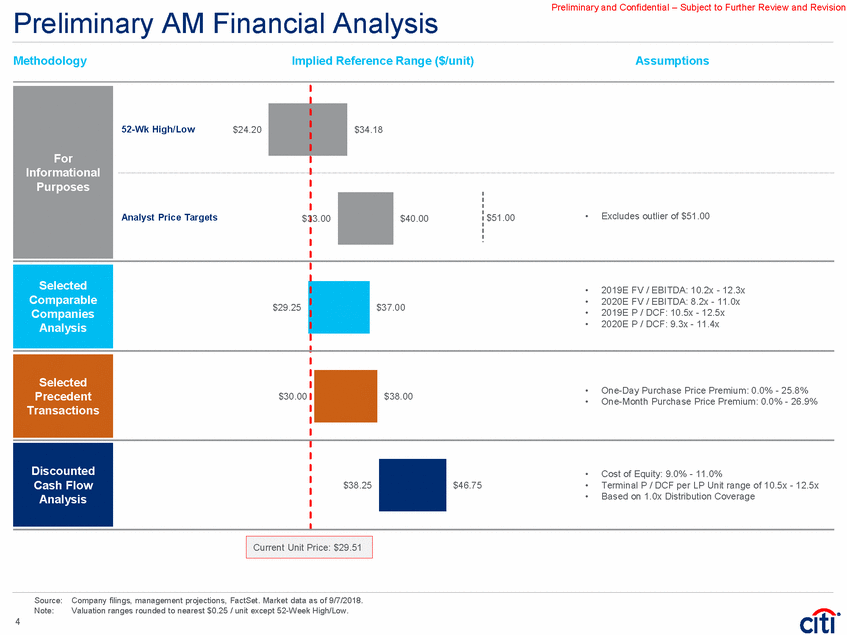
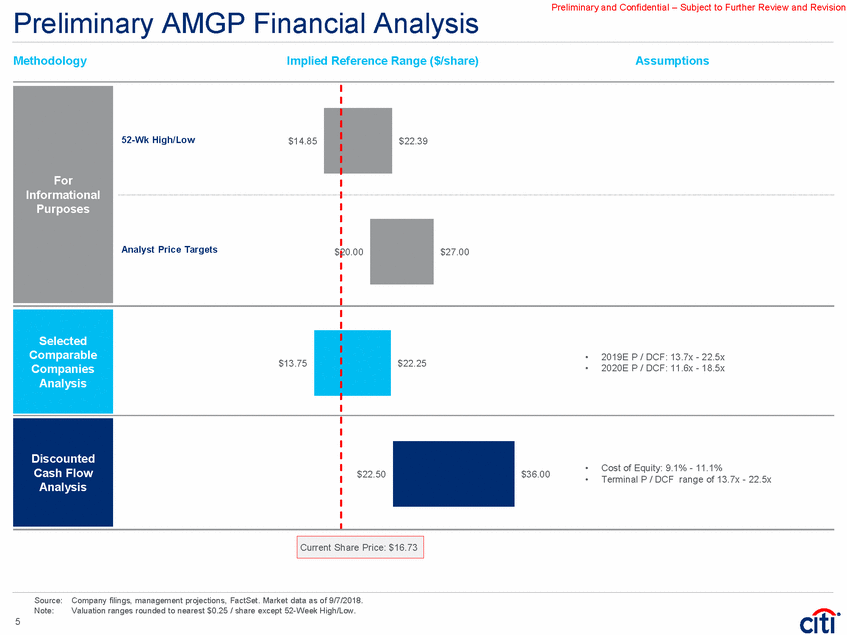
Preliminary and Confidential – Subject to Further Review and Revision Preliminary AMGP Financial Analysis Methodology Implied Reference Range ($/share) Assumptions $22.25 • 2020E P / DCF: 11.6x - 18.5x • Terminal P / DCF range of 13.7x - 22.5x Source: Company filings, management projections, FactSet. Market data as of 9/7/2018. Note: Valuation ranges rounded to nearest $0.25 / share except 52-Week High/Low. 5 Current Share Price: $16.73 52-Wk High/Low$14.85 $22.39 Analyst Price Targets$ 20.00$27.00 Selected Comparable Companies Analysis $13.75 •2019E P / DCF: 13.7x - 22.5x Discounted Cash Flow Analysis $22.50$36.00•Cost of Equity: 9.1% - 11.1% For Informational Purposes
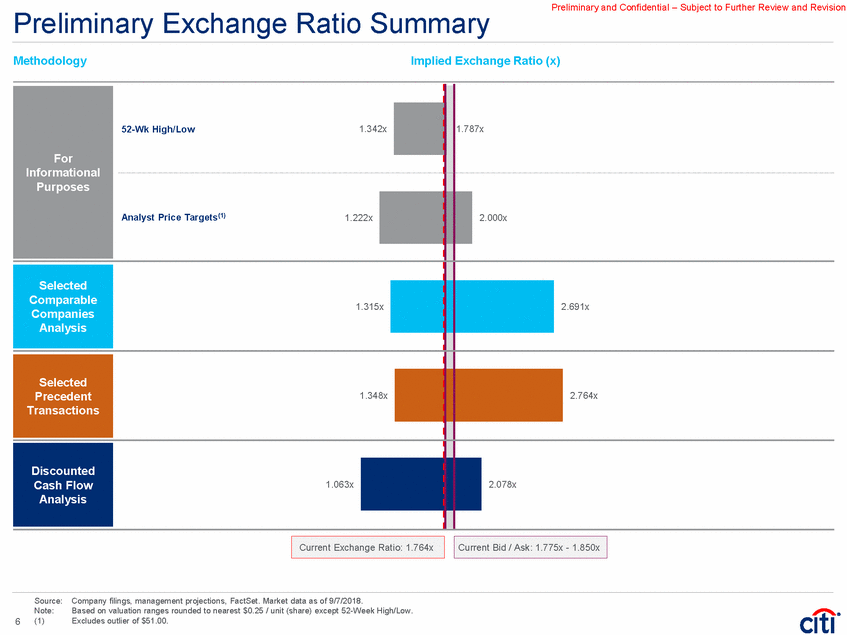
Preliminary and Confidential – Subject to Further Review and Revision Preliminary Exchange Ratio Summary Methodology Implied Exchange Ratio (x) Source: Note: (1) Company filings, management projections, FactSet. Market data as of 9/7/2018. Based on valuation ranges rounded to nearest $0.25 / unit (share) except 52-Week High/Low. Excludes outlier of $51.00. 6 Current Bid / Ask: 1.775x - 1.850x Current Exchange Ratio: 1.764x For Informational Purposes 1.787x 52-Wk High/Low1.342x Analyst Price Targets(1) 1.222x 2.000x 1.315x 2.691x Selected Precedent Transactions 1.348x 2.764x Discounted Cash Flow1.063x Analysis 2.078x Selected Comparable Companies Analysis
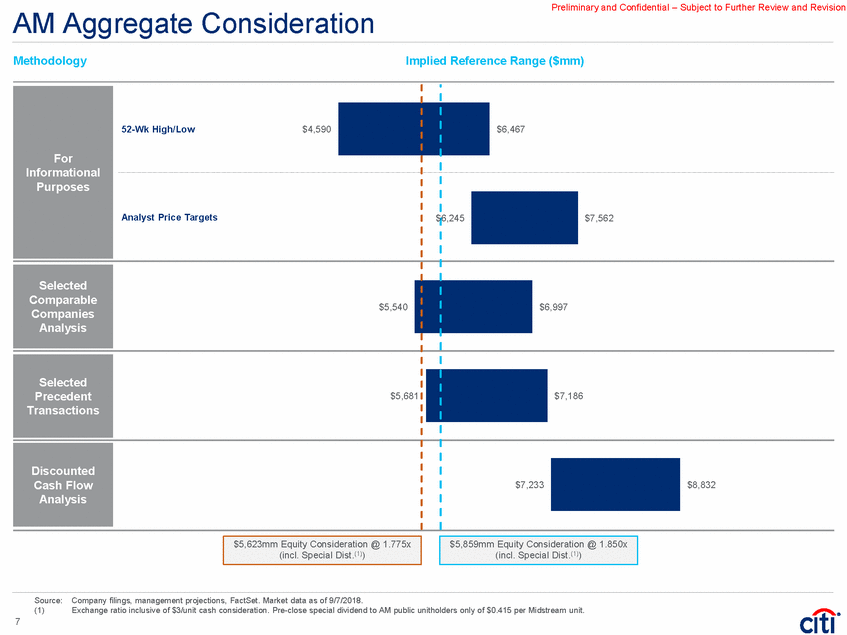
Preliminary and Confidential – Subject to Further Review and Revision AM Aggregate Consideration Methodology Implied Reference Range ($mm) Source: Company filings, management projections, FactSet. Market data as of 9/7/2018. (1) Exchange ratio inclusive of $3/unit cash consideration. Pre-close special dividend to AM public unitholders only of $0.415 per Midstream unit. 7 $5,859mm Equity Consideration @ 1.850x (incl. Special Dist.(1)) $5,623mm Equity Consideration @ 1.775x (incl. Special Dist.(1)) For Informational Purposes 52-Wk High/Low$4,590 $6,467 Analyst Price Targets $ 6,245$7,562 $5,540 $6,997 Selected Precedent Transactions $5,681 $7,186 Discounted Cash Flow Analysis $7,233$8,832 Selected Comparable Companies Analysis
Preliminary and Confidential – Subject to Further Review and Revision A. Preliminary Series B Financial Analysis
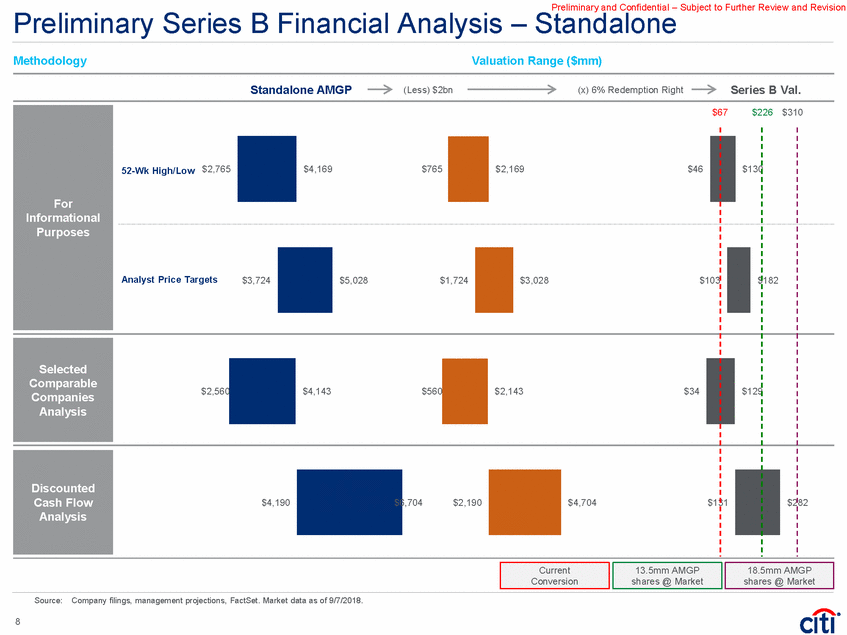
Preliminary and Confidential – Subject to Further Review and Revision Analysis – Standalone Preliminary Series B Financial Methodology Valuation Range ($mm) Standalone AMGP Series B Val. (Less) $2bn (x) 6% Redemption Right $67 $226 $310 $2,765 $4,169 $765 $2,169 $46 $130 52-Wk High/Low 31 82 Source: Company filings, management projections, FactSet. Market data as of 9/7/2018. 8 Analyst Price Targets$3,724$5,028$1,724$3,028$103 $ 182 $2,560$4,143$560$2,143$34 $129 $4,1906,704$2,190$4,704$1 $2 Current Conversion 13.5mm AMGP shares @ Market 18.5mm AMGP shares @ Market $ Discounted Cash Flow Analysis Selected Comparable Companies Analysis For Informational Purposes
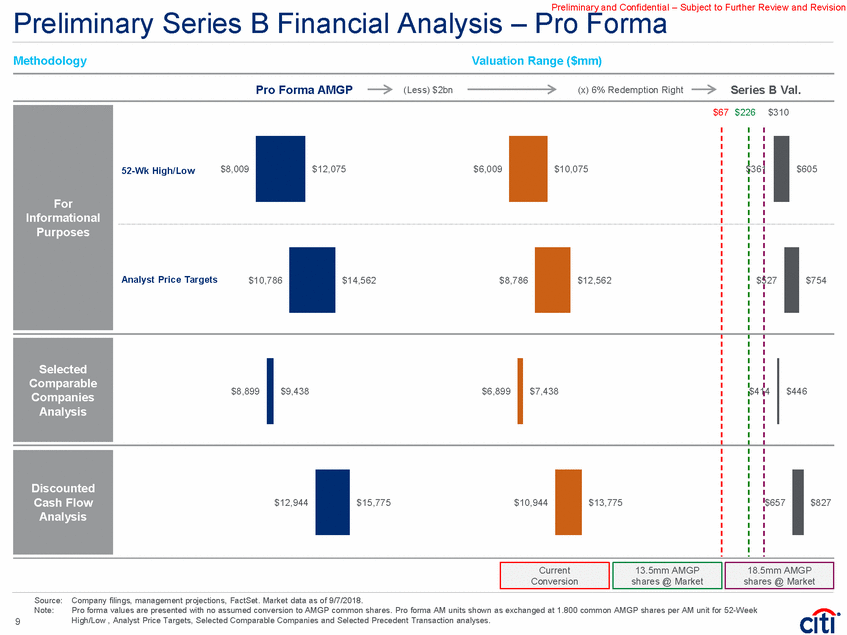
Preliminary and Confidential – Subject to Further Review and Revision Analysis – Pro Forma Preliminary Series B Financial Methodology Valuation Range ($mm) Pro Forma AMGP Series B Val. (Less) $2bn (x) 6% Redemption Right $67 $226$310 $361 $605 527 $754 Source: Company filings, management projections, FactSet. Market data as of 9/7/2018. Note: Pro forma values are presented with no assumed conversion to AMGP common shares. Pro forma AM units shown as exchanged at 1.800 common AMGP shares per AM unit for 52-Week High/Low , Analyst Price Targets, Selected Comparable Companies and Selected Precedent Transaction analyses. 9 52-Wk High/Low$8,009$12,075$6,009$10,075 Analyst Price Targets$10,786$14,562$8,786$12,562 $ $8,899$9,438$6,899$7,438 $41 4$446 $12,944$15,775$10,944$13,775 $657$827 Current Conversion 13.5mm AMGP shares @ Market 18.5mm AMGP shares @ Market Discounted Cash Flow Analysis Selected Comparable Companies Analysis For Informational Purposes
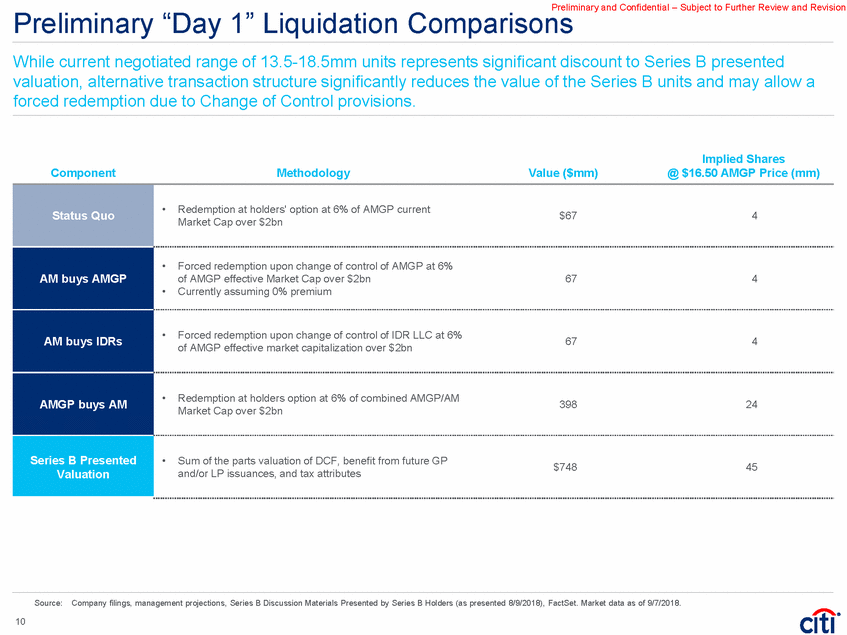
Preliminary and Confidential – Subject to Further Review and Revision Preliminary “Day 1” Liquidation Comparisons While current negotiated range of 13.5-18.5mm units represents significant discount to Series B presented valuation, alternative transaction structure significantly reduces the value of the Series B units and may allow a forced redemption due to Change of Control provisions. Implied Shares @ $16.50 AMGP Price (mm) Component Methodology Value ($mm) $67 4 Market Cap over $2bn 67 4 of AMGP effective market capitalization over $2bn 398 24 Market Cap over $2bn $748 45 and/or LP issuances, and tax attributes Source: Company filings, management projections, Series B Discussion Materials Presented by Series B Holders (as presented 8/9/2018), FactSet. Market data as of 9/7/2018. 10 Status Quo •Redemption at holders' option at 6% of AMGP current AM buys AMGP •Forced redemption upon change of control of AMGP at 6% of AMGP effective Market Cap over $2bn674 •Currently assuming 0% premium AM buys IDRs •Forced redemption upon change of control of IDR LLC at 6% AMGP buys AM •Redemption at holders option at 6% of combined AMGP/AM Series B Presented Valuation •Sum of the parts valuation of DCF, benefit from future GP
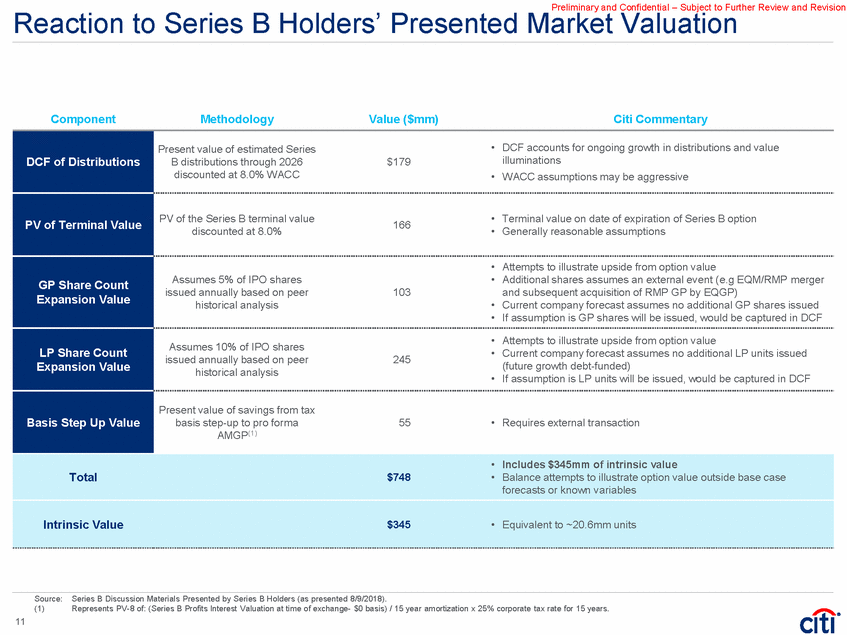
Preliminary and Confidential – Subject to Further Review and Revision Market Valuation Reaction to Series B Holders’ Presented Component Methodology Value ($mm) Citi Commentary 166 discounted at 8.0% • Generally reasonable assumptions issued annually based on peer 103 and subsequent acquisition of RMP GP by EQGP) Assumes 10% of IPO shares • Current company forecast assumes no additional LP units issued historical analysis • If assumption is LP units will be issued, would be captured in DCF Source: Series B Discussion Materials Presented by Series B Holders (as presented 8/9/2018). (1) Represents PV-8 of: (Series B Profits Interest Valuation at time of exchange-$0 basis) / 15 year amortization x 25% corporate tax rate for 15 years. 11 DCF of Distributions Present value of estimated Series• DCF accounts for ongoing growth in distributions and value B distributions through 2026$179illuminations discounted at 8.0% WACC• WACC assumptions may be aggressive PV of Terminal Value PV of the Series B terminal value• Terminal value on date of expiration of Series B option GP Share Count Expansion Value • Attempts to illustrate upside from option value Assumes 5% of IPO shares• Additional shares assumes an external event (e.g EQM/RMP merger historical analysis• Current company forecast assumes no additional GP shares issued • If assumption is GP shares will be issued, would be captured in DCF LP Share Count Expansion Value • Attempts to illustrate upside from option value issued annually based on peer245(future growth debt-funded) Basis Step Up Value Present value of savings from tax basis step-up to pro forma55• Requires external transaction AMGP(1) • Includes $345mm of intrinsic value Total$748• Balance attempts to illustrate option value outside base case forecasts or known variables Intrinsic Value$345• Equivalent to ~20.6mm units
Preliminary and Confidential – Subject to Further Review and Revision 2. Preliminary Pro Forma Impacts
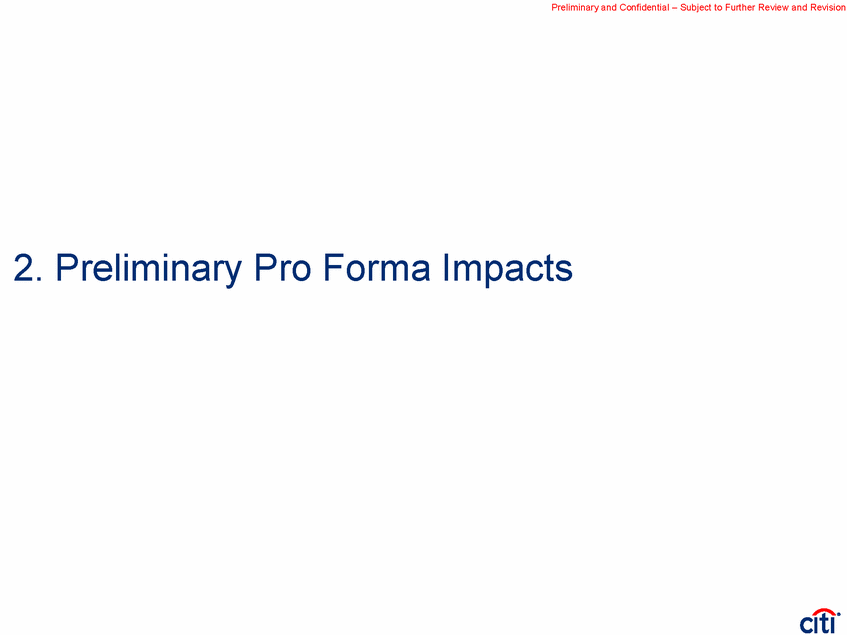
Preliminary and Confidential – Subject to Further Review and Revision AM at Various Exchange Ratios @ M ark e t @ M ark e t @ 1.775x @ 1.800x @ 1.825x @ 1.850x ($mm, unl ess noted otherwi se) 52-w eek high-low ($) % of 52-week high 20-Day VWAP % of 20-Day VWAP Implied Premium to Current Implied Premium to 20-Day VWAP Current Shares / Units Outstanding (mm) 22.39 – 14.85 74.7% $18.23 91.8% 34.18 – 24.20 86.3% $30.81 95.8% 34.18 – 24.20 86.9% $30.81 96.4% 0.6% (3.6%) 188.118 34.18 – 24.20 88.1% $30.81 97.7% 2.0% (2.3%) 188.118 34.18 – 24.20 89.3% $30.81 99.1% 3.5% (0.9%) 188.118 34.18 – 24.20 90.6% $30.81 100.5% 4.9% 0.5% 188.118 186.209 188.118 (+) Implied Market Value of GP (1) (+) Total Debt (+) NCI (-) Inv. In Unconsol. Af f iliate (-) Cash and Equivalents - 0.0 ---- (5.3) 3,110.0 1,411.6 ---- (19.5) 3,110.0 1,411.6 ---- (19.5) 3,110.0 1,411.6 ---- (19.5) 3,110.0 1,411.6 ---- (19.5) 3,110.0 1,411.6 ---- (19.5) Im plie d Firm Value ($m m ) $3,110.0 $10,053.4 $10,088.3 $10,167.0 $10,245.7 $10,324.4 Curre nt Dis tribution ($/unit) 2019E Dis tribution / Cove rage (x) 2020E Dis tribution / Cove rage (x) 2021E Dis tribution / Cove rage (x) $0.50 $0.89 / 1.00x $1.34 / 1.00x $1.74 / 1.00x $1.66 $2.21 / 1.28x $2.85 / 1.14x $3.42 / 1.10x $1.66 $2.21 / 1.28x $2.85 / 1.14x $3.42 / 1.10x $1.66 $2.21 / 1.28x $2.85 / 1.14x $3.42 / 1.10x $1.66 $2.21 / 1.28x $2.85 / 1.14x $3.42 / 1.10x $1.66 $2.21 / 1.28x $2.85 / 1.14x $3.42 / 1.10x Curre nt Yie ld (%) 2019E Yie ld (%) 2020E Yie ld (%) 2021E Yie ld (%) 3.0% 5.3 8.0 10.4 5.6% 7.5 9.7 11.6 5.6% 7.4 9.6 11.5 5.5% 7.3 9.5 11.4 5.4% 7.2 9.3 11.2 5.4% 7.1 9.2 11.0 2019E DCF / LP Unit & Price / DCF ($ / x) 2020E DCF / LP Unit & Price / DCF ($ / x) 2021E DCF / LP Unit & Price / DCF ($ / x) $0.89 / 18.9x $1.34 / 12.5x $1.74 / 9.6x $2.70 / 10.9x $3.18 / 9.3x $3.72 / 7.9x $2.70 / 11.0x $3.18 / 9.3x $3.72 / 8.0x $2.70 / 11.2x $3.18 / 9.5x $3.72 / 8.1x $2.70 / 11.3x $3.18 / 9.6x $3.72 / 8.2x $2.70 / 11.5x $3.18 / 9.7x $3.72 / 8.3x Source: Company fillings, management projections, FactSet. Market data as of 9/7/2018. (1) Firm Value of public GP – Market Value of LP Units held by GP – Value of Non-GP Businesses. 12 DCF Distributions EBITDA 2019E EBITDA ($m m ) 235.4 988.6 988.6 988.6 988.6 988.6 2020E EBITDA ($m m ) 355.1 1,222.2 1,222.2 1,222.2 1,222.2 1,222.2 2021E EBITDA ($m m ) 461.8 1,413.5 1,413.5 1,413.5 1,413.5 1,413.5 FV / 2019E EBITDA (x) 13.2 10.2 10.2 10.3 10.4 10.4 FV / 2020E EBITDA (x) 8.8 8.2 8.3 8.3 8.4 8.4 FV / 2021E EBITDA (x) 6.7 7.1 7.1 7.2 7.2 7.3 Im plie d Equity LP M ark e t Value ($m m ) $3,115.3 $5,551.4 $5,586.3 $5,665.0 $5,743.7 $5,822.4 Share / Unit Price ($) as of 9/7/2018 $16.73 $29.51 $29.70 $30.11 $30.53 $30.95
Preliminary and Confidential – Subject to Further Review and Revision A. AMGP Acquires AM
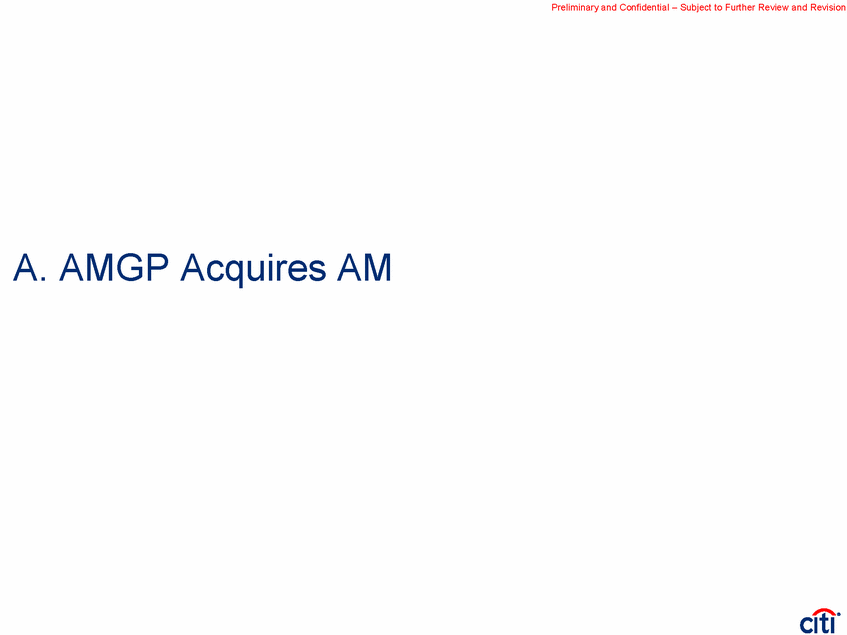
Preliminary and Confidential – Subject to Further Review and Revision Transaction Overview Transaction Steps Transaction Structure(1) Standalone • • Effective transaction date of 1/1/2019 AMGP acquires AM common units at either: – 1.775x Exchange Ratio (inclusive of $3/unit cash consideration) plus $0.415 special distribution to Midstream Public Unitholders plus Series B settlement at 13.5mm shares; or – 1.8500x Exchange Ratio plus Series B settlement at 18.5mm shares – Transaction funded with 100% equity AMGP assumes $1,920mm of AM debt at effective transaction date of 1/1/2019 Assumes annual synergies of $5mm AMGP receives step-up on AM unit value Pro forma AMGP targets SA AM DPUs Growth capex funded according to standalone forecast Public Shareholders Sponsors 59.2% Interest 40.8% Interest AMGP AR • • • • • Public Unitholders % IDR Interest 47.4% LP Interest AM 1.775x AM/AMGP exchange, 13.5mm AMGP shares for Series B units Pro Forma (1.775x AM/AMGP exchange, 13.5mm AMGP shares for Series B units) Public Shareholders AR Sponsors Direct Equity Issued Assumption of AM Debt Draw on RCF $5,812 1,920 66 Purchase of Public AM Units Redeem Series B Pref erred Units Assumption of AM Debt Transaction Fees and Expenses Special Distribution $5,586 226 1,920 29 37 20.7% Interest Fmr. Series B Unitholders 32.9% Interest 43.9% Interest AMGP 2.5% Interest Pro Forma (1.850x AM/AMGP exchange, 18.5mm AMGP shares for Series B units) 1.850x AM/AMGP exchange, 18.5mm AMGP shares for Series B units Public Shareholders AR Sponsors Direct Equity Issued Assumption of AM Debt Draw on RCF $6,132 1,920 66 Purchase of Public AM Units Redeem Series B Pref erred Units Assumption of AM Debt Transaction Fees and Expenses Special Distribution $5,822 310 1,920 29 37 19.9% Interest Fmr. Series B Unitholders 33.1% Interest 43.6% Interest AMGP 3.3% Interest Source: Company filings, management projections, FactSet. Market data as of 9/7/2018. Note: PF ownership assumes no cash election. (1) Ownership percentages at effective transaction date of 1/1/2019. 13 52.6% LP Interest Total Trans action Us e s $8,118 Total Trans action Source s $8,118 AM GP Us e s ($m m ) AM GP Source s ($m m ) Total Trans action Us e s $7,798 Total Trans action Source s $7,798 AM GP Us e s ($m m ) AM GP Source s ($m m ) 100
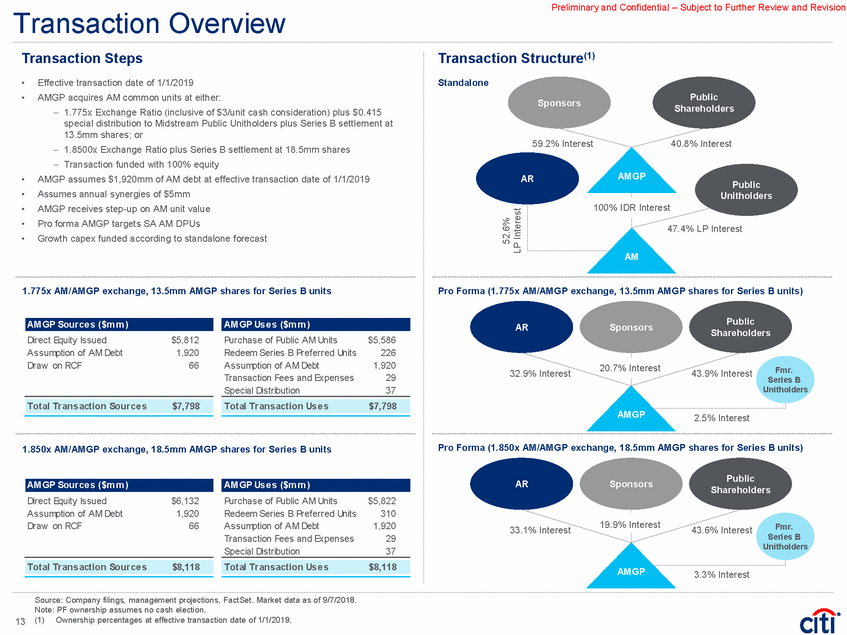
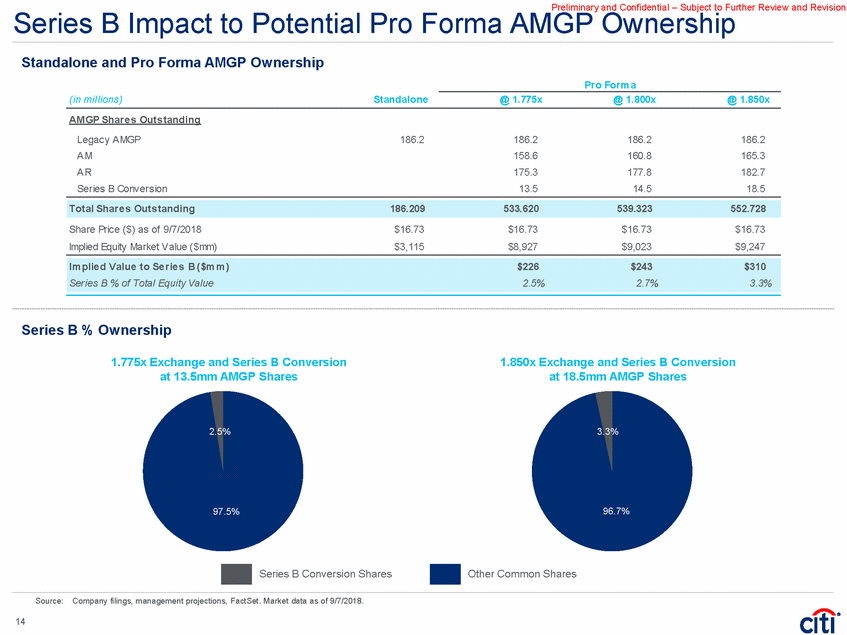
Preliminary and Confidential – Subject to Further Review and Revision Pro Forma AMGP Ownership Series B Impact to Potential Standalone and Pro Forma AMGP Ownership Pro Form a (in millions) Standalone @ 1.775x @ 1.800x @ 1.850x AM GP Shar e s Outs tanding Legacy AMGP AM AR Series B Conversion 186.2 186.2 158.6 175.3 13.5 186.2 160.8 177.8 14.5 186.2 165.3 182.7 18.5 Share Price ($) as of 9/7/2018 Implied Equity Market Value ($mm) $16.73 $3,115 $16.73 $8,927 $16.73 $9,023 $16.73 $9,247 Series B % Ownership 1.775x Exchange and Series B Conversion at 13.5mm AMGP Shares 1.850x Exchange and Series B Conversion at 18.5mm AMGP Shares .5% 3.3 97.5% 96.7% Series B Conversion Shares Other Common Shares Source: Company filings, management projections, FactSet. Market data as of 9/7/2018. 14 Im plie d Value to Se rie s B ($m m )$226$243$310 Series B % of Total Equity Value2.5%2.7%3.3% Total Share s Outs tanding186.209533.620539.323552.728
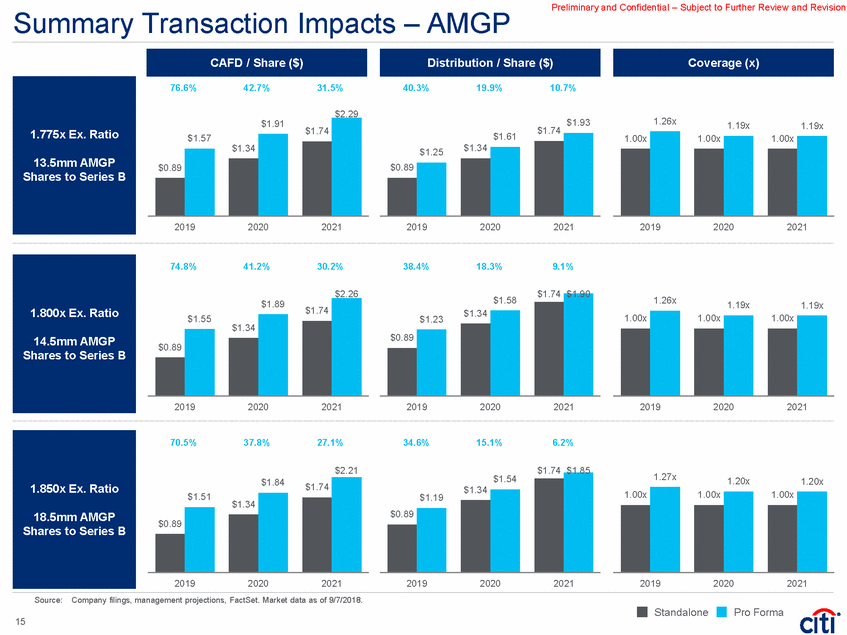
Preliminary and Confidential – Subject to Further Review and Revision Summary Transaction Impacts – AMGP 76.6% 42.7% 31.5% 40.3% 19.9% 10.7% $2.29 1.26x $1.93 1.19x 1.19x $1.74 $1.74 $1.61 $1.34 2019 2020 2021 2019 2020 2021 2019 2020 2021 74.8% 41.2% 30.2% 38.4% 18.3% 9.1% $2.26 $1.74 $1.90 $1.58 1.26x 1.19x 1.19x $1.74 $1.34 2019 2020 2021 2019 2020 2021 2019 2020 2021 70.5% 37.8% 27.1% 34.6% 15.1% 6.2% $2.21 $1.74 $1.85 1.27x $1.54 1.20x 1.20x $1.34 $1.34 2019 2020 2021 2019 2020 2021 2019 2020 2021 Source: Company filings, management projections, FactSet. Market data as of 9/7/2018. Standalone Pro Forma 15 1.00x 1.00x 1.00x $1.84$1.74 $1.51 $0.89 $1.19 $0.89 1.850x Ex. Ratio 18.5mm AMGP Shares to Series B 1.00x 1.00x 1.00x $1.89 $1.55 $0.89 $1.23$1.34 $0.89 1.800x Ex. Ratio 14.5mm AMGP Shares to Series B 1.00x 1.00x 1.00x $1.25$1.34 $0.89 $1.91 $1.57 $0.89 1.775x Ex. Ratio 13.5mm AMGP Shares to Series B Coverage (x) Distribution / Share ($) CAFD / Share ($)
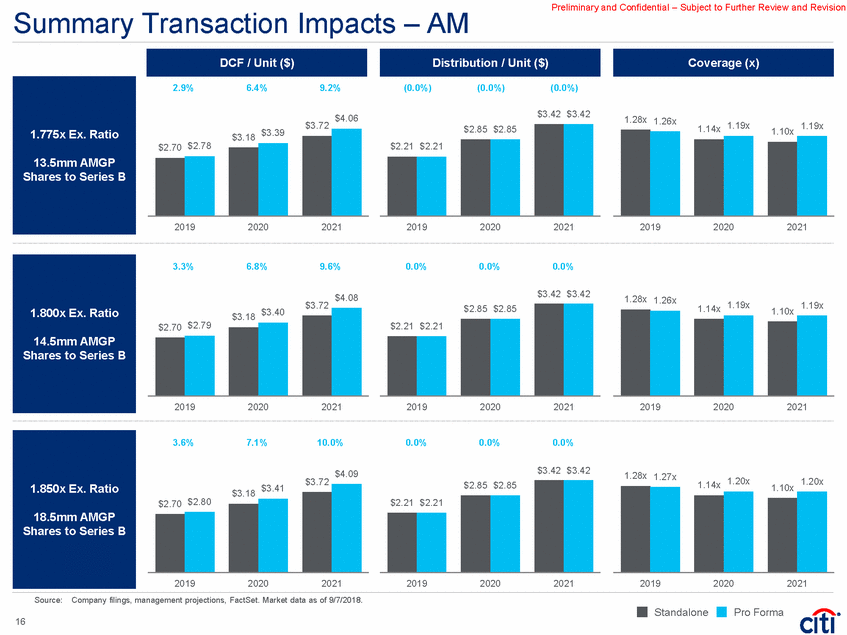
Preliminary and Confidential – Subject to Further Review and Revision Summary Transaction Impacts – AM 2.9% 6.4% 9.2% (0.0%) (0.0%) (0.0%) $3.42 $3.42 $4.06 1.28x 1.26x $3.72 1.19x 1.19x 1.14x 1.10x $3.18 $3.39 $2.70 $2.78 2019 2020 2021 2019 2020 2021 2019 2020 2021 3.3% 6.8% 9.6% 0.0% 0.0% 0.0% $3.42 $3.42 $4.08 1.28x 1.26x $3.72 1.19x 1.19x 1.14x 1.10x $3.18 $3.40 $2.70 $2.79 2019 2020 2021 2019 2020 2021 2019 2020 2021 3.6% 7.1% 10.0% 0.0% 0.0% 0.0% $3.42 $3.42 $4.09 1.28x 1.27x 1.20x $3.72 1.20x 1.14x 1.10x $3.18 $3.41 $2.70 $2.80 2019 2020 2021 2019 2020 2021 2019 2020 2021 Source: Company filings, management projections, FactSet. Market data as of 9/7/2018. Standalone Pro Forma 16 $2.85 $2.85 $2.21 $2.21 1.850x Ex. Ratio 18.5mm AMGP Shares to Series B $2.85 $2.85 $2.21 $2.21 1.800x Ex. Ratio 14.5mm AMGP Shares to Series B $2.85 $2.85 $2.21 $2.21 1.775x Ex. Ratio 13.5mm AMGP Shares to Series B Coverage (x) Distribution / Unit ($) DCF / Unit ($)
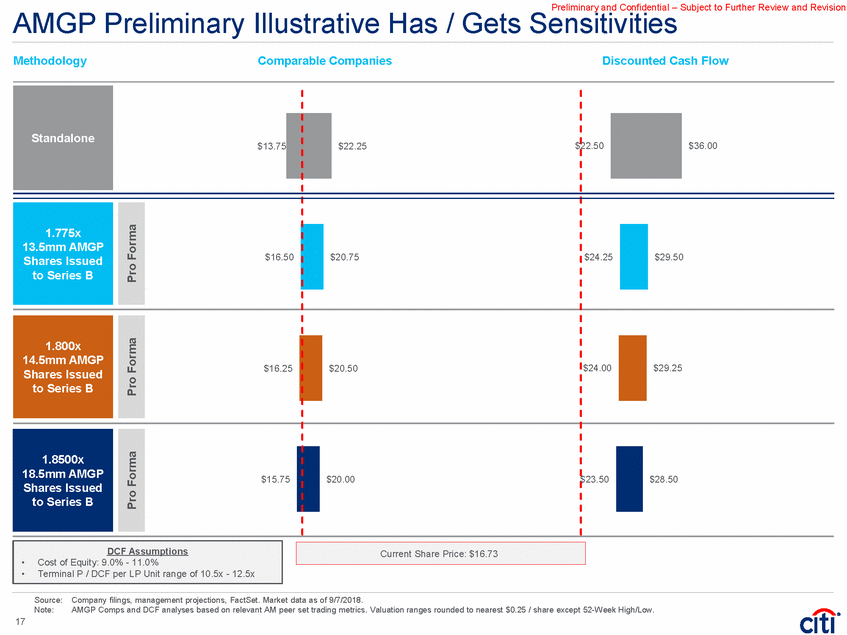
Preliminary and Confidential – Subject to Further Review and Revision Sensitivities AMGP Preliminary Illustrative Has / Gets Methodology Comparable Companies Discounted Cash Flow •Cost of Equity: 9.0% - 11.0% Source: Company filings, management projections, FactSet. Market data as of 9/7/2018. Note: AMGP Comps and DCF analyses based on relevant AM peer set trading metrics. Valuation ranges rounded to nearest $0.25 / share except 52-Week High/Low. 17 Pro Forma Pro Forma Pro Forma DCF Assumptions •Terminal P / DCF per LP Unit range of 10.5x - 12.5x Current Share Price: $16.73 22.50$36.00 $13.75 $22.25$ $16.50 $24.25$29.50 $20.75 $16.25 $24.00$29.25 $20.50 $23.50$28.50 $15.75 $20.00 1.8500x 18.5mm AMGP Shares Issued to Series B 1.800x 14.5mm AMGP Shares Issued to Series B 1.775x 13.5mm AMGP Shares Issued to Series B Standalone
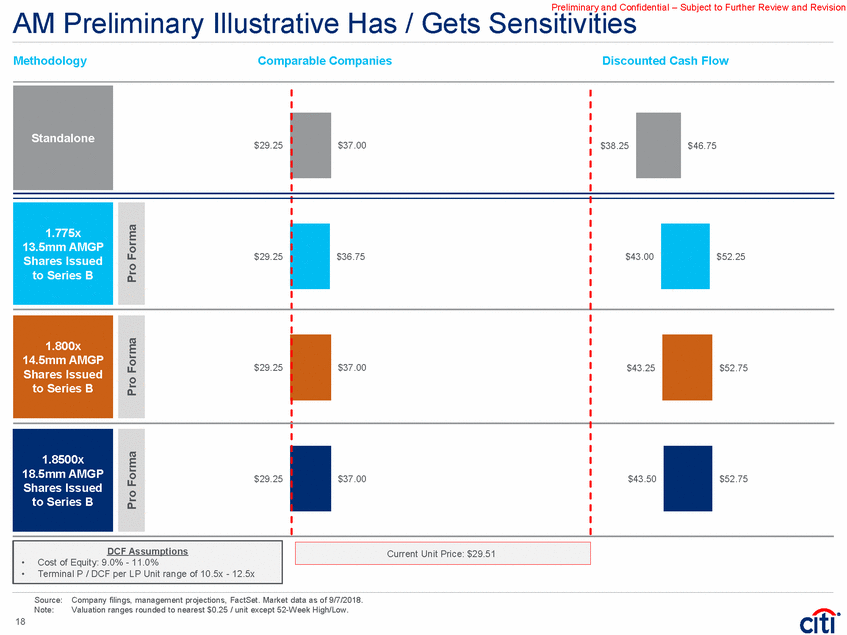
Preliminary and Confidential – Subject to Further Review and Revision Sensitivities AM Preliminary Illustrative Has / Gets Methodology Comparable Companies Discounted Cash Flow •Cost of Equity: 9.0% - 11.0% Source: Company filings, management projections, FactSet. Market data as of 9/7/2018. Note: Valuation ranges rounded to nearest $0.25 / unit except 52-Week High/Low. 18 Pro Forma Pro Forma Pro Forma DCF Assumptions •Terminal P / DCF per LP Unit range of 10.5x - 12.5x Current Unit Price: $29.51 Shares Issued $29.25 $38.25$46.75 $37.00 $29.25 $43.00$52.25 $36.75 1.800x 14.5mm AMGP Shares Issued$29.25 to Series B $43.25$52.75 $37.00 1.8500x 18.5mm AMGP$29.25 to Series B $43.50$52.75 $37.00 1.775x 13.5mm AMGP Shares Issued to Series B Standalone
Preliminary and Confidential – Subject to Further Review and Revision B. AM Acquires AMGP
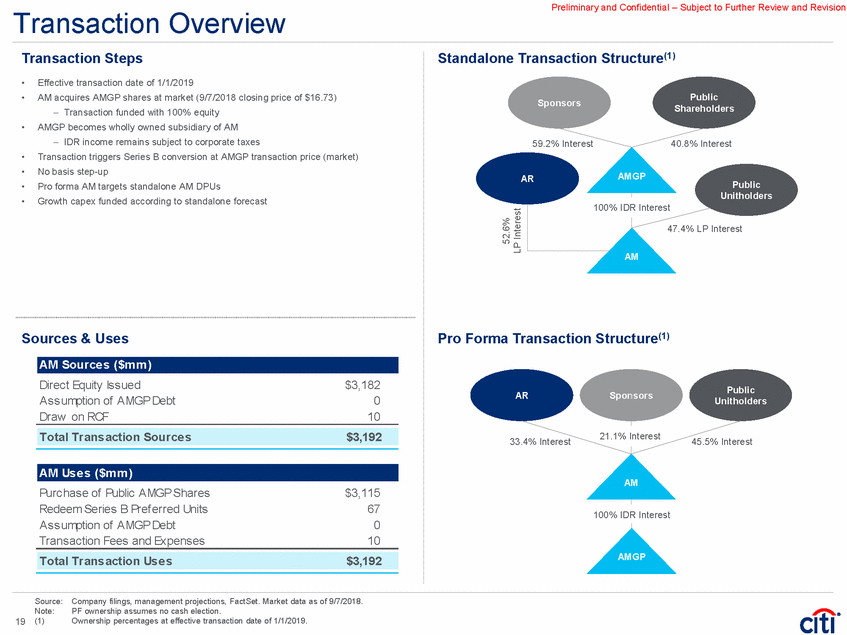
Preliminary and Confidential – Subject to Further Review and Revision Transaction Overview Transaction Steps Standalone Transaction Structure(1) • • Effective transaction date of 1/1/2019 AM acquires AMGP shares at market (9/7/2018 closing price of $16.73) – Transaction funded with 100% equity AMGP becomes wholly owned subsidiary of AM – IDR income remains subject to corporate taxes Transaction triggers Series B conversion at AMGP transaction price (market) No basis step-up Pro forma AM targets standalone AM DPUs Growth capex funded according to standalone forecast Public Shareholders Sponsors • 59.2% Interest 40.8% Interest • • • • AMGP AR Public Unitholders % IDR Interest 47.4% LP Interest AM Sources & Uses Pro Forma Transaction Structure(1) Direct Equity Issued Assumption of AMGP Debt Draw on RCF $3,182 0 10 Public Unitholders AR Sponsors 21.1% Interest 33.4% Interest 45.5% Interest AM Purchase of Public AMGP Shares Redeem Series B Pref erred Units Assumption of AMGP Debt Transaction Fees and Expenses $3,115 67 0 10 100% IDR Interest AMGP Source: Note: (1) Company filings, management projections, FactSet. Market data as of 9/7/2018. PF ownership assumes no cash election. Ownership percentages at effective transaction date of 1/1/2019. 19 52.6% LP Interest Total Trans action Us e s$3,192 AM Us e s ($m m ) Total Trans action Source s$3,192 AM Source s ($m m ) 100
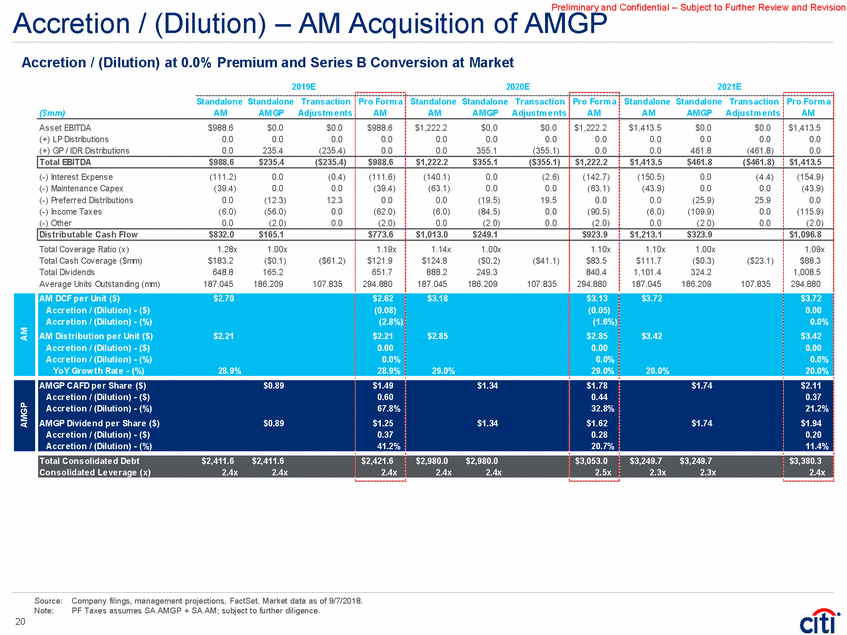
Preliminary and Confidential – Subject to Further Review and Revision Accretion / (Dilution) – AM Acquisition of AMGP Accretion / (Dilution) at 0.0% Premium and Series B Conversion at Market 2019E Standalone Standalone Trans action 2020E Standalone Standalone Trans action 2021E Standalone Standalone Trans action Pro Form a AM Pro Form a AM Pro Form a AM ($mm) AM AM GP Adjus tm e nts AM AM GP Adjus tm e nts AM AM GP Adjus tm e nts Asset EBITDA (+) LP Distributions (+) GP / IDR Distributions $988.6 0.0 0.0 $0.0 0.0 235.4 $0.0 0.0 (235.4) $988.6 0.0 0.0 $1,222.2 0.0 0.0 $0.0 0.0 355.1 $0.0 0.0 (355.1) $1,222.2 0.0 0.0 $1,413.5 0.0 0.0 $0.0 0.0 461.8 $0.0 0.0 (461.8) $1,413.5 0.0 0.0 (-) Interest Expense (-) Maintenance Capex (-) Pref erred Distributions (-) Income Taxes (-) Other (111.2) (39.4) 0.0 (6.0) 0.0 0.0 0.0 (12.3) (56.0) (2.0) (0.4) 0.0 12.3 0.0 0.0 (111.6) (39.4) 0.0 (62.0) (2.0) (140.1) (63.1) 0.0 (6.0) 0.0 0.0 0.0 (19.5) (84.5) (2.0) (2.6) 0.0 19.5 0.0 0.0 (142.7) (63.1) 0.0 (90.5) (2.0) (150.5) (43.9) 0.0 (6.0) 0.0 0.0 0.0 (25.9) (109.9) (2.0) (4.4) 0.0 25.9 0.0 0.0 (154.9) (43.9) 0.0 (115.9) (2.0) Total Coverage Ratio (x) Total Cash Coverage ($mm) Total Dividends Average Units Outstanding (mm) 1.28x $183.2 648.8 187.045 1.00x ($0.1) 165.2 186.209 1.19x $121.9 651.7 294.880 1.14x $124.8 888.2 187.045 1.00x ($0.2) 249.3 186.209 1.10x $83.5 840.4 294.880 1.10x $111.7 1,101.4 187.045 1.00x ($0.3) 324.2 186.209 1.09x $88.3 1,008.5 294.880 ($61.2) ($41.1) ($23.1) 107.835 107.835 107.835 Source: Company filings, management projections, FactSet. Market data as of 9/7/2018. Note: PF Taxes assumes SA AMGP + SA AM; subject to further diligence. 20 AM AM DCF pe r Unit ($) $2.70 $2.62 $3.18 $3.13 $3.72 $3.72 Accre tion / (Dilution) - ($) (0.08) (0.05) 0.00 Accre tion / (Dilution) - (%) (2.8%) (1.6%) 0.0% AM Dis tribution pe r Unit ($) $2.21 $2.21 $2.85 $2.85 $3.42 $3.42 Accre tion / (Dilution) - ($) 0.00 0.00 0.00 Accre tion / (Dilution) - (%) 0.0% 0.0% 0.0% YoY Grow th Rate - (%) 28.9% 28.9% 29.0% 29.0% 20.0% 20.0% AMGP AM GP CAFD pe r Share ($) $0.89 $1.49 $1.34 $1.78 $1.74 $2.11 Accre tion / (Dilution) - ($) 0.60 0.44 0.37 Accre tion / (Dilution) - (%) 67.8% 32.8% 21.2% AM GP Divide nd pe r Share ($) $0.89 $1.25 $1.34 $1.62 $1.74 $1.94 Accre tion / (Dilution) - ($) 0.37 0.28 0.20 Accre tion / (Dilution) - (%) 41.2% 20.7% 11.4% Total Cons olidate d De bt $2,411.6 $2,411.6 $2,421.6 $2,980.0 $2,980.0 $3,053.0 $3,249.7 $3,249.7 $3,380.3 Cons olidate d Le ve rage (x) 2.4x 2.4x 2.4x 2.4x 2.4x 2.5x 2.3x 2.3x 2.4x Dis tributable Cas h Flow $832.0 $165.1 $773.6 $1,013.0 $249.1 $923.9 $1,213.1 $323.9 $1,096.8 Total EBITDA $988.6 $235.4 ($235.4) $988.6 $1,222.2 $355.1 ($355.1) $1,222.2 $1,413.5 $461.8 ($461.8) $1,413.5
Preliminary and Confidential – Subject to Further Review and Revision C. AM GP / IDR Buy-In
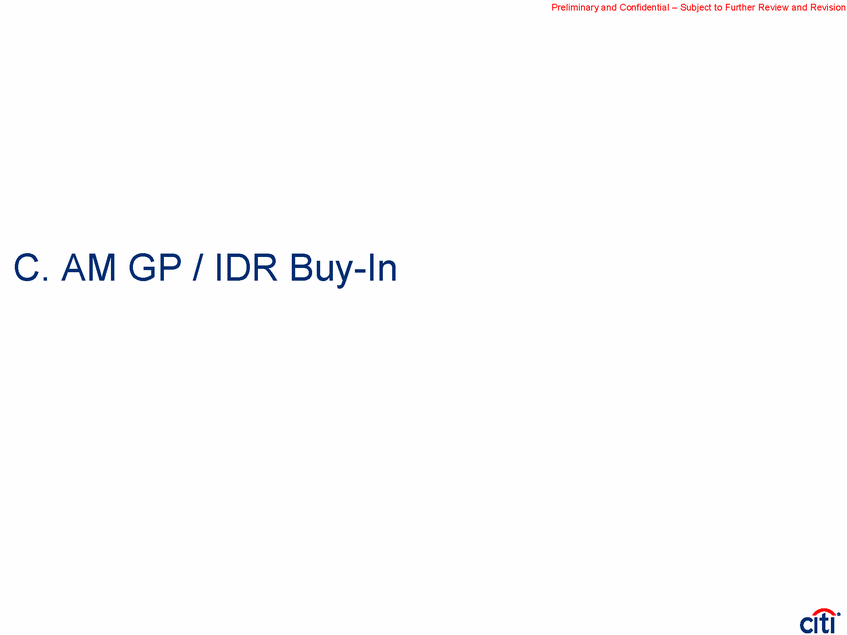
Preliminary and Confidential – Subject to Further Review and Revision Transaction Overview Transaction Steps Standalone Transaction Structure(1) • • Effective transaction date of 1/1/2019 AM acquires AMGP IDRs at 17.3x 2019E post-tax GP Cash Flow – Transaction funded with 100% equity AMGP remains a publicly traded C-corp – Sole asset is AM LP units Transaction triggers Series B conversion at AMGP transaction price (market) Assumes no synergies No basis step-up Pro forma AM targets standalone AM DPUs Growth capex funded according to standalone forecast Public Shareholders Sponsors • 59.2% Interest 40.8% Interest • • • • • AMGP AR Public Unitholders % IDR Interest 47.4% LP Interest AM Sources & Uses Pro Forma Transaction Structure(1) Public Shareholders Sponsors New AM Equity Issued f or GP/IDRs AM Cash $3,104 5 59.2% Interest 40.8% Interest AMGP AR Public Unitholders Purchase Price Paid f or GP/IDRs Transaction Fees and Expenses $3,104 5 9% LP Interest 30.4% LP Interest AM Source: Note: (1) Company filings, management projections, FactSet. Market data as of 9/7/2018. PF ownership assumes no cash election. Ownership percentages at effective transaction date of 1/1/2019. 21 33.7% LP Interest 52.6% LP Interest 35. Total Trans action Us e s$3,109 AM Us e s ($m m ) Total Trans action Source s$3,109 AM Source s ($m m ) 100
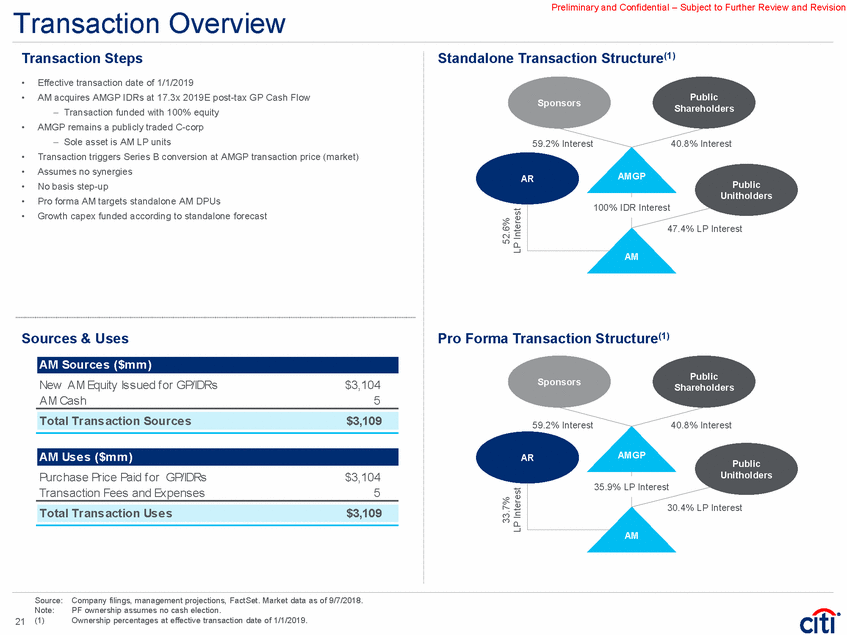
Preliminary and Confidential – Subject to Further Review and Revision AM Accretion / (Dilution) – GP / IDR Buy-In Accretion / (Dilution) at 17.3x 2019E Post-Tax GP/IDR Cash Flow 2019E 2020E Trans action Adjus tm e nts 2021E Trans action Adjus tm e nts Standalone AM Trans action Adjus tm e nts Pro Form a AM Standalone AM Pro Form a AM Standalone AM Pro Form a AM ($mm) Total EBITDA (-) Interest Expense (-) Maintenance Capex (-) Income Taxes (-) Other $988.6 (111.2) (39.4) (6.0) 0.0 $0.0 0.0 0.0 0.0 0.0 $988.6 (111.2) (39.4) (6.0) 0.0 $1,222.2 (140.1) (63.1) (6.0) 0.0 $0.0 0.4 0.0 0.0 0.0 $1,222.2 (139.7) (63.1) (6.0) 0.0 $1,413.5 (150.5) (43.9) (6.0) 0.0 $0.0 3.5 0.0 0.0 0.0 $1,413.5 (147.0) (43.9) (6.0) 0.0 Total Coverage Ratio (x) Total Cash Coverage ($mm) Total Distributions LP Distributions GP/IDR Distributions Average Units Outstanding (mm) 1.28x $183.2 648.8 413.4 235.4 187.045 1.29x $186.1 645.8 645.8 0.0 292.219 1.14x $124.8 888.2 533.1 355.1 187.045 1.22x $180.6 832.8 832.8 0.0 292.219 1.10x $111.7 1,101.4 639.7 461.8 187.045 1.22x $217.2 999.4 999.4 0.0 292.219 $3.0 $55.8 $105.6 105.173 105.173 105.173 Source: Company filings, management projections, FactSet. Market data as of 9/7/2018. 22 AM AM DCF pe r Unit ($) $2.70 $2.85 $3.18 $3.47 $3.72 $4.16 Accre tion / (Dilution) - ($) 0.15 0.28 0.44 Accre tion / (Dilution) - (%) 5.5% 8.9% 12.0% AM Dis tributions pe r Unit ($) $2.21 $2.21 $2.85 $2.85 $3.42 $3.42 Accre tion / (Dilution) - ($) 0.00 0.00 0.00 Accre tion / (Dilution) - (%) 0.0% 0.0% 0.0% YoY Grow th Rate - (%) 28.9% 29.0% 20.0% Total Cons olidate d De bt $2,411.6 $2,411.6 $2,980.0 $2,968.1 $3,249.7 $3,090.3 Cons olidate d Le ve rage (x) 2.4x 2.4x 2.4x 2.4x 2.3x 2.2x Dis tributable Cas h Flow $832.0 $832.0 $1,013.0 $1,013.5 $1,213.1 $1,216.6
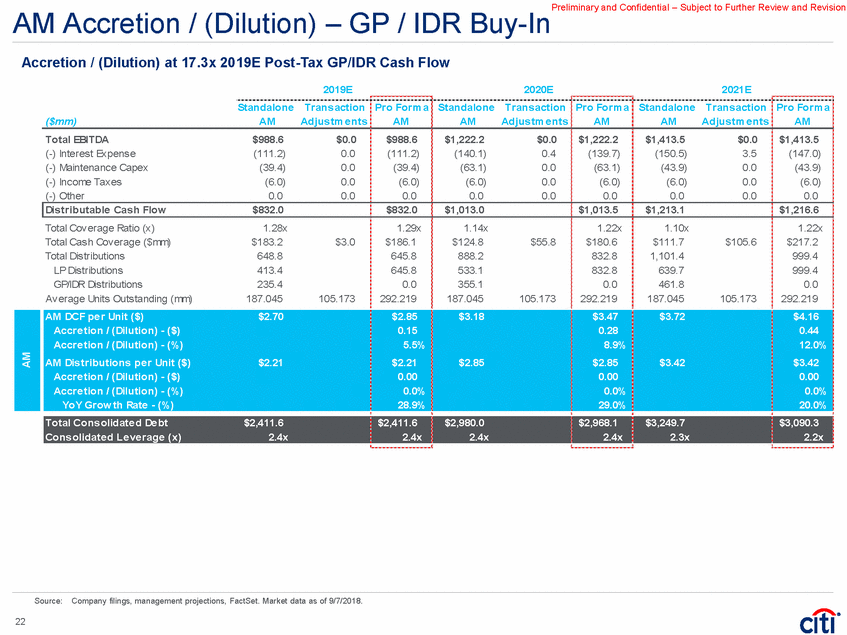
Preliminary and Confidential – Subject to Further Review and Revision AMGP Accretion / (Dilution) – GP / IDR Buy-In Accretion / (Dilution) at 17.3x 2019E Post-Tax GP/IDR Cash Flow 2019E 2020E 2021E Standalone Trans action Standalone Trans action Pro Form a AM GP Standalone Trans action Pro Form a AM GP Pro Form a AM GP ($mm) AM GP Adjus tm e nts AM GP Adjus tm e nts AM GP Adjus tm e nts Asset EBITDA (+) LP Distributions (+) GP / IDR Distributions $0.0 0.0 235.4 $0.0 232.4 (235.4) $0.0 232.4 0.0 $0.0 0.0 355.1 $0.0 299.7 (355.1) $0.0 299.7 0.0 $0.0 0.0 461.8 $0.0 359.7 (461.8) $0.0 359.7 0.0 (-) Interest Expense (-) Maintenance Capex (-) Series B Pref erred Distributions (-) Income Taxes (-) Other 0.0 0.0 (12.3) (56.0) (2.0) 0.0 0.0 12.3 (2.1) 0.0 0.0 0.0 0.0 (58.1) (2.0) 0.0 0.0 (19.5) (84.5) (2.0) 0.0 0.0 19.5 9.6 0.0 0.0 0.0 0.0 (74.9) (2.0) 0.0 0.0 (25.9) (109.9) (2.0) 0.0 0.0 25.9 20.0 0.0 0.0 0.0 0.0 (89.9) (2.0) Total Coverage Ratio (x) Total Cash Coverage ($mm) Total Dividends Average Shares Outstanding (mm) 1.00x ($0.1) 165.2 186.209 1.00x $0.0 172.3 190.209 1.00x ($0.2) 249.3 186.209 1.00x $0.0 222.8 190.209 1.00x ($0.3) 324.2 186.209 1.00x $0.0 267.8 190.209 $0.1 $0.2 $0.3 4.000 4.000 4.000 Source: Company filings, management projections, FactSet. Market data as of 9/7/2018. Note: Assumes no tax shield on LP distributions; subject to further diligence. 23 AMGP AM GP CAFD pe r Share ($) $0.89 $0.91 $1.34 $1.17 $1.74 $1.41 Accre tion / (Dilution) - ($) 0.02 (0.17) (0.33) Accre tion / (Dilution) - (%) 2.2% (12.4%) (19.1%) AM GP Divide nd pe r Share ($) $0.89 $0.91 $1.34 $1.17 $1.74 $1.41 Accre tion / (Dilution) - ($) 0.02 (0.17) (0.33) Accre tion / (Dilution) - (%) 2.1% (12.5%) (19.1%) YoY Grow th Rate - (%) 64.7% 68.2% 50.9% 29.3% 30.0% 20.2% Total De cons olidate d De bt $0.0 $0.0 $0.0 $0.0 $0.0 $0.0 De cons olidate d Le ve rage (x) 0.0x 0.0x 0.0x 0.0x 0.0x 0.0x Total Cons olidate d De bt $2,411.6 $2,411.6 $2,980.0 $2,968.1 $3,249.7 $3,090.3 Cons olidate d Le ve rage (x) 2.4x 2.4x 2.4x 2.4x 2.3x 2.2x Cas h Available for Divide nds $165.1 $172.3 $249.1 $222.8 $323.9 $267.8 Total EBITDA $235.4 ($3.0) $232.4 $355.1 ($55.4) $299.7 $461.8 ($102.1) $359.7
Preliminary and Confidential – Subject to Further Review and Revision D. AR Buys AMGP
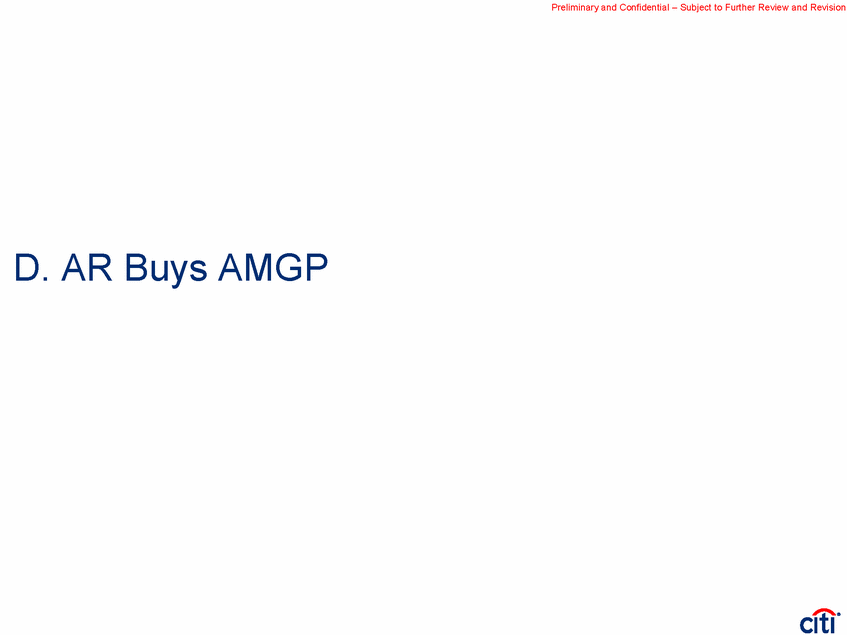
Preliminary and Confidential – Subject to Further Review and Revision AMGP and AR Relative Valuation Relative Valuation Potential AR / AMGP Acquisition Observations Significantly dilutive to AR stakeholders due to relative trading metrics even without a premium ($mm, unl ess noted otherwi se) @ M ark e t @ M ark e t AMGP stakeholders unlikely to desire E&P paper; may require significant cash raise by AR 52-w eek high-low ($) % of 52-week high 20-Day VWAP % of 20-Day VWAP Current Shares / Units Outstanding (mm) 22.69 – 16.31 75.7% $30.81 55.8% 320.309 22.39 – 14.85 74.7% $18.23 91.8% 186.209 Significant questions / investor confusion with using AR currency to buy midstream interests Does not fix cost-of-capital issues – second step likely required – Given AMGP is 100% IDR cash flows, no arbitrage on second step IDR clean-up (+) Implied Market Value of GP (1) (+) Total Debt (+) NCI (-) Inv. In Unconsol. Af f iliate (-) Cash and Equivalents --5,288.3 2,634 (359) (50.6) ---- ---- (5.3) AR holds no interest in AMGP today – requires consideration to all holders Highly complicated / uncertain execution with second step IDR transaction with AM and large share buyback program 2018E EBITDA ($mm) 2019E EBITDA ($mm) 2020E EBITDA ($mm) FV / 2018E EBITDA (x) FV / 2019E EBITDA (x) FV / 2020E EBITDA (x) 2018E DCF / LP Unit (CFPS) ($) 2019E DCF / LP Unit (CFPS) ($) 2020E DCF / LP Unit (CFPS) ($) Price / 2018E DCF (P / CFPS) (x) Price / 2019E DCF (P / CFPS) (x) Price / 2020E DCF (P / CFPS) (x) $1,985.0 2,542.3 2,587.6 $142.8 235.4 355.1 $5.40 6.97 7.22 $0.54 0.89 1.34 Source: Company fillings, management projections, FactSet. Market data as of 9/7/2018. (1) Firm Value of public GP – Market Value of LP Units held by GP – Value of Non-GP Businesses. 24 31.0x 18.9 12.5 3.2x 2.5 2.4 Relative valuation will cause significant dilution to AR; particularly if AMGP were acquired at a premium 21.8x 13.2 8.8 6.6x 5.1 5.0 Im plie d Firm Value ($m m )$13,015.5$3,110.0 Im plie d Equity LP M ark e t Value ($m m )$5,502.9$3,115.3 Share / Unit Price ($) as of 9/7/2018$17.18$16.73
Preliminary and Confidential – Subject to Further Review and Revision Appendix
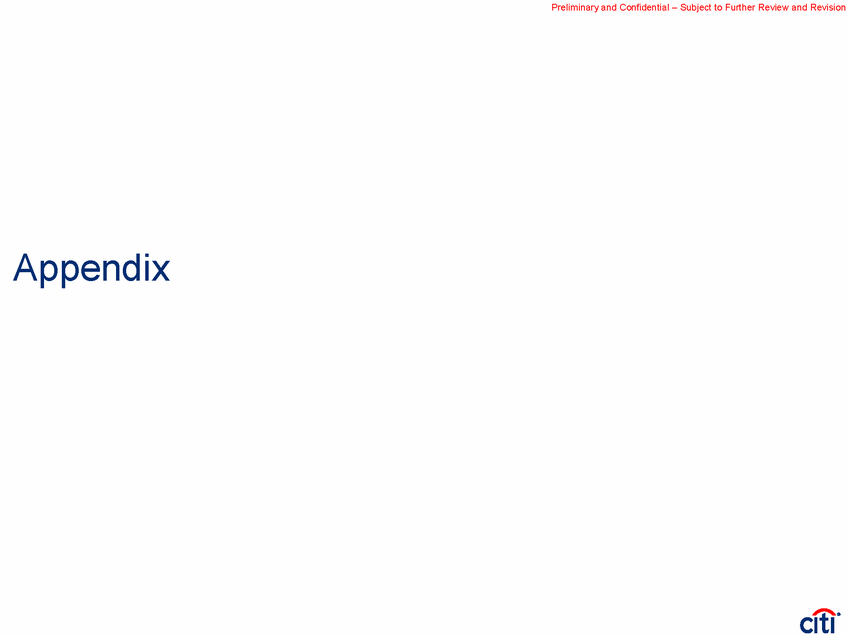
Preliminary and Confidential – Subject to Further Review and Revision Specific Stakeholder Considerations AMGP Buys AM AM Buys IDRs AM Buys AMGP AR Buys AMGP removes overhang C-corp benefits place – overhang for second- MLP structure not preferred Embedded c-corp / tax on IDR value Near-term dilution Maintains MLP structure / unitholders liquidity issues complicated Holdings now in more liquid Cost of capital issues remain control midstream 25 Macro Market Responsive to simplified Improved cost of capital Clean-up of structure / Creates alignment between midstream entities Complex structure remains inalignmentupstream and midstream and step transaction Reaction from stakeholders leakage Highly complicated execution Upfront DCF and DPU Potentially receives upfront Potentially receives upfront Potentially receives upfront accretionpremium (TBD)premium (TBD)premium (TBD) Increased coverage Accretive in near term Accretive in near term Holders likely uninterested in Tempered long-term growth Dilutive in later years Tempered long-term growthowning E&P shares Potential multiple contraction Tempered long-term growth C-corp under partnership Potential valuation implications Receives premium Long-term accretive, near- Improves cost of capital Holders likely uninterested in DPU held flat in near termterm dilution possible based May pay upfront premiumowning E&P shares Accretive in later years Dilutive transaction Potentially taxable to Does not improve coverage liquidity concerns remain Does not fix float or trading Structural complexities with c-corp underneath partnership Receives premium on AM Improves ability for MLP to Gains direct ownership stake Highest alignment with unitsfinance growth to servein control entitymidstream Cash received depends onupstream Receives no upfront premium Relative valuation / dilutive final consideration mix Structure remains No cash receivedtransaction security AMGP remains outstanding(requires second step Increases alignment withwith no AR ownership /transaction) Taxable transaction Series B Unitholders Benefit from larger entity size May trigger change of control May trigger change of control May trigger change of control given anti-dilution mechanismaccelerationaccelerationacceleration Requires buyout Buyout value vs. status quo
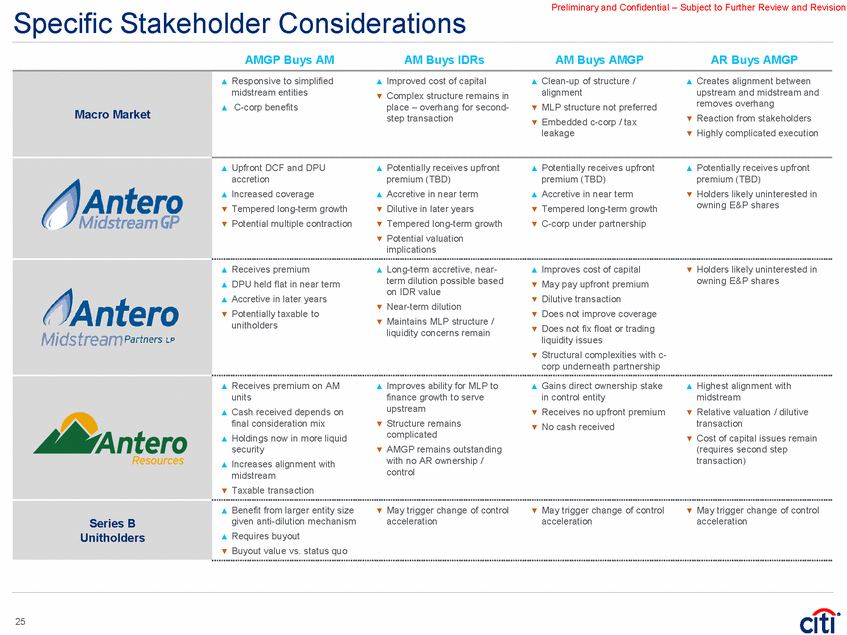
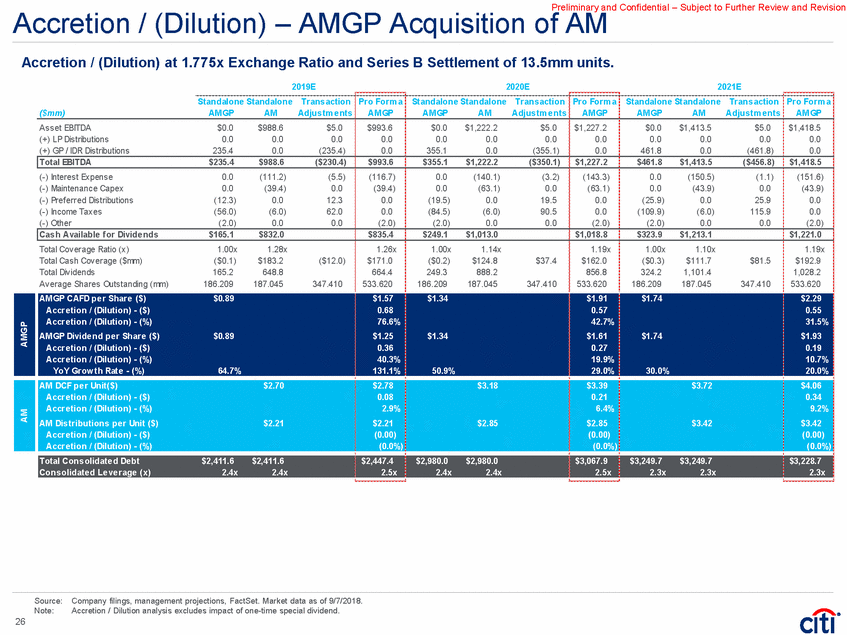
Preliminary and Confidential – Subject to Further Review and Revision Accretion / (Dilution) – AMGP Acquisition of AM Accretion / (Dilution) at 1.775x Exchange Ratio and Series B Settlement of 13.5mm units. 2019E Standalone Standalone Trans action 2020E Standalone Standalone Trans action 2021E Standalone Standalone Trans action Pro Form a AM GP Pro Form a AM GP Pro Form a AM GP ($mm) AM GP AM Adjus tm e nts AM GP AM Adjus tm e nts AM GP AM Adjus tm e nts Asset EBITDA (+) LP Distributions (+) GP / IDR Distributions $0.0 0.0 235.4 $988.6 0.0 0.0 $5.0 0.0 (235.4) $993.6 0.0 0.0 $0.0 0.0 355.1 $1,222.2 0.0 0.0 $5.0 0.0 (355.1) $1,227.2 0.0 0.0 $0.0 0.0 461.8 $1,413.5 0.0 0.0 $5.0 0.0 (461.8) $1,418.5 0.0 0.0 (-) Interest Expense (-) Maintenance Capex (-) Pref erred Distributions (-) Income Taxes (-) Other 0.0 0.0 (12.3) (56.0) (2.0) (111.2) (39.4) 0.0 (6.0) 0.0 (5.5) 0.0 12.3 62.0 0.0 (116.7) (39.4) 0.0 0.0 (2.0) 0.0 0.0 (19.5) (84.5) (2.0) (140.1) (63.1) 0.0 (6.0) 0.0 (3.2) 0.0 19.5 90.5 0.0 (143.3) (63.1) 0.0 0.0 (2.0) 0.0 0.0 (25.9) (109.9) (2.0) (150.5) (43.9) 0.0 (6.0) 0.0 (1.1) 0.0 25.9 115.9 0.0 (151.6) (43.9) 0.0 0.0 (2.0) Total Coverage Ratio (x) Total Cash Coverage ($mm) Total Dividends Average Shares Outstanding (mm) 1.00x ($0.1) 165.2 186.209 1.28x $183.2 648.8 187.045 1.26x $171.0 664.4 533.620 1.00x ($0.2) 249.3 186.209 1.14x $124.8 888.2 187.045 1.19x $162.0 856.8 533.620 1.00x ($0.3) 324.2 186.209 1.10x $111.7 1,101.4 187.045 1.19x $192.9 1,028.2 533.620 ($12.0) $37.4 $81.5 347.410 347.410 347.410 Source: Company filings, management projections, FactSet. Market data as of 9/7/2018. Note: Accretion / Dilution analysis excludes impact of one-time special dividend. 26 AMGP AM GP CAFD pe r Share ($) $0.89 $1.57 $1.34 $1.91 $1.74 $2.29 Accre tion / (Dilution) - ($) 0.68 0.57 0.55 Accre tion / (Dilution) - (%) 76.6% 42.7% 31.5% AM GP Divide nd pe r Share ($) $0.89 $1.25 $1.34 $1.61 $1.74 $1.93 Accre tion / (Dilution) - ($) 0.36 0.27 0.19 Accre tion / (Dilution) - (%) 40.3% 19.9% 10.7% YoY Grow th Rate - (%) 64.7% 131.1% 50.9% 29.0% 30.0% 20.0% AM AM DCF pe r Unit($) $2.70 $2.78 $3.18 $3.39 $3.72 $4.06 Accre tion / (Dilution) - ($) 0.08 0.21 0.34 Accre tion / (Dilution) - (%) 2.9% 6.4% 9.2% AM Dis tributions pe r Unit ($) $2.21 $2.21 $2.85 $2.85 $3.42 $3.42 Accre tion / (Dilution) - ($) (0.00) (0.00) (0.00) Accre tion / (Dilution) - (%) (0.0%) (0.0%) (0.0%) Total Cons olidate d De bt $2,411.6 $2,411.6 $2,447.4 $2,980.0 $2,980.0 $3,067.9 $3,249.7 $3,249.7 $3,228.7 Cons olidate d Le ve rage (x) 2.4x 2.4x 2.5x 2.4x 2.4x 2.5x 2.3x 2.3x 2.3x Cas h Available for Divide nds $165.1 $832.0 $835.4 $249.1 $1,013.0 $1,018.8 $323.9 $1,213.1 $1,221.0 Total EBITDA $235.4 $988.6 ($230.4) $993.6 $355.1 $1,222.2 ($350.1) $1,227.2 $461.8 $1,413.5 ($456.8) $1,418.5
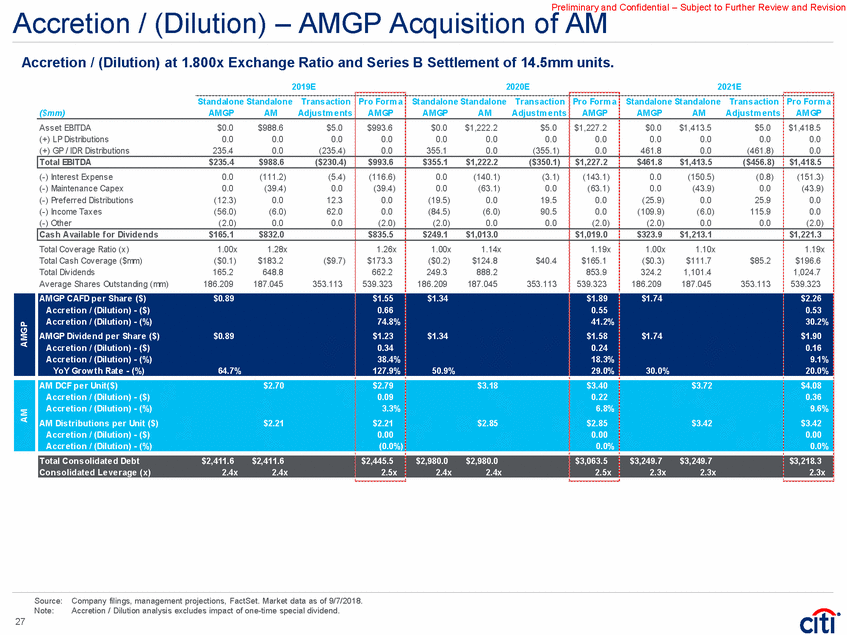
Preliminary and Confidential – Subject to Further Review and Revision Accretion / (Dilution) – AMGP Acquisition of AM Accretion / (Dilution) at 1.800x Exchange Ratio and Series B Settlement of 14.5mm units. 2019E Standalone Standalone Trans action 2020E Standalone Standalone Trans action 2021E Standalone Standalone Trans action Pro Form a AM GP Pro Form a AM GP Pro Form a AM GP ($mm) AM GP AM Adjus tm e nts AM GP AM Adjus tm e nts AM GP AM Adjus tm e nts Asset EBITDA (+) LP Distributions (+) GP / IDR Distributions $0.0 0.0 235.4 $988.6 0.0 0.0 $5.0 0.0 (235.4) $993.6 0.0 0.0 $0.0 0.0 355.1 $1,222.2 0.0 0.0 $5.0 0.0 (355.1) $1,227.2 0.0 0.0 $0.0 0.0 461.8 $1,413.5 0.0 0.0 $5.0 0.0 (461.8) $1,418.5 0.0 0.0 (-) Interest Expense (-) Maintenance Capex (-) Pref erred Distributions (-) Income Taxes (-) Other 0.0 0.0 (12.3) (56.0) (2.0) (111.2) (39.4) 0.0 (6.0) 0.0 (5.4) 0.0 12.3 62.0 0.0 (116.6) (39.4) 0.0 0.0 (2.0) 0.0 0.0 (19.5) (84.5) (2.0) (140.1) (63.1) 0.0 (6.0) 0.0 (3.1) 0.0 19.5 90.5 0.0 (143.1) (63.1) 0.0 0.0 (2.0) 0.0 0.0 (25.9) (109.9) (2.0) (150.5) (43.9) 0.0 (6.0) 0.0 (0.8) 0.0 25.9 115.9 0.0 (151.3) (43.9) 0.0 0.0 (2.0) Total Coverage Ratio (x) Total Cash Coverage ($mm) Total Dividends Average Shares Outstanding (mm) 1.00x ($0.1) 165.2 186.209 1.28x $183.2 648.8 187.045 1.26x $173.3 662.2 539.323 1.00x ($0.2) 249.3 186.209 1.14x $124.8 888.2 187.045 1.19x $165.1 853.9 539.323 1.00x ($0.3) 324.2 186.209 1.10x $111.7 1,101.4 187.045 1.19x $196.6 1,024.7 539.323 ($9.7) $40.4 $85.2 353.113 353.113 353.113 Source: Company filings, management projections, FactSet. Market data as of 9/7/2018. Note: Accretion / Dilution analysis excludes impact of one-time special dividend. 27 AMGP AM GP CAFD pe r Share ($) $0.89 $1.55 $1.34 $1.89 $1.74 $2.26 Accre tion / (Dilution) - ($) 0.66 0.55 0.53 Accre tion / (Dilution) - (%) 74.8% 41.2% 30.2% AM GP Divide nd pe r Share ($) $0.89 $1.23 $1.34 $1.58 $1.74 $1.90 Accre tion / (Dilution) - ($) 0.34 0.24 0.16 Accre tion / (Dilution) - (%) 38.4% 18.3% 9.1% YoY Grow th Rate - (%) 64.7% 127.9% 50.9% 29.0% 30.0% 20.0% AM AM DCF pe r Unit($) $2.70 $2.79 $3.18 $3.40 $3.72 $4.08 Accre tion / (Dilution) - ($) 0.09 0.22 0.36 Accre tion / (Dilution) - (%) 3.3% 6.8% 9.6% AM Dis tributions pe r Unit ($) $2.21 $2.21 $2.85 $2.85 $3.42 $3.42 Accre tion / (Dilution) - ($) 0.00 0.00 0.00 Accre tion / (Dilution) - (%) (0.0%) 0.0% 0.0% Total Cons olidate d De bt $2,411.6 $2,411.6 $2,445.5 $2,980.0 $2,980.0 $3,063.5 $3,249.7 $3,249.7 $3,218.3 Cons olidate d Le ve rage (x) 2.4x 2.4x 2.5x 2.4x 2.4x 2.5x 2.3x 2.3x 2.3x Cas h Available for Divide nds $165.1 $832.0 $835.5 $249.1 $1,013.0 $1,019.0 $323.9 $1,213.1 $1,221.3 Total EBITDA $235.4 $988.6 ($230.4) $993.6 $355.1 $1,222.2 ($350.1) $1,227.2 $461.8 $1,413.5 ($456.8) $1,418.5
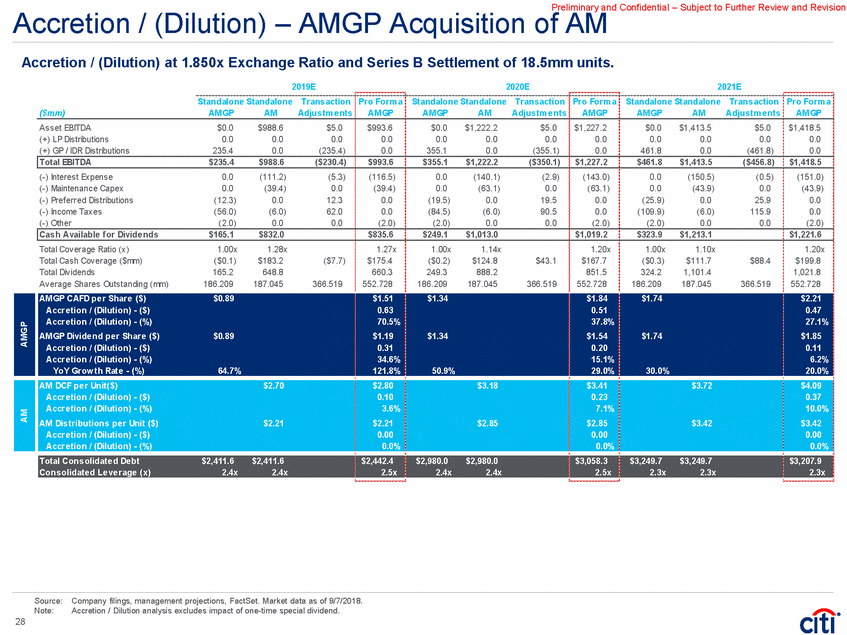
Preliminary and Confidential – Subject to Further Review and Revision Accretion / (Dilution) – AMGP Acquisition of AM Accretion / (Dilution) at 1.850x Exchange Ratio and Series B Settlement of 18.5mm units. 2019E Standalone Standalone Trans action 2020E Standalone Standalone Trans action 2021E Standalone Standalone Trans action Pro Form a AM GP Pro Form a AM GP Pro Form a AM GP ($mm) AM GP AM Adjus tm e nts AM GP AM Adjus tm e nts AM GP AM Adjus tm e nts Asset EBITDA (+) LP Distributions (+) GP / IDR Distributions $0.0 0.0 235.4 $988.6 0.0 0.0 $5.0 0.0 (235.4) $993.6 0.0 0.0 $0.0 0.0 355.1 $1,222.2 0.0 0.0 $5.0 0.0 (355.1) $1,227.2 0.0 0.0 $0.0 0.0 461.8 $1,413.5 0.0 0.0 $5.0 0.0 (461.8) $1,418.5 0.0 0.0 (-) Interest Expense (-) Maintenance Capex (-) Pref erred Distributions (-) Income Taxes (-) Other 0.0 0.0 (12.3) (56.0) (2.0) (111.2) (39.4) 0.0 (6.0) 0.0 (5.3) 0.0 12.3 62.0 0.0 (116.5) (39.4) 0.0 0.0 (2.0) 0.0 0.0 (19.5) (84.5) (2.0) (140.1) (63.1) 0.0 (6.0) 0.0 (2.9) 0.0 19.5 90.5 0.0 (143.0) (63.1) 0.0 0.0 (2.0) 0.0 0.0 (25.9) (109.9) (2.0) (150.5) (43.9) 0.0 (6.0) 0.0 (0.5) 0.0 25.9 115.9 0.0 (151.0) (43.9) 0.0 0.0 (2.0) Total Coverage Ratio (x) Total Cash Coverage ($mm) Total Dividends Average Shares Outstanding (mm) 1.00x ($0.1) 165.2 186.209 1.28x $183.2 648.8 187.045 1.27x $175.4 660.3 552.728 1.00x ($0.2) 249.3 186.209 1.14x $124.8 888.2 187.045 1.20x $167.7 851.5 552.728 1.00x ($0.3) 324.2 186.209 1.10x $111.7 1,101.4 187.045 1.20x $199.8 1,021.8 552.728 ($7.7) $43.1 $88.4 366.519 366.519 366.519 Source: Company filings, management projections, FactSet. Market data as of 9/7/2018. Note: Accretion / Dilution analysis excludes impact of one-time special dividend. 28 AMGP AM GP CAFD pe r Share ($) $0.89 $1.51 $1.34 $1.84 $1.74 $2.21 Accre tion / (Dilution) - ($) 0.63 0.51 0.47 Accre tion / (Dilution) - (%) 70.5% 37.8% 27.1% AM GP Divide nd pe r Share ($) $0.89 $1.19 $1.34 $1.54 $1.74 $1.85 Accre tion / (Dilution) - ($) 0.31 0.20 0.11 Accre tion / (Dilution) - (%) 34.6% 15.1% 6.2% YoY Grow th Rate - (%) 64.7% 121.8% 50.9% 29.0% 30.0% 20.0% AM AM DCF pe r Unit($) $2.70 $2.80 $3.18 $3.41 $3.72 $4.09 Accre tion / (Dilution) - ($) 0.10 0.23 0.37 Accre tion / (Dilution) - (%) 3.6% 7.1% 10.0% AM Dis tributions pe r Unit ($) $2.21 $2.21 $2.85 $2.85 $3.42 $3.42 Accre tion / (Dilution) - ($) 0.00 0.00 0.00 Accre tion / (Dilution) - (%) 0.0% 0.0% 0.0% Total Cons olidate d De bt $2,411.6 $2,411.6 $2,442.4 $2,980.0 $2,980.0 $3,058.3 $3,249.7 $3,249.7 $3,207.9 Cons olidate d Le ve rage (x) 2.4x 2.4x 2.5x 2.4x 2.4x 2.5x 2.3x 2.3x 2.3x Cas h Available for Divide nds $165.1 $832.0 $835.6 $249.1 $1,013.0 $1,019.2 $323.9 $1,213.1 $1,221.6 Total EBITDA $235.4 $988.6 ($230.4) $993.6 $355.1 $1,222.2 ($350.1) $1,227.2 $461.8 $1,413.5 ($456.8) $1,418.5
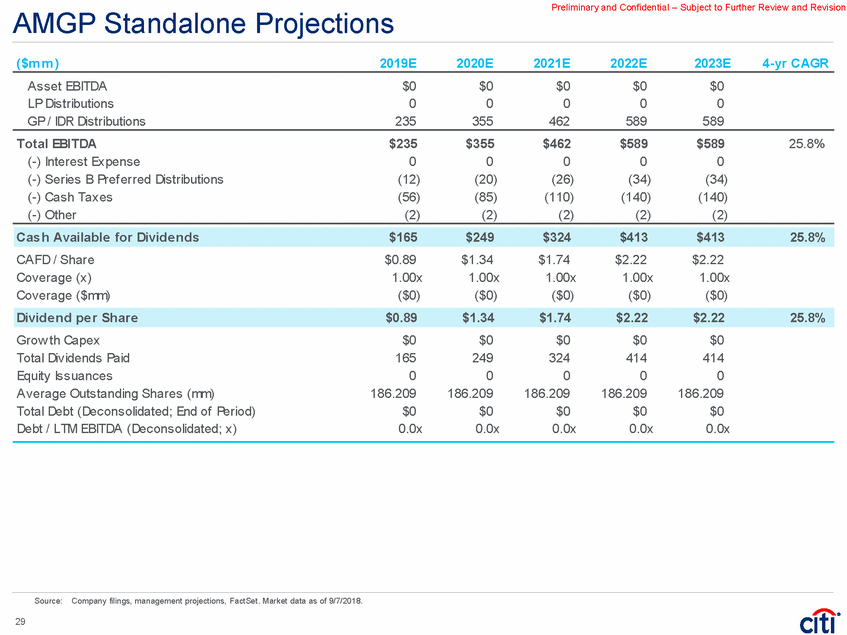
Preliminary and Confidential – Subject to Further Review and Revision AMGP Standalone Projections ($m m ) 2019E 2020E 2021E 2022E 2023E 4-yr CAGR Asset EBITDA LP Distributions GP / IDR Distributions $0 0 235 $0 0 355 $0 0 462 $0 0 589 $0 0 589 Total EBITDA (-) Interest Expense (-) Series B Pref erred Distributions (-) Cash Taxes (-) Other $235 0 (12) (56) (2) $355 0 (20) (85) (2) $462 0 (26) (110) (2) $589 0 (34) (140) (2) $589 0 (34) (140) (2) 25.8% CAFD / Share Coverage (x) Coverage ($mm) $0.89 1.00x ($0) $1.34 1.00x ($0) $1.74 1.00x ($0) $2.22 1.00x ($0) $2.22 1.00x ($0) Grow th Capex Total Dividends Paid Equity Issuances Average Outstanding Shares (mm) Total Debt (Deconsolidated; End of Period) Debt / LTM EBITDA (Deconsolidated; x) $0 165 0 186.209 $0 0.0x $0 249 0 186.209 $0 0.0x $0 324 0 186.209 $0 0.0x $0 414 0 186.209 $0 0.0x $0 414 0 186.209 $0 0.0x Source: Company filings, management projections, FactSet. Market data as of 9/7/2018. 29 Divide nd pe r Share$0.89$1.34$1.74$2.22$2.2225.8% Cas h Available for Divide nds$165$249$324$413$41325.8%
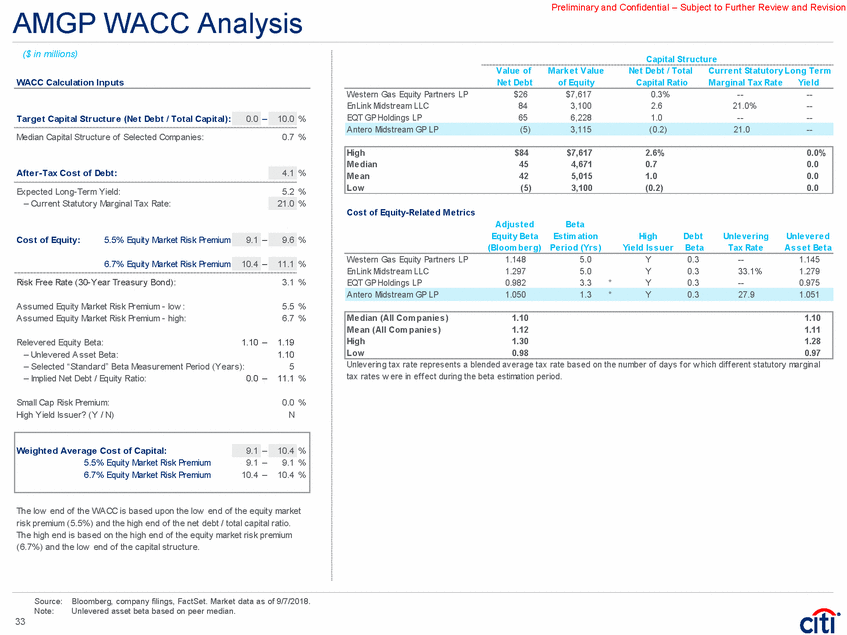
Preliminary and Confidential – Subject to Further Review and Revision AM Standalone Projections ($m m ) 2019E 2020E 2021E 2022E 2023E 4-yr CAGR EBITDA (-) Interest Expense (-) Maintenance Capex (-) Cash Taxes (-) Other $989 (111) (39) (6) 0 $1,222 (140) (63) (6) 0 $1,413 (151) (44) (6) 0 $1,642 (179) (58) (6) 0 $1,642 (185) (58) (6) 0 13.5% DCF / LP Unit Coverage (x) Coverage ($mm) $2.70 1.28x $183 $3.18 1.14x $125 $3.72 1.10x $112 $4.22 1.03x $44 $4.20 1.03x $38 Grow th Capex Total Distributions Paid Equity Issuances Average Outstanding Common Units (mm) Total Debt (End of Period) Debt / LTM EBITDA (x) $815 649 0 187.045 $2,412 2.4x $719 888 0 187.045 $2,980 2.4x $430 1,101 0 187.045 $3,250 2.3x $352 1,356 0 187.045 $3,822 2.3x $352 1,356 0 187.045 $3,873 2.4x Source: Company filings, management projections, FactSet. Market data as of 9/7/2018. 30 Dis tribution pe r Com m on Unit$2.21$2.85$3.42$4.10$4.1016.7% Dis tributable Cas h Flow$832$1,013$1,213$1,400$1,39313.8%
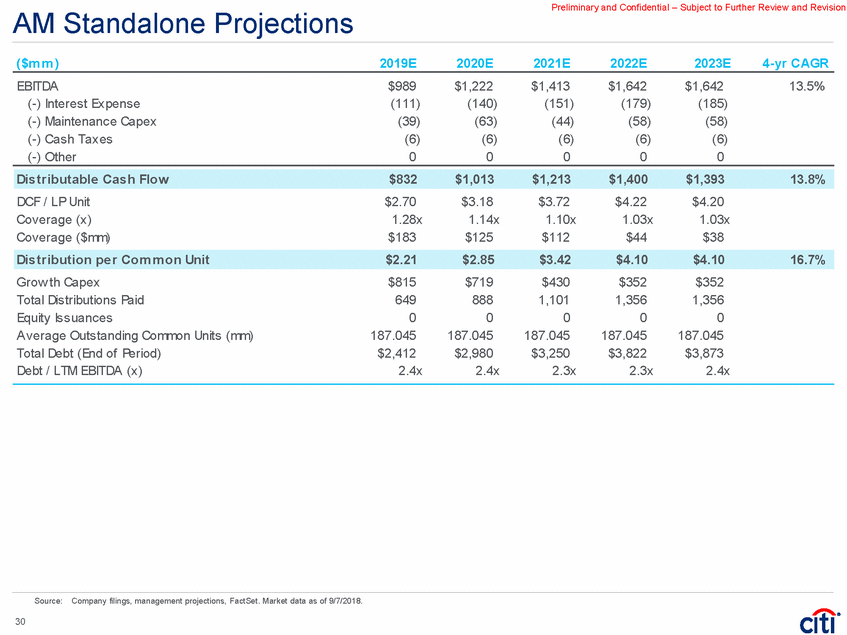
Preliminary and Confidential – Subject to Further Review and Revision Stress Testing Series B Holders' Presented DCF Calculation Cash Flow Summary – As Presented by Series B Holders ($mm, unless otherwise noted) 2018E 2019E 2020E 2021E 2022E 2023E 2024E 2025E 2026E Series B Distributions - Declared $7 $12 $19 $26 $33 $38 $42 $46 $50 Year-Over-Year Growth 82% 58% 33% 29% 13% 12% 10% 8% Series B Distributions - Payable(1) Year-Over-Year Growth $1 $9 695% $23 157% $25 8% $32 27% $37 16% $41 12% $45 10% $49 8% Terminal Value – As Presented by Series B Holders ($mm, unless otherwise noted) Sensitivity Analysis – Cash Flow + Terminal Value Im plie d Value ($m m ) Cos t of Equity Series B Distributions - Declared (÷) Series B Prof its Interest (+) Series B Prof its Interest Annual Cash Threshold $48 5.9% $30 8.0% 10.0% 12.0% 14.0% 6.0% 8.0 10.0 12.0 Implied IDR Cash Flow (-) Series B Cash Flow (-) G&A Pre Tax AMGP Cash Flow (-) Taxes AMGP Cash Available f or Distribution (÷) Assumed Exit Yield $840 (48) (2) 790 (200) 590 8% Im plie d Value ($m m ) Cos t of Equity 8.0% 10.0% 12.0% 14.0% 0.0% 0.9 1.9 2.9 AM GP Value (-) $2.0 Billion Threshold (x) Series B Prof its Interest 7,377 2,000 5.9% AM GP Value (÷) 2026 Discount Rate Factor(3) 319 1.914 Source: (1) (2) (3) Series B Discussion Materials Presented by Series B Holders (as presented 8/9/2018). Assumes a one quarter lag in distributions paid (i.e. first quarter declared distribution paid in second quarter) and vesting schedule of Series B units. Discount rate factor based on 8.0% discount rate and mid-year discounting convention. Discounted at AMGP WACC of 8.0% and assumes year-end 2026 discounting. 31 Terminal Growth Decline Exit Yield Se rie s B Dis counte d Te rm inal Value$166 $339 $323 $308 $295 337 321 307 294 335 319 305 293 333 318 304 292 $412 $395 $381 $369 335 319 305 293 290 274 260 247 259 243 229 217 DCF at Cos t of Equity of 8.0%(2) $169
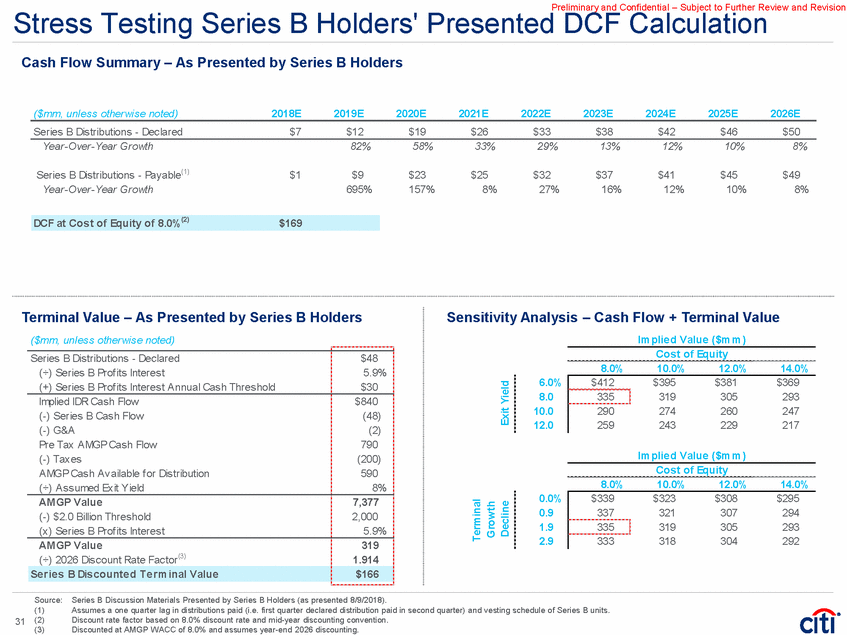
Preliminary and Confidential – Subject to Further Review and Revision AM WACC Analysis ($ in millions) Capital Structure Value of Ne t De bt M ark e t Value of Equity Ne t De bt / Total Capital Ratio Curre nt Statutory Long Te rm WACC Calculation Inputs M arginal Tax Rate Yie ld Western Gas Partners, LP EQT Midstream Partners LP Targa Resources Corp. DCP Midstream LP EnLink Midstream Partners, L.P. Enable Midstream Partners LP Crestw ood Equity Partners LP Summit Midstream Partners LP $4,124 2,983 5,291 4,831 3,953 3,700 1,556 1,593 $13,505 11,775 14,375 8,861 8,962 7,224 3,719 1,701 23.4% 20.2 26.9 35.3 30.6 33.9 29.5 48.4 ---- 21.0% ---- ---- --4.8% 5.1 5.5 5.1 5.3 5.1 5.4 6.5 Targe t Capital Structure (Ne t De bt / Total Capital): – % Median Capital Structure of Selected Companies: 29.5 % Afte r-Tax Cos t of De bt: Expected Long-Term Yield: – Current Statutory Marginal Tax Rate: % 5.0 % % Cos t of Equity: 5.5% Equity Market Risk Premium – % 6.7% Equity Market Risk Premium – % Cos t of Equity-Re late d M e trics Risk Free Rate (30-Year Treasury Bond): 3.1 % Adjus te d Equity Be ta (Bloom be rg) Be ta Es tim ation Pe riod (Yrs ) High Yie ld Is s ue r De bt Be ta Unle ve ring Tax Rate Unle ve re d As s e t Be ta Assumed Equity Market Risk Premium - low : Assumed Equity Market Risk Premium - high: 5.5 % 6.7 % Western Gas Partners, LP EQT Midstream Partners LP Targa Resources Corp. DCP Midstream LP EnLink Midstream Partners, L.P. Enable Midstream Partners LP Crestw ood Equity Partners LP Summit Midstream Partners LP 1.127 1.025 1.651 1.272 1.226 1.341 1.353 1.295 5.0 5.0 5.0 5.0 5.0 4.4 5.0 5.0 0.0 0.3 0.3 0.3 0.3 0.0 0.3 0.3 ---- 33.1% ---- ---- --0.863 0.878 1.384 0.929 0.942 0.886 1.042 0.814 Y Y Y Y Relevered Equity Beta: – Unlevered Asset Beta: 1.09 – 1.18 1.01 5 25.0 % – Selected “Standard” Beta Measurement Period (Years): * – Implied Net Debt / Equity Ratio: 11.1 – Y Y Small Cap Risk Premium: High Yield Issuer? (Y / N) 0.0 % Y 5.5% Equity Market Risk Premium 8.6 – 8.7 % Unlevering tax rate represents a blended average tax rate based on the number of days f or w hich dif f erent statutory marginal tax rates w ere in ef f ect during the beta estimation period. The low end of the WACC is based upon the low end of the equity market risk premium (5.5%) and the high end of the net debt / total capital ratio. The high end is based on the high end of the equity market risk premium (6.7%) and the low end of the capital structure. Source: Bloomberg, company filings, FactSet. Market data as of 9/7/2018. 32 We ighte d Ave rage Cos t of Capital:–% 6.7% Equity Market Risk Premium9.8 –9.8 % 9.8 8.6 M e dian (All Com panie s ) 1.27 0.93 M e an (All Com panie s ) 1.27 0.97 High 1.65 1.38 Low 1.02 0.81 Antero Midstream Partners LP 1.121 3.8 * Y 0.3 --1.007 11.0 10.3 9.6 9.0 High $5,291 $14,375 48.4% 6.5% M e dian 3,700 8,861 29.5 5.1 M e an 3,269 8,754 29.1 5.3 Low 1,392 1,701 13.8 4.8 0.0 Antero Midstream Partners LP 1,392 8,661 13.8 --5.0 5.0 20.0 10.0
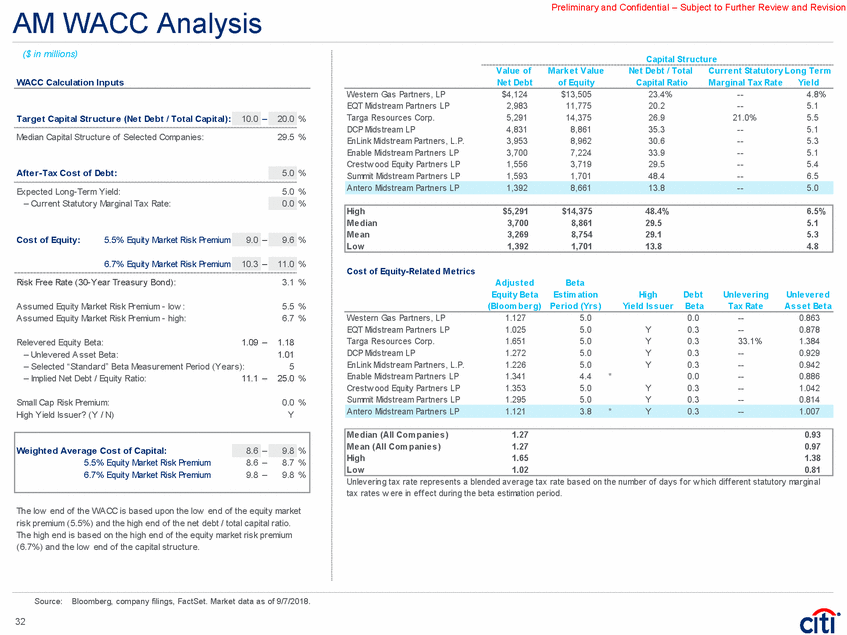
Preliminary and Confidential – Subject to Further Review and Revision AMGP WACC Analysis ($ in millions) Capital Structure Value of Ne t De bt M ark e t Value of Equity Ne t De bt / Total Capital Ratio Curre nt Statutory Long Te rm WACC Calculation Inputs M arginal Tax Rate Yie ld Western Gas Equity Partners LP EnLink Midstream LLC EQT GP Holdings LP $26 84 65 $7,617 3,100 6,228 0.3% 2.6 1.0 --21.0% ---- ---- Targe t Capital Structure (Ne t De bt / Total Capital): – % Median Capital Structure of Selected Companies: 0.7 % Afte r-Tax Cos t of De bt: Expected Long-Term Yield: – Current Statutory Marginal Tax Rate: % 5.2 % % Cos t of Equity-Re late d M e trics Adjus te d Equity Be ta (Bloom be rg) Be ta Es tim ation Pe riod (Yrs ) High Yie ld Is s ue r De bt Be ta Unle ve ring Tax Rate Unle ve re d As s e t Be ta Cos t of Equity: 5.5% Equity Market Risk Premium – % Western Gas Equity Partners LP EnLink Midstream LLC EQT GP Holdings LP 1.148 1.297 0.982 5.0 5.0 3.3 Y Y Y 0.3 0.3 0.3 --33.1% --1.145 1.279 0.975 6.7% Equity Market Risk Premium – % Risk Free Rate (30-Year Treasury Bond): 3.1 % * Assumed Equity Market Risk Premium - low : Assumed Equity Market Risk Premium - high: 5.5 % 6.7 % Relevered Equity Beta: – Unlevered Asset Beta: 1.10 – 1.19 1.10 5 11.1 % Unlevering tax rate represents a blended average tax rate based on the number of days f or w hich dif f erent statutory marginal tax rates w ere in ef f ect during the beta estimation period. – Selected “Standard” Beta Measurement Period (Years): – Implied Net Debt / Equity Ratio: 0.0 – Small Cap Risk Premium: High Yield Issuer? (Y / N) 0.0 % N The low end of the WACC is based upon the low end of the equity market risk premium (5.5%) and the high end of the net debt / total capital ratio. The high end is based on the high end of the equity market risk premium (6.7%) and the low end of the capital structure. Source: Bloomberg, company filings, FactSet. Market data as of 9/7/2018. Note: Unlevered asset beta based on peer median. 33 We ighte d Ave rage Cos t of Capital:–% 5.5% Equity Market Risk Premium9.1 –9.1 % 6.7% Equity Market Risk Premium10.4 – 10.4 % 10.4 9.1 M e dian (All Com panie s ) 1.10 1.10 M e an (All Com panie s ) 1.12 1.11 High 1.30 1.28 Low 0.98 0.97 Antero Midstream GP LP 1.050 1.3 * Y 0.3 27.9 1.051 11.1 10.4 9.6 9.1 21.0 4.1 High $84 $7,617 2.6% 0.0% M e dian 45 4,671 0.7 0.0 M e an 42 5,015 1.0 0.0 Low (5) 3,100 (0.2) 0.0 Antero Midstream GP LP (5) 3,115 (0.2) 21.0 --10.0 0.0
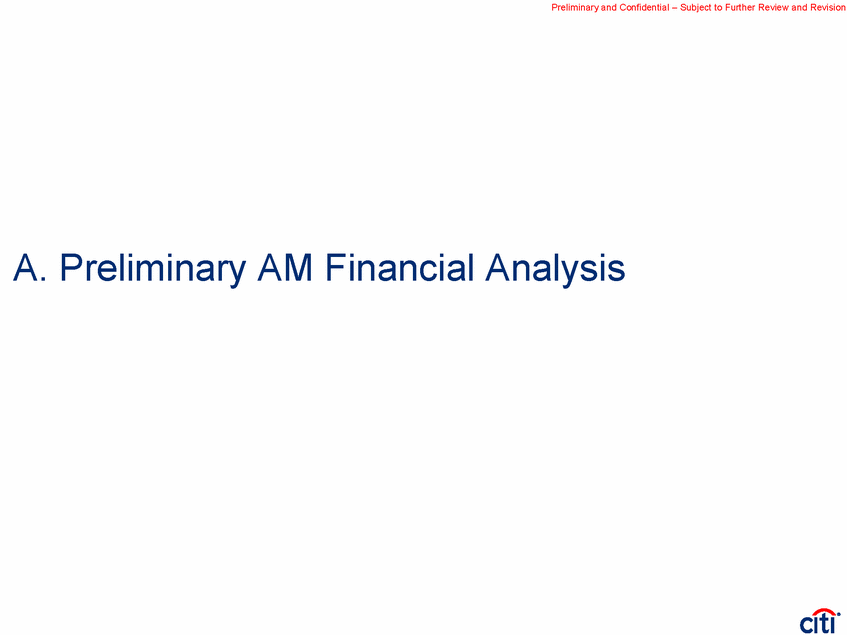
Preliminary and Confidential – Subject to Further Review and Revision A. Preliminary AM Financial Analysis
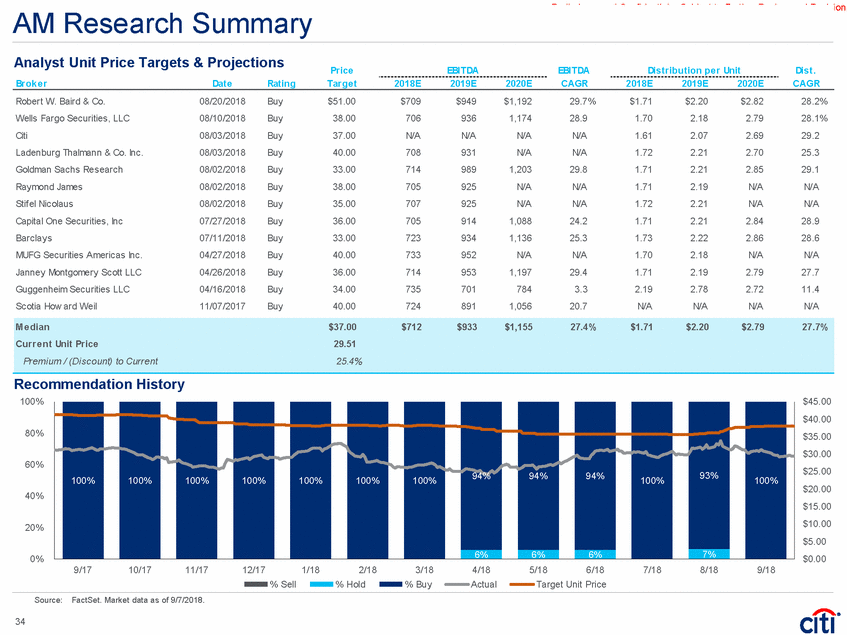
Preliminary and Confidential – Subject to Further Review and Revision AM Research Summary Analyst Unit Price Targets & Projections Price Targe t EBITDA 2019E EBITDA CAGR Dis tribution pe r Unit Dis t. CAGR Brok e r Date Rating 2018E 2020E 2018E 2019E 2020E Robert W. Baird & Co. Wells Fargo Securities, LLC Citi Ladenburg Thalmann & Co. Inc. Goldman Sachs Research Raymond James Stif el Nicolaus Capital One Securities, Inc Barclays MUFG Securities Americas Inc. Janney Montgomery Scott LLC Guggenheim Securities LLC Scotia How ard Weil 08/20/2018 08/10/2018 08/03/2018 08/03/2018 08/02/2018 08/02/2018 08/02/2018 07/27/2018 07/11/2018 04/27/2018 04/26/2018 04/16/2018 11/07/2017 Buy Buy Buy Buy Buy Buy Buy Buy Buy Buy Buy Buy Buy $51.00 38.00 37.00 40.00 33.00 38.00 35.00 36.00 33.00 40.00 36.00 34.00 40.00 $709 706 N/A 708 714 705 707 705 723 733 714 735 724 $949 936 N/A 931 989 925 925 914 934 952 953 701 891 $1,192 1,174 N/A N/A 1,203 N/A N/A 1,088 1,136 N/A 1,197 784 1,056 29.7% 28.9 N/A N/A 29.8 N/A N/A 24.2 25.3 N/A 29.4 3.3 20.7 $1.71 1.70 1.61 1.72 1.71 1.71 1.72 1.71 1.73 1.70 1.71 2.19 N/A $2.20 2.18 2.07 2.21 2.21 2.19 2.21 2.21 2.22 2.18 2.19 2.78 N/A $2.82 2.79 2.69 2.70 2.85 N/A N/A 2.84 2.86 N/A 2.79 2.72 N/A 28.2% 28.1% 29.2 25.3 29.1 N/A N/A 28.9 28.6 N/A 27.7 11.4 N/A Recommendation History 100% $45.00 $40.00 $35.00 $30.00 $25.00 $20.00 $15.00 $10.00 $5.00 $0.00 80% 60% 40% 20% 0% 9/17 10/17 11/17 12/17 1/18 2/18 % Hold 3/18 % Buy 4/18 Actual 5/18 6/18 7/18 8/18 9/18 % Sell Target Unit Price Source: FactSet. Market data as of 9/7/2018. 34 100% 100% 100% 100% 100% 100% 100% 94% 94% 94% 100% 93% 100% 6% 6% 6% 7% M e dian$37.00$712$933$1,15527.4%$1.71$2.20$2.7927.7% Curre nt Unit Price29.51 Premium / (Discount) to Current25.4%
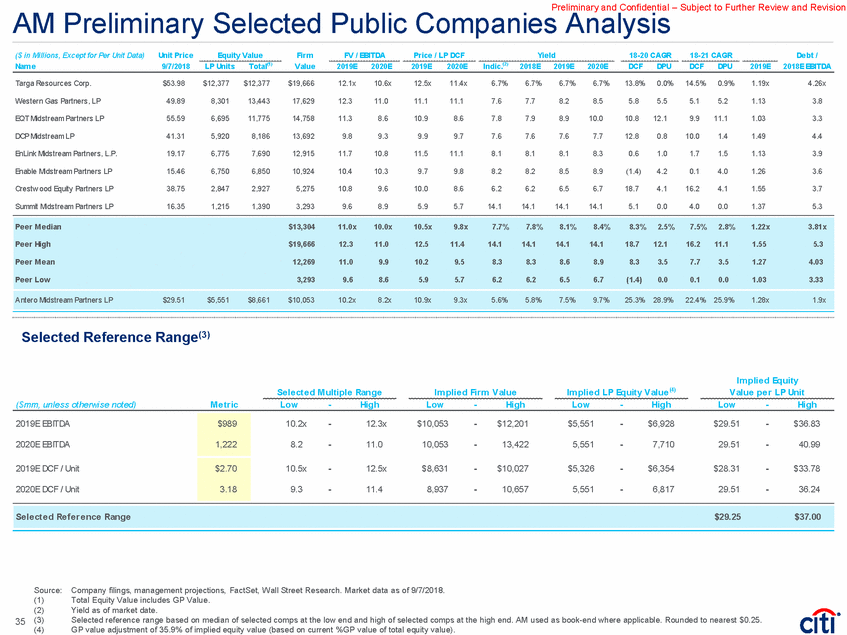
Preliminary and Confidential – Subject to Further Review and Revision Companies Analysis AM Preliminary Selected Public ($ in Millions, Except for Per Unit Data) Nam e Unit Price 9/7/2018 Equity Value Firm Value FV / EBITDA Price / LP DCF Yie ld 18-20 CAGR 18-21 CAGR De bt / 2018E EBITDA Total(1) Indic.(2) LP Units 2019E 2020E 2019E 2020E 2018E 2019E 2020E DCF DPU DCF DPU 2019E Targa Resources Corp. $53.98 $12,377 $12,377 $19,666 12.1x 10.6x 12.5x 11.4x 6.7% 6.7% 6.7% 6.7% 13.8% 0.0% 14.5% 0.9% 1.19x 4.26x Western Gas Partners, LP 49.89 8,301 13,443 17,629 12.3 11.0 11.1 11.1 7.6 7.7 8.2 8.5 5.8 5.5 5.1 5.2 1.13 3.8 EQT Midstream Partners LP 55.59 6,695 11,775 14,758 11.3 8.6 10.9 8.6 7.8 7.9 8.9 10.0 10.8 12.1 9.9 11.1 1.03 3.3 DCP Midstream LP 41.31 5,920 8,186 13,692 9.8 9.3 9.9 9.7 7.6 7.6 7.6 7.7 12.8 0.8 10.0 1.4 1.49 4.4 EnLink Midstream Partners, L.P. 19.17 6,775 7,690 12,915 11.7 10.8 11.5 11.1 8.1 8.1 8.1 8.3 0.6 1.0 1.7 1.5 1.13 3.9 Enable Midstream Partners LP 15.46 6,750 6,850 10,924 10.4 10.3 9.7 9.8 8.2 8.2 8.5 8.9 (1.4) 4.2 0.1 4.0 1.26 3.6 Crestw ood Equity Partners LP 38.75 2,847 2,927 5,275 10.8 9.6 10.0 8.6 6.2 6.2 6.5 6.7 18.7 4.1 16.2 4.1 1.55 3.7 Summit Midstream Partners LP 16.35 1,215 1,390 3,293 9.6 8.9 5.9 5.7 14.1 14.1 14.1 14.1 5.1 0.0 4.0 0.0 1.37 5.3 Selected Reference Range(3) Im plie d Equity Value pe r LP Unit Im plie d LP Equity Value (4) Se le cte d M ultiple Range Im plie d Firm Value ($mm, unless otherwise noted) M e tric Low - High Low - High Low - High Low - High Source: (1) (2) (3) (4) Company filings, management projections, FactSet, Wall Street Research. Market data as of 9/7/2018. Total Equity Value includes GP Value. Yield as of market date. Selected reference range based on median of selected comps at the low end and high of selected comps at the high end. AM used as book-end where applicable. Rounded to nearest $0.25. GP value adjustment of 35.9% of implied equity value (based on current %GP value of total equity value). 35 Se le cte d Re fe re nce Range$29.25$37.00 2019E EBITDA 2020E EBITDA 2019E DCF / Unit 2020E DCF / Unit $989 1,222 10.2x-12.3x$10,053-$12,201$5,551-$6,928$29.51-$36.83 8.2-11.010,053-13,4225,551-7,71029.51-40.99 10.5x-12.5x$8,631-$10,027$5,326-$6,354$28.31-$33.78 9.3-11.48,937-10,6575,551-6,81729.51-36.24 $2.70 3.18 Pe e r M e dian $13,304 11.0x 10.0x 10.5x 9.8x 7.7% 7.8% 8.1% 8.4% 8.3% 2.5% 7.5% 2.8% 1.22x 3.81x Pe e r High $19,666 12.3 11.0 12.5 11.4 14.1 14.1 14.1 14.1 18.7 12.1 16.2 11.1 1.55 5.3 Pe e r M e an 12,269 11.0 9.9 10.2 9.5 8.3 8.3 8.6 8.9 8.3 3.5 7.7 3.5 1.27 4.03 Pe e r Low 3,293 9.6 8.6 5.9 5.7 6.2 6.2 6.5 6.7 (1.4) 0.0 0.1 0.0 1.03 3.33 Antero Midstream Partners LP $29.51 $5,551 $8,661 $10,053 10.2x 8.2x 10.9x 9.3x 5.6% 5.8% 7.5% 9.7% 25.3% 28.9% 22.4% 25.9% 1.28x 1.9x
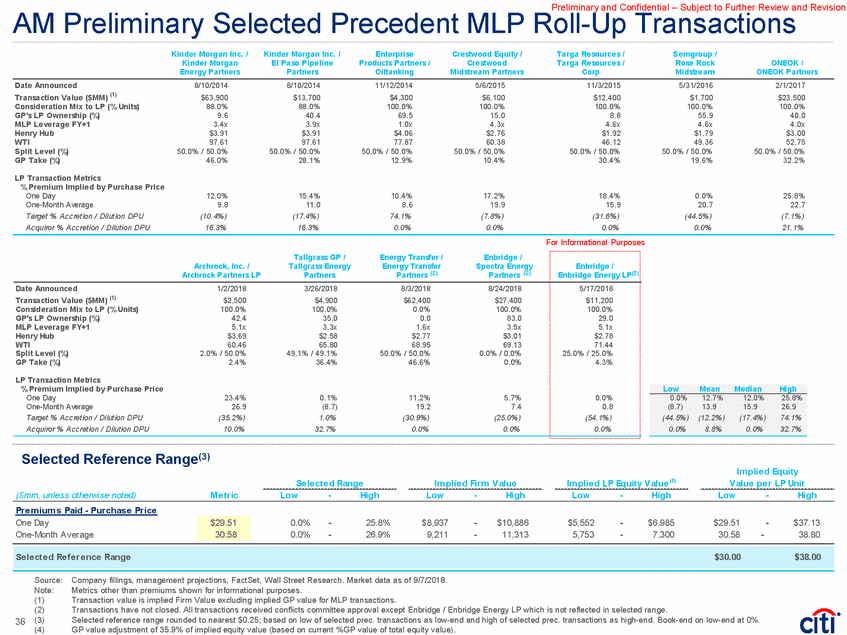
Preliminary and Confidential – Subject to Further Review and Revision Roll-Up Transactions AM Preliminary Selected Precedent MLP Kinder Morgan Inc. / Kinder Morgan Energy Partners Kinder Morgan Inc. / El Paso Pipeline Partners Enterprise Products Partners / Oiltanking Crestwood Equity / Crestwood Midstream Partners Targa Resources / Targa Resources / Corp Semgroup / Rose Rock Midstream ONEOK / ONEOK Partners Date Announced Transaction Value ($MM) (1) Consideration Mix to LP (% Units) GP's LP Ownership (%) MLP Leverage FY+1 Henry Hub WTI Split Level (%) GP Take (%) 8/10/2014 $63,900 88.0% 9.6 3.4x $3.91 97.61 50.0% / 50.0% 46.0% 8/10/2014 $13,700 88.0% 40.4 3.9x $3.91 97.61 50.0% / 50.0% 28.1% 11/12/2014 $4,300 100.0% 69.5 1.0x $4.06 77.87 50.0% / 50.0% 12.9% 5/6/2015 $6,100 100.0% 15.0 4.3x $2.76 60.38 50.0% / 50.0% 10.4% 11/3/2015 $12,400 100.0% 8.8 4.6x $1.92 46.12 50.0% / 50.0% 30.4% 5/31/2016 $1,700 100.0% 55.9 4.6x $1.79 49.36 50.0% / 50.0% 19.6% 2/1/2017 $23,500 100.0% 40.0 4.0x $3.00 52.75 50.0% / 50.0% 32.2% LP Transaction Metrics % Premium Implied by Purchase Price One Day One-Month Average Target % Accretion / Dilution DPU Acquiror % Accretion / Dilution DPU 12.0% 9.8 (10.4%) 16.3% 15.4% 11.0 (17.4%) 16.3% 10.4% 8.6 74.1% 0.0% 17.2% 19.9 (7.8%) 0.0% 18.4% 15.9 (31.6%) 0.0% 0.0% 20.7 (44.5%) 0.0% 25.8% 22.7 (7.1%) 21.1% For Informational Purposes Selected Reference Range(3) Im plie d Equity Value pe r LP Unit Im plie d LP Equity Value (4) Se le cte d Range Im plie d Firm Value ($mm, unless otherwise noted) M e tric Low - High Low - High Low - High Low - High Pr e m ium s Paid - Pur chas e Pr ice One Day One-Month Average 0.0% 0.0% - - 25.8% 26.9% $8,937 9,211 - - $10,886 11,313 $5,552 5,753 - - $6,985 7,300 $29.51 30.58 - $37.13 38.80 - Source: Note: (1) (2) (3) (4) Company fillings, management projections, FactSet, Wall Street Research. Market data as of 9/7/2018. Metrics other than premiums shown for informational purposes. Transaction value is implied Firm Value excluding implied GP value for MLP transactions. Transactions have not closed. All transactions received conflicts committee approval except Enbridge / Enbridge Energy LP which is not reflected in selected range. Selected reference range rounded to nearest $0.25; based on low of selected prec. transactions as low-end and high of selected prec. transactions as high-end. Book-end on low-end at 0%. GP value adjustment of 35.9% of implied equity value (based on current %GP value of total equity value). 36 Se le cte d Re fe re nce Range$30.00$38.00 $29.51 30.58 LowMeanMedianHigh 0.0%12.7%12.0%25.8% (8.7)13.915.926.9 (44.5%) (12.2%)(17.4%)74.1% 0.0%8.8%0.0%32.7% Tallgrass GP /Energy Transfer / Enbridge / Archrock, Inc. /Tallgrass Energy Energy TransferSpectra Energy Archrock Partners LPPartnersPartners (2)Partners (2) Enbridge / Enbridge Energy LP(2) Date Announced1/2/20183/26/20188/3/20188/24/2018 Transaction Value ($MM) (1)$2,500$4,900$62,400$27,400 Consideration Mix to LP (% Units)100.0%100.0%0.0%100.0% GP's LP Ownership (%)42.435.00.083.0 MLP Leverage FY+15.1x3.3x1.6x3.5x Henry Hub$3.69$2.58$2.77$3.01 WTI60.4665.8068.9569.13 Split Level (%)2.0% / 50.0%49.1% / 49.1%50.0% / 50.0%0.0% / 0.0% GP Take (%)2.4%36.4%46.6%0.0% LP Transaction Metrics % Premium Implied by Purchase Price One Day23.4%0.1%11.2%5.7% One-Month Average26.9(8.7)19.27.4 Target % Accretion / Dilution DPU(35.2%) 1.0%(30.9%)(25.0%) Acquiror % Accretion / Dilution DPU 10.0%32.7% 0.0%0.0% 5/17/2018 $11,200 100.0% 29.0 5.1x $2.78 71.44 25.0% / 25.0% 4.3% 0.0% 0.8 (54.1%) 0.0%
Preliminary and Confidential – Subject to Further Review and Revision AM Discounted Cash Flow Analysis Cash Flow Summary Te rm inal Value (1) ($mm, unless otherwise noted) 2H 2018E 2019E 2020E 2021E 2022E 2023E EBITDA (-) Interest Expense (-) Maintenance Capex (-) Taxes (-) Other $391 (46) (34) (3) 0 $989 (114) (39) (6) 0 $1,222 (152) (63) (6) 0 $1,413 (170) (44) (6) 0 $1,642 (201) (58) (6) 0 $1,642 (209) (58) (6) 0 Dis tributable Cas h Flow (x) Coverage $308 1.00x $829 1.00x $1,001 1.00x $1,194 1.00x $1,377 1.00x $1,369 1.00x Total Dis tributions LP Distributions LP Distrib utions as a % of Total DCF $308 199 64.4% $829 504 60.7% $1,001 590 58.9% $1,194 686 57.5% $1,377 778 56.5% $1,369 774 56.5% DCF / LP Unit End of Period LP Units Outstanding $1.06 187.045 $2.69 187.045 $3.15 187.045 $3.67 187.045 $4.16 187.045 $4.14 187.045 $47.57 Sensitivity Analysis Te rm inal P / DCF M ultiple Im plie d Grow th Rate 10.5x 11.0x 11.5x 12.0x 12.5x 10.5x 11.0x 11.5x 12.0x 12.5x Te rm inal Value $47.57 Te rm inal Value $47.57 $43.38 $45.47 $49.66 $51.75 $43.38 $45.47 $49.66 $51.75 Im plie d Price pe r Unit Im plie d Grow th Rate 9.0% 9.5 10.0 10.5 11.0 9.0% 9.5 10.0 10.5 11.0 Source: Note: (1) Company fillings, management projections, FactSet, Wall Street Research. Market data as of 9/7/2018. Valuation discounted to 6/30/2018. Terminal value assumes midpoint 11.5x P / DCF valuation. 37 Cost of Equity Cost of Equity (0.5%) (0.1%) 0.3% 0.6% 1.0% (0.0) 0.4 0.8 1.1 1.4 0.4 0.8 1.2 1.5 1.9 0.9 1.3 1.7 2.0 2.3 1.3 1.7 2.1 2.5 2.8 $41.57 $42.87 $44.17 $45.47 $46.77 40.73 42.00 43.27 44.53 45.80 39.91 41.15 42.38 43.62 44.86 39.11 40.32 41.52 42.73 43.94 38.33 39.51 40.69 41.87 43.05
Preliminary and Confidential – Subject to Further Review and Revision B. Preliminary AMGP Financial Analysis
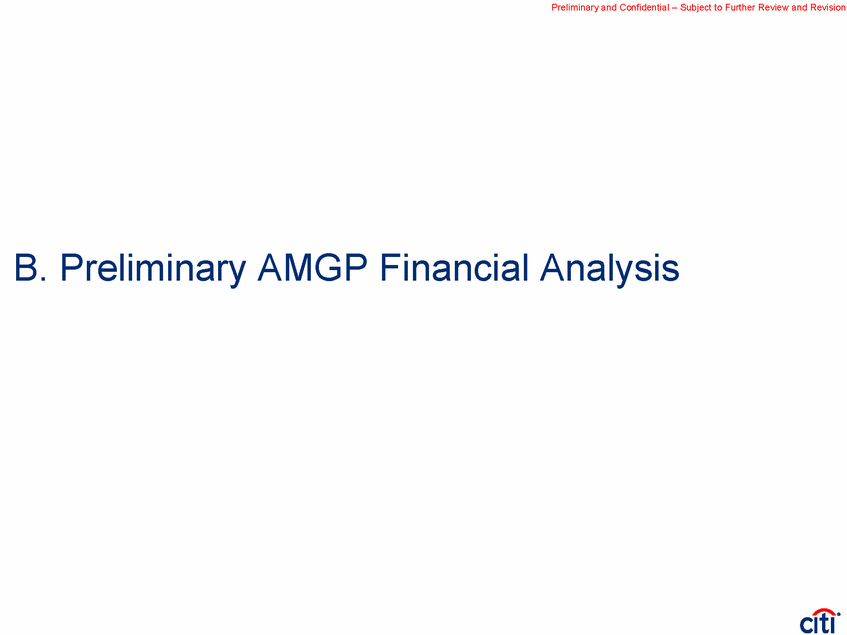
Preliminary and Confidential – Subject to Further Review and Revision AMGP Research Summary Analyst Share Price Targets & Projections Price Targe t EBITDA 2019E EBITDA CAGR Dis tribution pe r Unit Dis t. CAGR Brok e r Date Rating 2018E 2020E 2018E 2019E 2020E Robert W. Baird & Co. Scotia How ard Weil Wells Fargo Securities, LLC Ladenburg Thalmann & Co. Inc. MUFG Securities Americas Inc. JPMorgan Goldman Sachs Research Citi Barclays Raymond James 1/26/1900 08/14/2018 08/10/2018 08/03/2018 08/02/2018 05/17/2018 04/02/2018 02/14/2018 01/17/2018 01/16/2018 Buy Hold Buy Buy Buy Buy Buy Buy Hold Buy $26.00 24.00 23.00 24.00 26.00 22.00 20.00 23.00 23.00 27.00 N/A 133 132 N/A 131 134 133 N/A N/A 133 N/A N/A 216 N/A 214 221 224 N/A N/A 216 N/A N/A 323 N/A N/A 336 339 N/A N/A N/A N/A N/A 56.5 N/A N/A 58.3 59.6 N/A N/A N/A $0.54 N/A 0.53 N/A 0.54 0.54 0.53 143.15 0.50 0.54 $0.89 N/A 0.87 N/A 0.87 0.89 0.90 234.92 0.90 0.87 $1.34 N/A 1.30 N/A N/A 1.35 1.36 352.38 1.30 N/A 57.6% N/A 56.6 N/A N/A 58.1 60.2 56.9 61.2 N/A Recommendation History 100% $30.00 $25.00 80% $20.00 60% $15.00 40% $10.00 20% $5.00 0% $0.00 9/17 10/17 11/17 12/17 1/18 2/18 % Hold 3/18 % Buy 4/18 Actual 5/18 6/18 7/18 8/18 9/18 % Sell Target Unit Price Source: FactSet. Market data as of 9/7/2018. 38 69% 64% 75% 85% 86% 79% 79% 69% 69% 69% 69% 83% 82% 36% 31% 31% 31% 31% 31% 25% 21% 21% 18% 15% 17% 14% M e dian$23.50$133$216$33659.0%$0.54$0.89$1.3457.9% Curre nt Unit Price16.73 Premium / (Discount) to Current40.5%
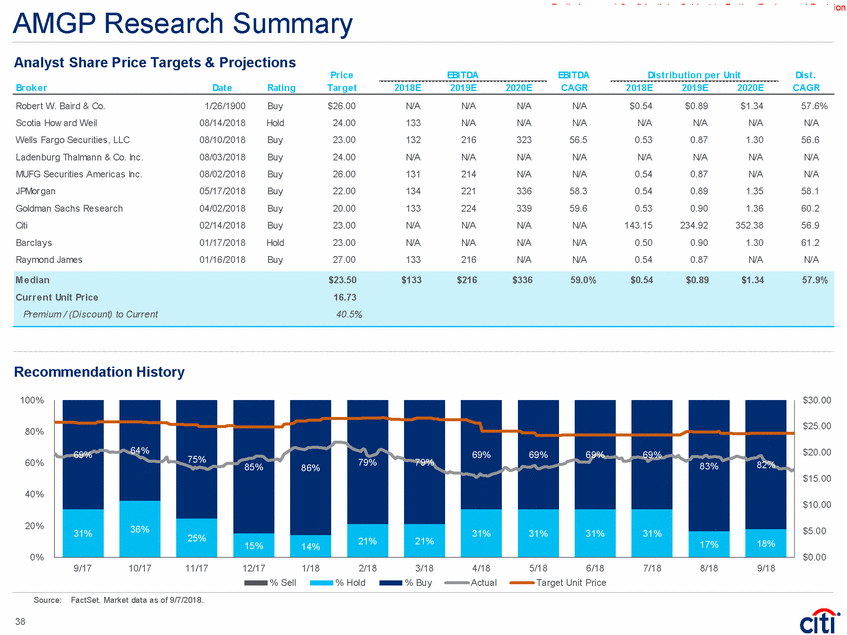
Preliminary and Confidential – Subject to Further Review and Revision AMGP Preliminary Selected Public Companies Analysis Afte r-Tax GP Cas h Flow M utiple (3) ($ in Millions, Except for Per Unit Data) Nam e Unit Price 9/7/2018 Equity Value Firm Value Value of GP Inte re s t(1) Yie ld (%) Price / DCF 2019E 2018E-2021E CAGR 2018E Cove rage De bt / 2018E EBITDA Indic.(2) 2018E 2019E 2020E 2018E 2020E DPU DCF GP / IDR Dis t. 2018E 2019E 2020E Western Gas Equity Partners LP $34.79 $7,617 $7,643 $5,142 6.7% 6.8% 7.4% 8.4% 14.8x 13.5x 11.9x 10.2% 10.2% 12.9% 1.00x 0.1x 15.8x 14.2x 12.0x EQT GP Holdings LP 20.59 6,228 6,292 5,080 5.9 5.4 7.3 8.6 18.7 13.7 11.6 22.1 22.1 25.5 1.0 0.2 21.0 14.5 12.1 EnLink Midstream LLC 16.85 3,100 3,184 916 6.3 6.4 6.9 7.5 13.3 13.2 12.0 9.2 5.9 18.0 1.2 0.4 15.4 13.4 12.4 Selected Reference Range(4) Im plie d Equity Value pe r Share Se le cte d M ultiple Range Im plie d Firm Value Im plie d Equity Value ($mm, unless otherwise noted) M e tric Low - High Low - High Low - High Low - High Source: (1) (2) (3) (4) Company filings, management projections, FactSet, Wall Street Research. Market data as of 9/7/2018. Firm Value of public GP – Market Value of LP Units held by GP – Value of Non-GP Businesses. Yield as of market date. GP cash flow multiple equals implied value of GP interest divided by after-tax GP cash flow generated by distributed cash flow for indicated period, prior to SG&A and interest expense at GP level. Multiples based on regression of P / DCF vs. 2018E - 2021E DCF / LP Unit CAGR. Rounded to nearest $0.25. 39 Se le cte d Re fe re nce Range$13.75$22.25 2019E P / DCF 2020E P / DCF $0.89 1.34 13.7x-22.5x$2,254-$3,709$2,259-$3,714$12.13-$19.95 11.6-18.52,878-4,6032,883-4,60815.48-24.75 Pe e r High $7,643 $5,142 6.7% 6.8% 7.4% 8.6% 18.7x 13.7x 12.0x 22.1% 22.1% 25.5% 1.2x 0.4x 21.0x 14.5x 12.4x Pe e r M e an 5,706 3,712 6.3 6.2 7.2 8.2 15.6 13.5 11.8 13.8 12.7 18.8 1.1 0.2 17.4 14.0 12.2 Pe e r M e dian 6,292 5,080 6.3 6.4 7.3 8.4 14.8 13.5 11.9 10.2 10.2 18.0 1.0 0.2 15.8 14.2 12.1 Pe e r Low 3,184 916 5.9 5.4 6.9 7.5 13.3 13.2 11.6 9.2 5.9 12.9 1.0 0.1 15.4 13.4 12.0 Antero Midstream GP LP $16.73 $3,115 $3,110 $3,110 3.0% 3.2% 5.3% 8.0% 31.0x 18.9x 12.5x 47.9% 47.8% 47.9% 1.0x 0.0x 28.5x 17.3x 11.5x
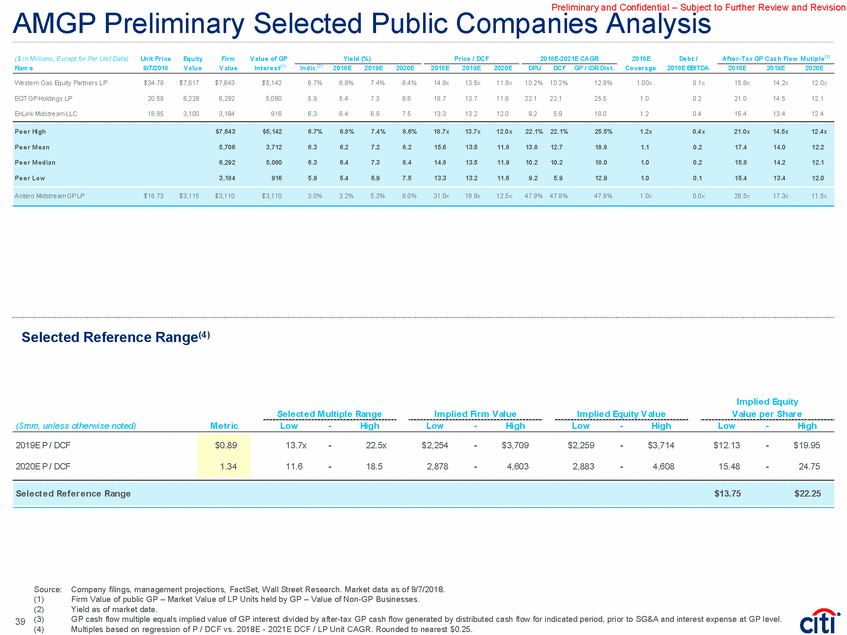
Preliminary and Confidential – Subject to Further Review and Revision AMGP Discounted Cash Flow Analysis Cash Flow Summary Te rm inal Value (1) ($mm, unless otherwise noted) 2H 2018E 2019E 2020E 2021E 2022E 2023E GP/IDR Distributions f rom AM $81 $235 $355 $462 $589 $589 EBITDA (-) Interest Expense (-) Maintenance Capex (-) Taxes (-) Series B Pref erred Distributions (-) Other $81 0 0 (19) (4) (1) $235 0 0 (56) (12) (2) $355 0 0 (85) (20) (2) $462 0 0 (110) (26) (2) $589 0 0 (140) (34) (2) $589 0 0 (140) (34) (2) Cas h Avail. for Dis tributions (x) Coverage $57 1.00x $165 1.00x $249 1.00x $324 1.00x $413 1.00x $413 1.00x Total Dis tributions End of Period Shares Outstanding $57 186.209 $165 186.209 $249 186.209 $324 186.209 $414 186.209 $414 186.209 CAFD / Share $0.31 $0.89 $1.34 $1.74 $2.22 $2.22 $38.38 Sensitivity Analysis Te rm inal GP M ultiple Im plie d Grow th Rate 13.7x 15.9x 18.1x 20.3x 22.5x 13.7x 15.9x 18.1x 20.3x 22.5x Te rm inal Value $38.38 Te rm inal Value $33.79$38.38$42.98 $29.19 $33.79 $42.98 $47.57 $29.19 $47.57 Im plie d Grow th Rate Im plie d Value 9.1% 9.6 10.1 10.6 11.1 9.1% 9.6 10.1 10.6 11.1 Source: Note: (1) FactSet, Company fillings, Wall Street Research. Market data as of 9/7/2018. Valuation discounted to 6/30/2018. Terminal value assumes midpoint 16.3x P / DCF valuation less Series B terminal value. Series B terminal value equals terminal value less $2.0 billion floor equity value multiplied by 6.0% redemption right. 40 Cost of Equity Cost of Equity 1.4% 2.4% 3.1% 3.7% 4.2% 1.8 2.8 3.6 4.2 4.7 2.3 3.3 4.1 4.7 5.2 2.8 3.8 4.5 5.1 5.6 3.2 4.2 5.0 5.6 6.1 $24.65$27.50$30.34$33.19$36.04 24.1226.9029.6732.4535.22 23.6026.3129.0231.7334.44 23.1025.7428.3831.0333.67 22.6125.1927.7730.3532.92
Preliminary and Confidential – Subject to Further Review and Revision Has / Gets Supporting Materials
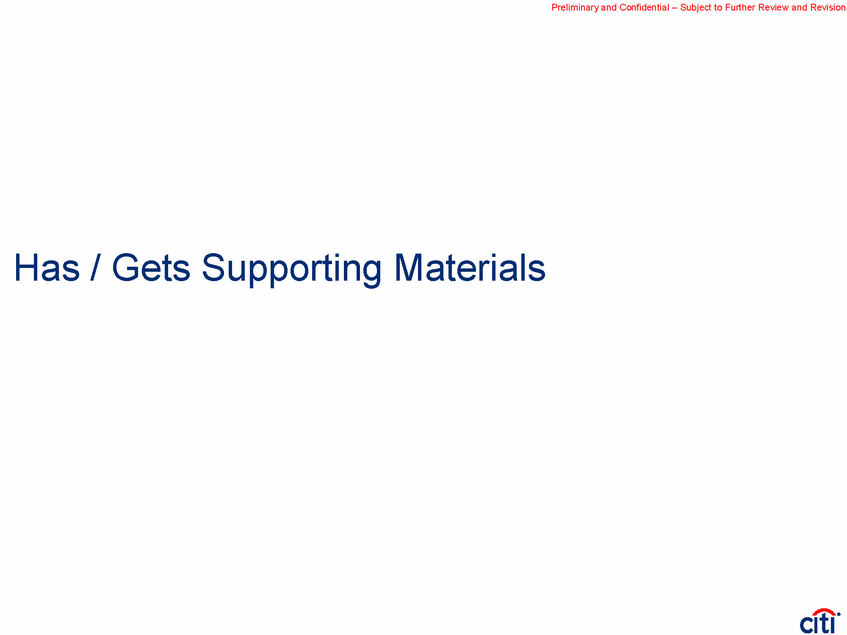
Preliminary and Confidential – Subject to Further Review and Revision PF AMGP Preliminary Selected Public Companies Analysis 1.775x; 13.5mm AMGP Shares Issued to Series B Im plie d Equity Value pe r Share Im plie d Equity Value pe r Share Se le cte d M ultiple Range Im plie d Firm Value Im plie d Equity Value ($mm, unless otherwise noted) M e tric Low - High Low - High Low - High Low - High Low - High 1.800x; 14.5mm AMGP Shares Issued to Series B Im plie d Equity Value pe r Share Im plie d Equity Value pe r Share Se le cte d M ultiple Range Im plie d Firm Value Im plie d Equity Value ($mm, unless otherwise noted) M e tric Low - High Low - High Low - High Low - High Low - High 1.8500x; 18.5mm AMGP Shares Issued to Series B Im plie d Equity Value pe r Share Im plie d Equity Value pe r Share Se le cte d M ultiple Range Im plie d Firm Value Im plie d Equity Value ($mm, unless otherwise noted) M e tric Low - High Low - High Low - High Low - High Low - High Source: Bloomberg, company filings, FactSet. Market data as of 9/7/2018. Note: Trading metrics based on AM peer set. 41 Se le cte d Re fe re nce Range $15.75 $20.00 $29.25 $37.00 2019E EBITDA 2020E EBITDA 2019E CAFD / Share 2020E CAFD / Share $994 1,227 10.2x - 12.3x $10,104 - $12,262 $8,425 - $10,583 $15.24 - $19.15 8.2 - 11.0 10,095 - 13,477 8,415 - 11,798 15.23 - 21.34 10.5x - 12.5x $10,443 - $12,134 $8,764 - $10,455 $15.86 - $18.92 9.3 - 11.4 11,126 - 13,280 9,447 - 11,601 17.09 - 20.99 1.51 1.84 Se le cte d Re fe re nce Range $16.25 $20.50 $29.25 $37.00 2019E EBITDA 2020E EBITDA 2019E CAFD / Share 2020E CAFD / Share $994 1,227 10.2x - 12.3x $10,104 - $12,262 $8,425 - $10,583 $15.62 - $19.62 8.2 - 11.0 10,095 - 13,477 8,415 - 11,798 15.60 - 21.87 10.5x - 12.5x $10,442 - $12,133 $8,763 - $10,454 $16.25 - $19.38 9.3 - 11.4 11,124 - 13,278 9,445 - 11,599 17.51 - 21.51 1.55 1.89 Se le cte d Re fe re nce Range $16.50 $20.75 $29.25 $36.75 2019E EBITDA 2020E EBITDA 2019E CAFD / Share 2020E CAFD / Share $994 1,227 10.2x - 12.3x $10,104 - $12,262 $8,425 - $10,583 $15.79 - $19.83 8.2 - 11.0 10,095 - 13,477 8,415 - 11,798 15.77 - 22.11 10.5x - 12.5x $10,441 - $12,132 $8,762 - $10,453 $16.42 - $19.59 9.3 - 11.4 11,123 - 13,276 9,444 - 11,597 17.70 - 21.73 1.57 1.91
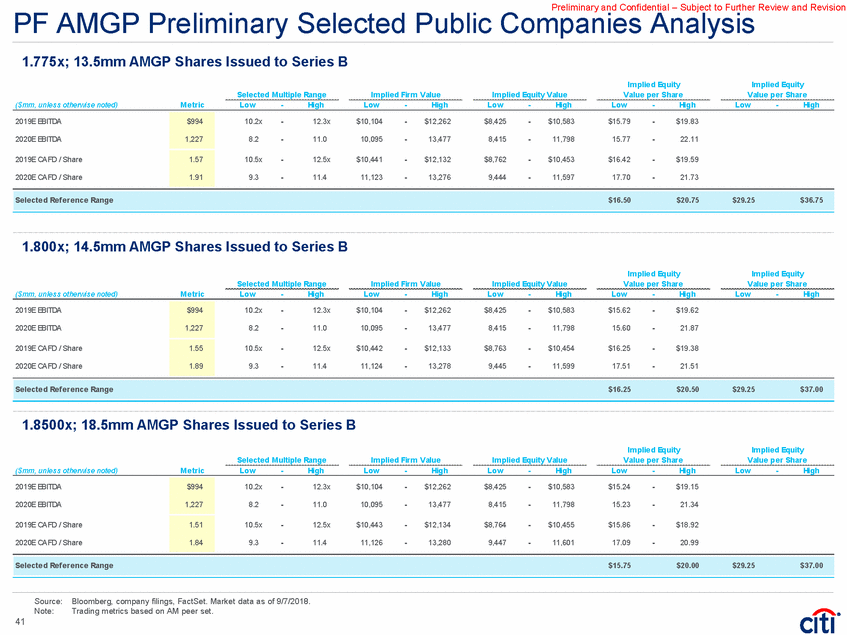
Preliminary and Confidential – Subject to Further Review and Revision Units) PF AMGP DCF Analysis (1.775x; 13.5mm Cash Flow Summary Te rm inal Value (1) ($mm, unless otherwise noted) 2019E 2020E 2021E 2022E 2023E EBITDA (-) Interest Expense (-) Maintenance Capex (-) Taxes (-) Series B Pref erred Distributions (-) Other $994 (117) (39) 0 0 (2) $1,227 (143) (63) 0 0 (2) $1,418 (152) (44) 0 0 (2) $1,647 (168) (58) (14) 0 (2) $1,647 (150) (58) (14) 0 (2) Cas h Avail. for Dis tributions (x) Coverage $835 1.26x $1,019 1.19x $1,221 1.19x $1,406 1.14x $1,423 1.15x Total Dis tributions End of Period Shares Outstanding $664 533.620 $857 533.620 $1,028 533.620 $1,233 533.620 $1,233 533.620 CAFD / Share $1.57 $1.91 $2.29 $2.63 $2.67 $29.31 Sensitivity Analysis Te rm inal GP M ultiple 10.5x 11.0x 11.5x 12.0x 12.5x Te rm inal Value $29 $27 $28 $31 $32 Im plie d Value 9.0% 9.5 10.0 10.5 11.0 Source: Note: (1) FactSet, Company fillings, Wall Street Research. Market data as of 9/7/2018. Valuation discounted to 1/1/2019. Terminal value assumes midpoint 11.5x P / DCF valuation (based on AM peer set) less Series B terminal value. Series B terminal value equals terminal value less $2.0 billion floor equity value multiplied by 6.0% redemption right. 42 Cost of Equity $26.14$26.97$27.80$28.64$29.47 25.6626.4727.2828.0928.91 25.1825.9826.7727.5728.36 24.7225.5026.2727.0527.83 24.2725.0325.7926.5527.31 DCF at Cos t of Equity of 10.0% $26.77
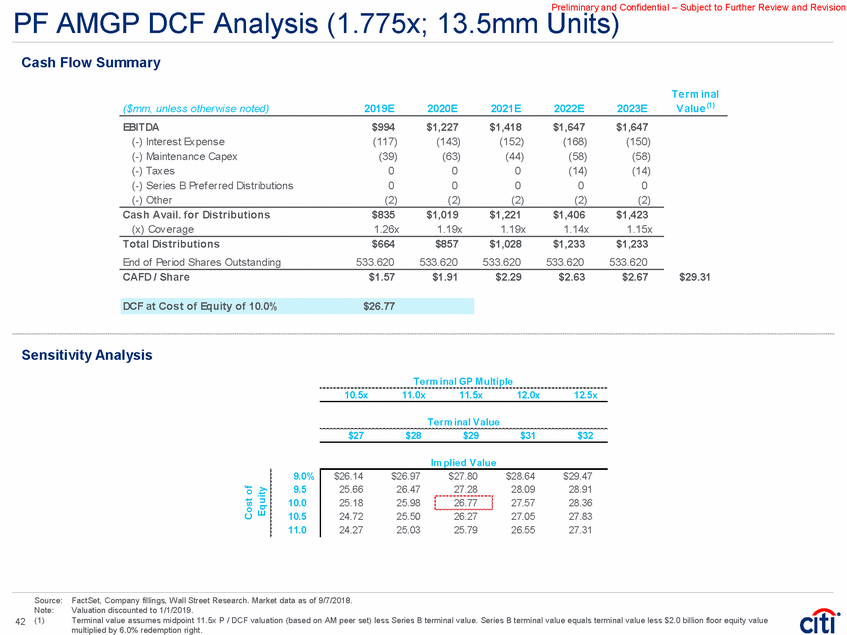
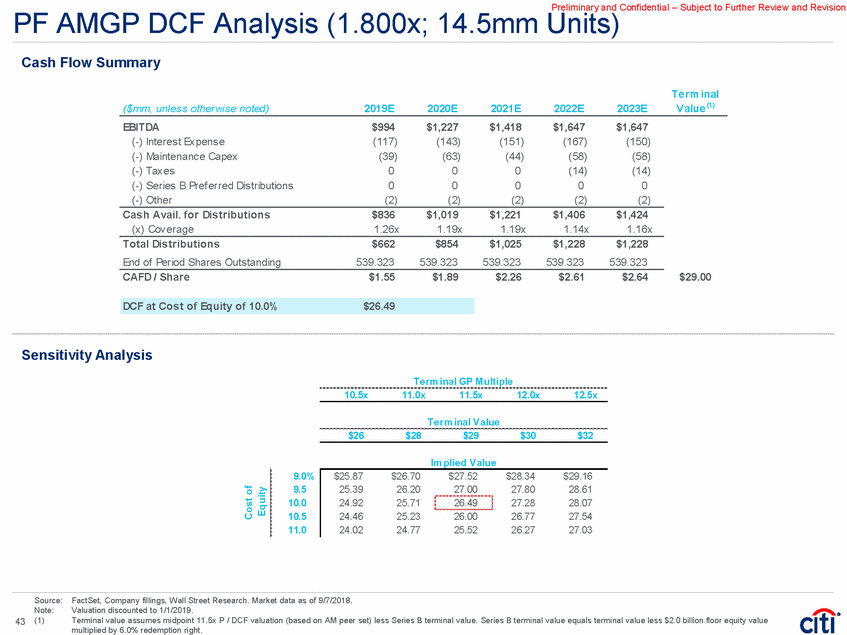
Preliminary and Confidential – Subject to Further Review and Revision Units) PF AMGP DCF Analysis (1.800x; 14.5mm Cash Flow Summary Te rm inal Value (1) ($mm, unless otherwise noted) 2019E 2020E 2021E 2022E 2023E EBITDA (-) Interest Expense (-) Maintenance Capex (-) Taxes (-) Series B Pref erred Distributions (-) Other $994 (117) (39) 0 0 (2) $1,227 (143) (63) 0 0 (2) $1,418 (151) (44) 0 0 (2) $1,647 (167) (58) (14) 0 (2) $1,647 (150) (58) (14) 0 (2) Cas h Avail. for Dis tributions (x) Coverage $836 1.26x $1,019 1.19x $1,221 1.19x $1,406 1.14x $1,424 1.16x Total Dis tributions End of Period Shares Outstanding $662 539.323 $854 539.323 $1,025 539.323 $1,228 539.323 $1,228 539.323 CAFD / Share $1.55 $1.89 $2.26 $2.61 $2.64 $29.00 Sensitivity Analysis Te rm inal GP M ultiple 10.5x 11.0x 11.5x 12.0x 12.5x Te rm inal Value $29 $26 $28 $30 $32 Im plie d Value 9.0% 9.5 10.0 10.5 11.0 Source: Note: (1) FactSet, Company fillings, Wall Street Research. Market data as of 9/7/2018. Valuation discounted to 1/1/2019. Terminal value assumes midpoint 11.5x P / DCF valuation (based on AM peer set) less Series B terminal value. Series B terminal value equals terminal value less $2.0 billion floor equity value multiplied by 6.0% redemption right. 43 Cost of Equity $25.87$26.70$27.52$28.34$29.16 25.3926.2027.0027.8028.61 24.9225.7126.4927.2828.07 24.4625.2326.0026.7727.54 24.0224.7725.5226.2727.03 DCF at Cos t of Equity of 10.0% $26.49
Preliminary and Confidential – Subject to Further Review and Revision Units) PF AMGP DCF Analysis (1.850x; 18.5mm Cash Flow Summary Te rm inal Value (1) ($mm, unless otherwise noted) 2019E 2020E 2021E 2022E 2023E EBITDA (-) Interest Expense (-) Maintenance Capex (-) Taxes (-) Series B Pref erred Distributions (-) Other $994 (117) (39) 0 0 (2) $1,227 (143) (63) 0 0 (2) $1,418 (151) (44) 0 0 (2) $1,647 (167) (58) (14) 0 (2) $1,647 (150) (58) (14) 0 (2) Cas h Avail. for Dis tributions (x) Coverage $836 1.27x $1,019 1.20x $1,222 1.20x $1,406 1.15x $1,424 1.16x Total Dis tributions End of Period Shares Outstanding $660 552.728 $852 552.728 $1,022 552.728 $1,225 552.728 $1,225 552.728 CAFD / Share $1.51 $1.84 $2.21 $2.54 $2.58 $28.31 Sensitivity Analysis Te rm inal GP M ultiple 10.5x 11.0x 11.5x 12.0x 12.5x Te rm inal Value $28 $26 $27 $30 $31 Im plie d Value 9.0% 9.5 10.0 10.5 11.0 Source: Note: (1) FactSet, Company fillings, Wall Street Research. Market data as of 9/7/2018. Valuation discounted to 1/1/2019. Terminal value assumes midpoint 11.5x P / DCF valuation (based on AM peer set) less Series B terminal value. Series B terminal value equals terminal value less $2.0 billion floor equity value multiplied by 6.0% redemption right. 44 Cost of Equity $25.25$26.05$26.86$27.66$28.46 24.7825.5726.3527.1327.92 24.3225.0925.8626.6227.39 23.8824.6325.3826.1326.88 23.4424.1724.9125.6426.38 DCF at Cos t of Equity of 10.0% $25.86
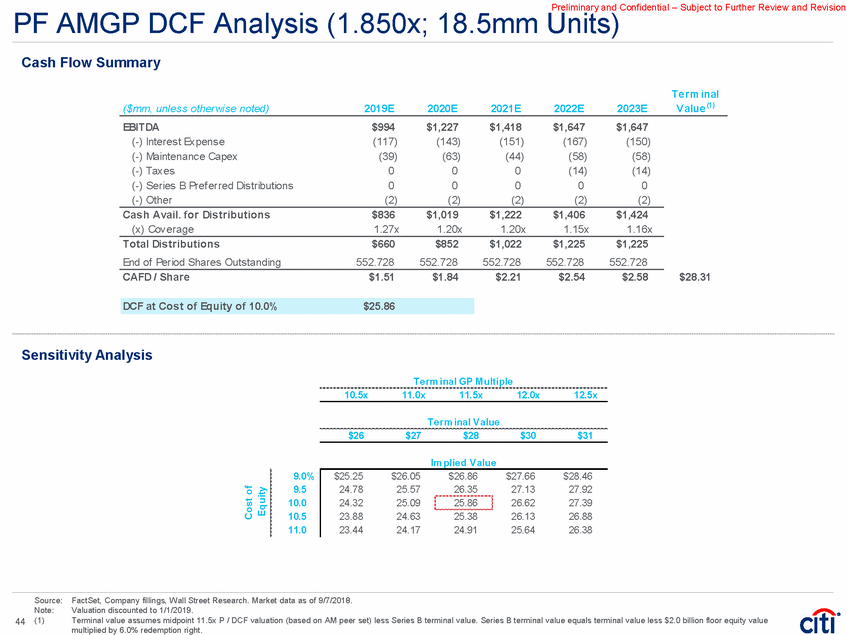
Preliminary and Confidential – Subject to Further Review and Revision IRS Circular 230 Disclosure: Citigroup Inc. and its affiliates do not provide tax or legal advice. Any discussion of tax matters in these materials (i) is not intended or written to be used, and cannot be used or relied upon, by you for the purpose of avoiding any tax penalties and (ii) may have been written in connection with the "promotion or marketing" of any transaction contemplated hereby ("Transaction"). Accordingly, you should seek advice based on your particular circumstances from an independent tax advisor. In any instance where distribution of this communication is subject to the rules of the US Commodity Futures Trading Commission (“CFTC”), this communication constitutes an invitation to consider entering into a derivatives transaction under U.S. CFTC Regulations §§ 1.71 and 23.605, where applicable, but is not a binding offer to buy/sell any financial instrument. Any terms set forth herein are intended for discussion purposes only and are subject to the final terms as set forth in separate definitive written agreements. This presentation is not a commitment to lend, syndicate a financing, underwrite or purchase securities, or commit capital nor does it obligate us to enter into such a commitment, nor are we acting as a fiduciary to you. By accepting this presentation, subject to applicable law or regulation, you agree to keep confidential the information contained herein and the existence of and proposed terms for any Transaction. Prior to entering into any Transaction, you should determine, without reliance upon us or our affiliates, the economic risks and merits (and independently determine that you are able to assume these risks) as well as the legal, tax and accounting characterizations and consequences of any such Transaction. In this regard, by accepting this presentation, you acknowledge that (a) we are not in the business of providing (and you are not relying on us for) legal, tax or accounting advice, (b) there may be legal, tax or accounting risks associated with any Transaction, (c) you should receive (and rely on) separate and qualified legal, tax and accounting advice and (d) you should apprise senior management in your organization as to such legal, tax and accounting advice (and any risks associated with any Transaction) and our disclaimer as to these matters. By acceptance of these materials, you and we hereby agree that from the commencement of discussions with respect to any Transaction, and notwithstanding any other provision in this presentation, we hereby confirm that no participant in any Transaction shall be limited from disclosing the U.S. tax treatment or U.S. tax structure of such Transaction. We are required to obtain, verify and record certain information that identifies each entity that enters into a formal business relationship with us. We will ask for your complete name, street address, and taxpayer ID number. We may also request corporate formation documents, or other forms of identification, to verify information provided. Any prices or levels contained herein are preliminary and indicative only and do not represent bids or offers. These indications are provided solely for your information and consideration, are subject to change at any time without notice and are not intended as a solicitation with respect to the purchase or sale of any instrument. The information contained in this presentation may include results of analyses from a quantitative model which represent potential future events that may or may not be realized, and is not a complete analysis of every material fact representing any product. Any estimates included herein constitute our judgment as of the date hereof and are subject to change without any notice. We and/or our affiliates may make a market in these instruments for our customers and for our own account. Accordingly, we may have a position in any such instrument at any time. Although this material may contain publicly available information about Citi corporate bond research, fixed income strategy or economic and market analysis, Citi policy (i) prohibits employees from offering, directly or indirectly, a favorable or negative research opinion or offering to change an opinion as consideration or inducement for the receipt of business or for compensation; and (ii) prohibits analysts from being compensated for specific recommendations or views contained in research reports. So as to reduce the potential for conflicts of interest, as well as to reduce any appearance of conflicts of interest, Citi has enacted policies and procedures designed to limit communications between its investment banking and research personnel to specifically prescribed circumstances. © 2018 Citigroup Inc. All rights reserved. Citi and Citi and Arc Design are trademarks and service marks of Citigroup Inc. or its affiliates and are used and registered throughout the world. Citi believes that sustainability is good business practice. We work closely with our clients, peer financial institutions, NGOs and other partners to finance solutions to climate change, develop industry standards, reduce our own environmental footprint, and engage with stakeholders to advance shared learning and solutions. Highlights of Citi’s unique role in promoting sustainability include: (a) releasing in 2007 a Climate Change Position Statement, the first US financial institution to do so; (b) targeting $50 billion over 10 years to address global climate change: includes significant increases in investment and financing of renewable energy, clean technology, and other carbon-emission reduction activities; (c) committing to an absolute reduction in GHG emissions of all Citi owned and leased properties around the world by 10% by 2011; (d) purchasing more than 234,000 MWh of carbon neutral power for our operations over the last three years; (e) establishing in 2008 the Carbon Principles; a framework for banks and their U.S. power clients to evaluate and address carbon risks in the financing of electric power projects; (f) producing equity research related to climate issues that helps to inform investors on risks and opportunities associated with the issue; and (g) engaging with a broad range of stakeholders on the issue of climate change to help advance understanding and solutions. Citi works with its clients in greenhouse gas intensive industries to evaluate emerging risks from climate change and, where appropriate, to mitigate those risks. efficiency, renewable energy and mitigation 45
