Project Alpine Fairness Opinion Discussion Materials January 11, 2019

Table of Contents Antero Situation Overview I AM Financial Analysis II AMGP Financial Analysis III Analysis of Transaction IV Pro Forma Impact V Supplemental Materials VII Appendix 2
I. Antero Situation Overview 3

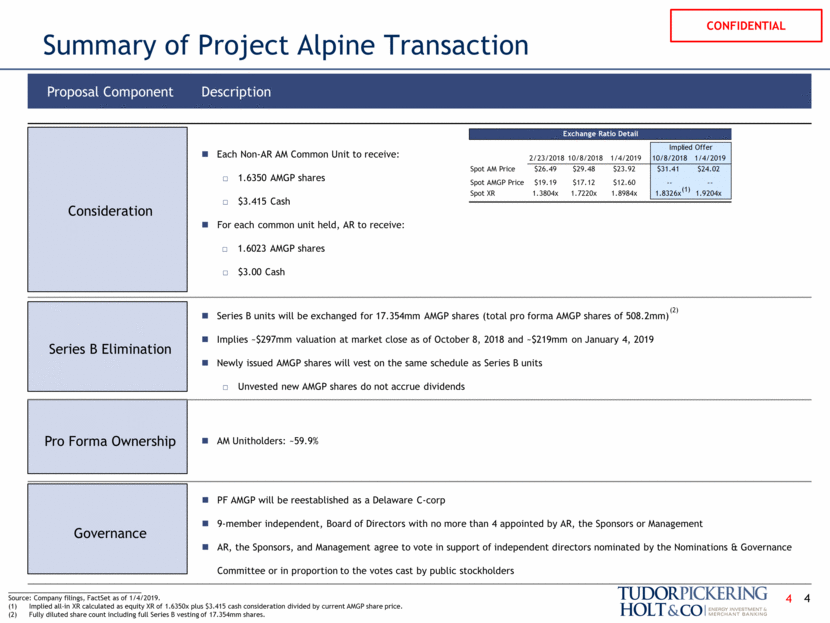
Proposal Component Description Consideration Each Non-AR AM Common Unit to receive: 1.6350 AMGP shares $3.415 Cash For each common unit held, AR to receive: 1.6023 AMGP shares $3.00 Cash Series B Elimination Series B units will be exchanged for 17.354mm AMGP shares (total pro forma AMGP shares of 508.2mm) Implies ~$297mm valuation at market close as of October 8, 2018 and ~$219mm on January 4, 2019 Newly issued AMGP shares will vest on the same schedule as Series B units Unvested new AMGP shares do not accrue dividends Pro Forma Ownership AM Unitholders: ~59.9% Governance PF AMGP will be reestablished as a Delaware C-corp 9-member independent, Board of Directors with no more than 4 appointed by AR, the Sponsors or Management AR, the Sponsors, and Management agree to vote in support of independent directors nominated by the Nominations & Governance Committee or in proportion to the votes cast by public stockholders Summary of Project Alpine Transaction 4 _____________________________________ Source: Company filings, FactSet as of 1/4/2019. Implied all-in XR calculated as equity XR of 1.6350x plus $3.415 cash consideration divided by current AMGP share price. Fully diluted share count including full Series B vesting of 17.354mm shares. (2) 4 (1) Exchange Ratio Detail Implied Offer 2/23/2018 10/8/2018 1/4/2019 10/8/2018 1/4/2019 Spot AM Price $26.49 $29.48 $23.92 $31.41 $24.02 Spot AMGP Price $19.19 $17.12 $12.60 -- -- Spot XR 1.3804x 1.7220x 1.8984x 1.8326x 1.9204x
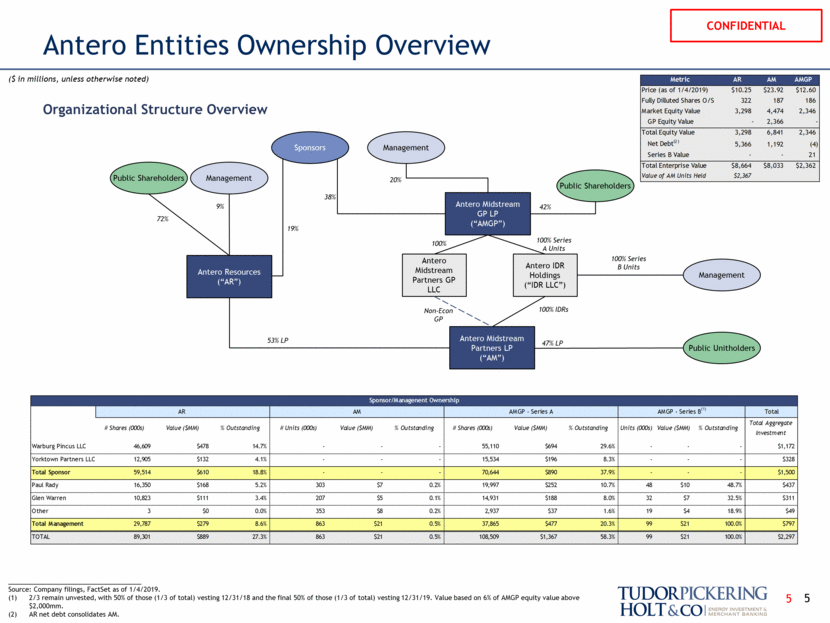
Antero Entities Ownership Overview Organizational Structure Overview Antero Resources (“AR”) Antero Midstream GP LP (“AMGP”) Antero Midstream Partners LP (“AM”) Public Shareholders Public Unitholders Sponsors 72% 19% 47% LP 100% IDRs 53% LP Public Shareholders 38% 42% Antero Midstream Partners GP LLC 100% Antero IDR Holdings (“IDR LLC”) 100% Series A Units 100% Series B Units Management _____________________________________ Source: Company filings, FactSet as of 1/4/2019. 2/3 remain unvested, with 50% of those (1/3 of total) vesting 12/31/18 and the final 50% of those (1/3 of total) vesting 12/31/19. Value based on 6% of AMGP equity value above $2,000mm. AR net debt consolidates AM. Non-Econ GP Management Management 9% 20% ($ in millions, unless otherwise noted) 5 5 Metric AR AM AMGP Price (as of 1/4/2019) $10.25 $23.92 $12.60 Fully Dilluted Shares O/S 322 187 186 Market Equity Value 3,298 4,474 2,346 GP Equity Value - 2,366 - Total Equity Value 3,298 6,841 2,346 Net Debt (2) 5,366 1,192 (4) Series B Value - - 21 Total Enterprise Value $8,664 $8,033 $2,362 Value of AM Units Held $2,367 Sponsor/Managenent Ownership x AR AM AMGP - Series A AMGP - Series B (1) Total # Shares (000s) Value ($MM) % Outstanding # Units (000s) Value ($MM) % Outstanding # Shares (000s) Value ($MM) % Outstanding Units (000s) Value ($MM) % Outstanding Total Aggregate Investment Warburg Pincus LLC 46,609 $478 14.7% - - - 55,110 $694 29.6% - - - $1,172 Yorktown Partners LLC 12,905 $132 4.1% - - - 15,534 $196 8.3% - - - $328 Total Sponsor 59,514 $610 18.8% - - - 70,644 $890 37.9% - - - $1,500 Paul Rady 16,350 $168 5.2% 303 $7 0.2% 19,997 $252 10.7% 48 $10 48.7% $437 Glen Warren 10,823 $111 3.4% 207 $5 0.1% 14,931 $188 8.0% 32 $7 32.5% $311 Other 3 $0 0.0% 353 $8 0.2% 2,937 $37 1.6% 19 $4 18.9% $49 Total Management 29,787 $279 8.6% 863 $21 0.5% 37,865 $477 20.3% 99 $21 100.0% $797 TOTAL 89,301 $889 27.3% 863 $21 0.5% 108,509 $1,367 58.3% 99 $21 100.0% $2,297
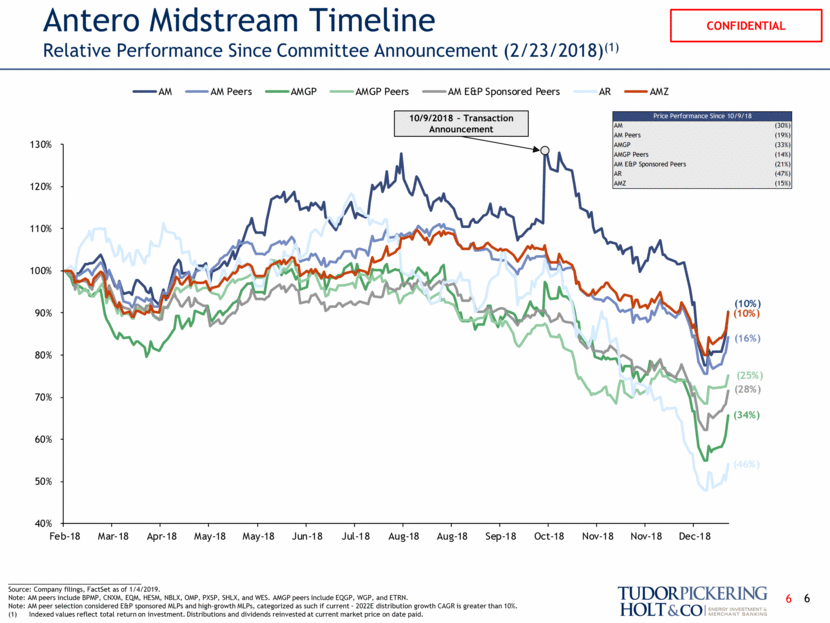
Antero Midstream Timeline Relative Performance Since Committee Announcement (2/23/2018)(1) _____________________________________ Source: Company filings, FactSet as of 1/4/2019. Note: AM peers include BPMP, CNXM, EQM, HESM, NBLX, OMP, PXSP, SHLX, and WES. AMGP peers include EQGP, WGP, and ETRN. Note: AM peer selection considered E&P sponsored MLPs and high-growth MLPs, categorized as such if current – 2022E distribution growth CAGR is greater than 10%. Indexed values reflect total return on investment. Distributions and dividends reinvested at current market price on date paid. 6 10/9/2018 – Transaction Announcement 6 (10%) (16%) (25%) (28%) (34%) (46%) (10%) 40% 50% 60% 70% 80% 90% 100% 110% 120% 130% Feb-18 Mar-18 Apr-18 May-18 May-18 Jun-18 Jul-18 Aug-18 Aug-18 Sep-18 Oct-18 Nov-18 Nov-18 Dec-18 AM AM Peers AMGP AMGP Peers AM E&P Sponsored Peers AR AMZ Price Performance Since 10/9/18 AM (30%) AM Peers (19%) AMGP (33%) AMGP Peers (14%) AM E&P Sponsored Peers (21%) AR (47%) AMZ (15%)
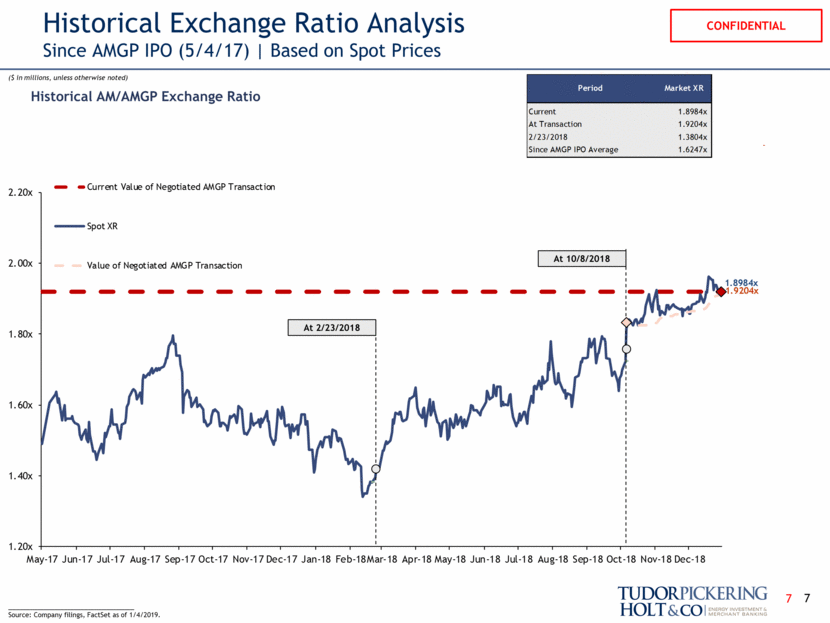
Historical Exchange Ratio Analysis Since AMGP IPO (5/4/17) Based on Spot Prices 7 Historical AM/AMGP Exchange Ratio ___________________________________ Source: Company filings, FactSet as of 1/4/2019. - ($ in millions, unless otherwise noted) At 2/23/2018 At 10/8/2018 7 1.9204x 1.8984x 1.20x 1.40x 1.60x 1.80x 2.00x 2.20x May-17 Jun-17 Jul-17 Aug-17 Sep-17 Oct-17 Nov-17 Dec-17 Jan-18 Feb-18 Mar-18 Apr-18 May-18 Jun-18 Jul-18 Aug-18 Sep-18 Oct-18 Nov-18 Dec-18 Current Value of Negotiated AMGP Transaction Spot XR Value of Negotiated AMGP Transaction Period Market XR Current 1.8984x At Transaction 1.9204x 2/23/2018 1.3804x Since AMGP IPO Average 1.6247x
II. AM Financial Analysis 8
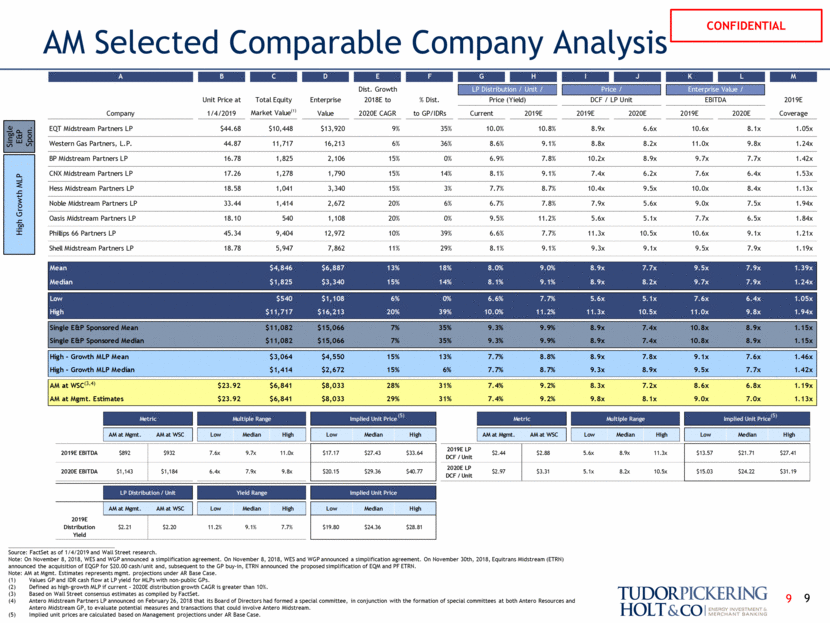
AM Selected Comparable Company Analysis ___________________________________ Source: FactSet as of 1/4/2019 and Wall Street research. Note: On November 8, 2018, WES and WGP announced a simplification agreement. On November 8, 2018, WES and WGP announced a simplification agreement. On November 30th, 2018, Equitrans Midstream (ETRN) announced the acquisition of EQGP for $20.00 cash/unit and, subsequent to the GP buy-in, ETRN announced the proposed simplification of EQM and PF ETRN. Note: AM at Mgmt. Estimates represents mgmt. projections under AR Base Case. Values GP and IDR cash flow at LP yield for MLPs with non-public GPs. Defined as high-growth MLP if current – 2020E distribution growth CAGR is greater than 10%. Based on Wall Street consensus estimates as compiled by FactSet. Antero Midstream Partners LP announced on February 26, 2018 that its Board of Directors had formed a special committee, in conjunction with the formation of special committees at both Antero Resources and Antero Midstream GP, to evaluate potential measures and transactions that could involve Antero Midstream. Implied unit prices are calculated based on Management projections under AR Base Case. (7) (3,4) Single E&P Spon. High Growth MLP (5) (5) 9 9 A B C D E F G H I J K L M Dist. Growth LP Distribution / Unit / Price / Enterprise Value / Unit Price at Total Equity Enterprise 2018E to % Dist. Price (Yield) DCF / LP Unit EBITDA 2019E Company 1/4/2019 Market Value (1) Value 2020E CAGR to GP/IDRs Current 2019E 2019E 2020E 2019E 2020E Coverage EQT Midstream Partners LP $44.68 $10,448 $13,920 9% 35% 10.0% 10.8% 8.9x 6.6x 10.6x 8.1x 1.05x Western Gas Partners, L.P. 44.87 11,717 16,213 6% 36% 8.6% 9.1% 8.8x 8.2x 11.0x 9.8x 1.24x BP Midstream Partners LP 16.78 1,825 2,106 15% 0% 6.9% 7.8% 10.2x 8.9x 9.7x 7.7x 1.42x CNX Midstream Partners LP 17.26 1,278 1,790 15% 14% 8.1% 9.1% 7.4x 6.2x 7.6x 6.4x 1.53x Hess Midstream Partners LP 18.58 1,041 3,340 15% 3% 7.7% 8.7% 10.4x 9.5x 10.0x 8.4x 1.13x Noble Midstream Partners LP 33.44 1,414 2,672 20% 6% 6.7% 7.8% 7.9x 5.6x 9.0x 7.5x 1.94x Oasis Midstream Partners LP 18.10 540 1,108 20% 0% 9.5% 11.2% 5.6x 5.1x 7.7x 6.5x 1.84x Phillips 66 Partners LP 45.34 9,404 12,972 10% 39% 6.6% 7.7% 11.3x 10.5x 10.6x 9.1x 1.21x Shell Midstream Partners LP 18.78 5,947 7,862 11% 29% 8.1% 9.1% 9.3x 9.1x 9.5x 7.9x 1.19x Mean $4,846 $6,887 13% 18% 8.0% 9.0% 8.9x 7.7x 9.5x 7.9x 1.39x Median $1,825 $3,340 15% 14% 8.1% 9.1% 8.9x 8.2x 9.7x 7.9x 1.24x Low $540 $1,108 6% 0% 6.6% 7.7% 5.6x 5.1x 7.6x 6.4x 1.05x High $11,717 $16,213 20% 39% 10.0% 11.2% 11.3x 10.5x 11.0x 9.8x 1.94x Single E&P Sponsored Mean $11,082 $15,066 7% 35% 9.3% 9.9% 8.9x 7.4x 10.8x 8.9x 1.15x Single E&P Sponsored Median $11,082 $15,066 7% 35% 9.3% 9.9% 8.9x 7.4x 10.8x 8.9x 1.15x High - Growth MLP Mean $3,064 $4,550 15% 13% 7.7% 8.8% 8.9x 7.8x 9.1x 7.6x 1.46x High - Growth MLP Median $1,414 $2,672 15% 6% 7.7% 8.7% 9.3x 8.9x 9.5x 7.7x 1.42x AM at WSC $23.92 $6,841 $8,033 28% 31% 7.4% 9.2% 8.3x 7.2x 8.6x 6.8x 1.19x AM at Mgmt. Estimates $23.92 $6,841 $8,033 29% 31% 7.4% 9.2% 9.8x 8.1x 9.0x 7.0x 1.13x Metric Multiple Range Implied Unit Price Metric Multiple Range Implied Unit Price AM at Mgmt. AM at WSC Low Median High Low Median High AM at Mgmt. AM at WSC Low Median High Low Median High 2019E EBITDA $892 $932 7.6x 9.7x 11.0x $17.17 $27.43 $33.64 2019E LP DCF / Unit $2.44 $2.88 5.6x 8.9x 11.3x $13.57 $21.71 $27.41 2020E EBITDA $1,143 $1,184 6.4x 7.9x 9.8x $20.15 $29.36 $40.77 2020E LP DCF / Unit $2.97 $3.31 5.1x 8.2x 10.5x $15.03 $24.22 $31.19 LP Distribution / Unit Yield Range Implied Unit Price AM at Mgmt. AM at WSC Low Median High Low Median High 2019E Distribution Yield $2.21 $2.20 11.2% 9.1% 7.7% $19.80 $24.36 $28.81
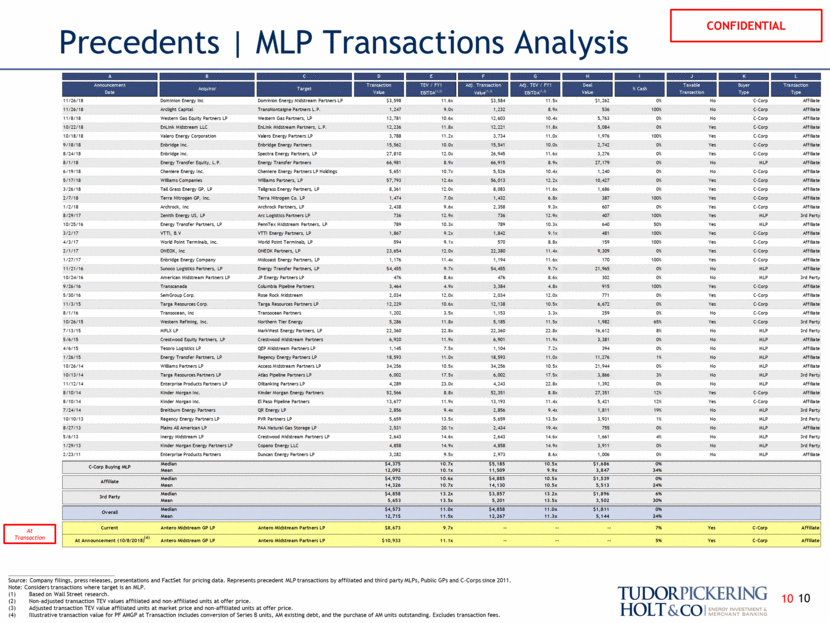
Precedents MLP Transactions Analysis ___________________________________ Source: Company filings, press releases, presentations and FactSet for pricing data. Represents precedent MLP transactions by affiliated and third party MLPs, Public GPs and C-Corps since 2011. Note: Considers transactions where target is an MLP. Based on Wall Street research. Non-adjusted transaction TEV values affiliated and non-affiliated units at offer price. Adjusted transaction TEV value affiliated units at market price and non-affiliated units at offer price. Illustrative transaction value for PF AMGP at Transaction includes conversion of Series B units, AM existing debt, and the purchase of AM units outstanding. Excludes transaction fees. At Transaction 10 (4) 10 A B C D E F G H I J K L Announcement Transaction TEV / FY1 Adj. Transaction Adj. TEV / FY1 Deal Taxable Buyer Transaction Date Value EBITDA (1,2) Value (1,3) EBITDA (1,3) Value Transaction Type Type 11/26/18 Dominion Energy Inc Dominion Energy Midstream Partners LP $3,598 11.6x $3,584 11.5x $1,262 0% No C-Corp Affiliate 11/26/18 Arclight Capital TransMontaigne Partners L.P. 1,247 9.0x 1,232 8.9x 536 100% No C-Corp Affiliate 11/8/18 Western Gas Equity Partners LP Western Gas Partners, LP 12,781 10.6x 12,603 10.4x 5,763 0% No C-Corp Affiliate 10/22/18 EnLink Midstream LLC EnLink Midstream Partners, L.P. 12,236 11.8x 12,221 11.8x 5,084 0% Yes C-Corp Affiliate 10/18/18 Valero Energy Corporation Valero Energy Partners LP 3,788 11.2x 3,734 11.0x 1,976 100% Yes C-Corp Affiliate 9/18/18 Enbridge Inc. Enbridge Energy Partners 15,562 10.0x 15,541 10.0x 2,742 0% Yes C-Corp Affiliate 8/24/18 Enbridge Inc. Spectra Energy Partners, LP 27,810 12.0x 26,945 11.6x 3,276 0% Yes C-Corp Affiliate 8/1/18 Energy Transfer Equity, L.P. Energy Transfer Partners 66,981 8.9x 66,915 8.9x 27,179 0% No MLP Affiliate 6/19/18 Cheniere Energy Inc. Cheniere Energy Partners LP Holdings 5,651 10.7x 5,526 10.4x 1,240 0% No C-Corp Affiliate 5/17/18 Williams Companies Williams Partners, LP 57,793 12.6x 56,013 12.2x 10,427 0% Yes C-Corp Affiliate 3/26/18 Tall Grass Energy GP, LP Tallgrass Energy Partners, LP 8,361 12.0x 8,083 11.6x 1,686 0% Yes C-Corp Affiliate 2/7/18 Terra Nitrogen GP, Inc. Terra Nitrogen Co. LP 1,474 7.0x 1,432 6.8x 387 100% Yes C-Corp Affiliate 1/2/18 Archrock, Inc Archrock Partners, LP 2,438 9.6x 2,358 9.3x 607 0% Yes C-Corp Affiliate 8/29/17 Zenith Energy US, LP Arc Logistics Partners LP 736 12.9x 736 12.9x 407 100% Yes MLP 3rd Party 10/25/16 Energy Transfer Partners, LP PennTex Midstream Partners, LP 789 10.3x 789 10.3x 640 50% Yes MLP Affiliate 3/2/17 VTTI, B.V VTTI Energy Partners, LP 1,867 9.2x 1,842 9.1x 481 100% Yes C-Corp Affiliate 4/3/17 World Point Terminals, Inc. World Point Terminals, LP 594 9.1x 570 8.8x 159 100% Yes C-Corp Affiliate 2/1/17 ONEOK, Inc ONEOK Partners, LP 23,654 12.0x 22,380 11.4x 9,309 0% Yes C-Corp Affiliate 1/27/17 Enbridge Energy Company Midcoast Energy Partners, LP 1,176 11.4x 1,194 11.6x 170 100% Yes C-Corp Affiliate 11/21/16 Sunoco Logistics Partners, LP Energy Transfer Partners, LP 54,455 9.7x 54,455 9.7x 21,965 0% No MLP Affiliate 10/24/16 American Midstream Partners LP JP Energy Partners LP 476 8.6x 476 8.6x 302 0% No MLP 3rd Party 9/26/16 Transcanada Columbia Pipeline Partners 3,464 4.9x 3,384 4.8x 915 100% Yes C-Corp Affiliate 5/30/16 SemGroup Corp. Rose Rock Midstream 2,034 12.0x 2,034 12.0x 771 0% Yes C-Corp Affiliate 11/3/15 Targa Resources Corp. Targa Resources Partners LP 12,229 10.6x 12,138 10.5x 6,672 0% Yes C-Corp Affiliate 8/1/16 Transocean, Inc Transocean Partners 1,202 3.5x 1,153 3.3x 259 0% No C-Corp Affiliate 10/26/15 Western Refining, Inc. Northern Tier Energy 5,286 11.8x 5,185 11.5x 1,982 65% Yes C-Corp 3rd Party 7/13/15 MPLX LP MarkWest Energy Partners, LP 22,360 22.8x 22,360 22.8x 16,612 8% No MLP 3rd Party 5/6/15 Crestwood Equity Partners, LP Crestwood Midstream Partners 6,920 11.9x 6,901 11.9x 3,381 0% No MLP Affiliate 4/6/15 Tesoro Logistics LP QEP Midstream Partners LP 1,145 7.5x 1,104 7.2x 394 0% No MLP Affiliate 1/26/15 Energy Transfer Partners, LP Regency Energy Partners LP 18,593 11.0x 18,593 11.0x 11,276 1% No MLP Affiliate 10/26/14 Williams Partners LP Access Midstream Partners LP 34,256 10.5x 34,256 10.5x 21,944 0% No MLP Affiliate 10/13/14 Targa Resources Partners LP Atlas Pipeline Partners LP 6,002 17.5x 6,002 17.5x 3,866 3% No MLP 3rd Party 11/12/14 Enterprise Products Partners LP Oiltanking Partners LP 4,289 23.0x 4,243 22.8x 1,392 0% No MLP Affiliate 8/10/14 Kinder Morgan Inc. Kinder Morgan Energy Partners 52,566 8.8x 52,351 8.8x 27,351 12% Yes C-Corp Affiliate 8/10/14 Kinder Morgan Inc. El Paso Pipeline Partners 13,677 11.9x 13,193 11.4x 5,421 12% Yes C-Corp Affiliate 7/24/14 Breitburn Energy Partners QR Energy LP 2,856 9.4x 2,856 9.4x 1,811 19% No MLP 3rd Party 10/10/13 Regency Energy Partners LP PVR Partners LP 5,659 13.5x 5,659 13.5x 3,931 1% No MLP 3rd Party 8/27/13 Plains All American LP PAA Natural Gas Storage LP 2,531 20.1x 2,434 19.4x 755 0% No MLP Affiliate 5/6/13 Inergy Midstream LP Crestwood Midstream Partners LP 2,643 14.6x 2,643 14.6x 1,661 4% No MLP 3rd Party 1/29/13 Kinder Morgan Energy Partners LP Copano Energy LLC 4,858 14.9x 4,858 14.9x 3,911 0% No MLP 3rd Party 2/23/11 Enterprise Products Partners Duncan Energy Partners LP 3,282 9.5x 2,973 8.6x 1,006 0% No MLP Affiliate Median $4,375 10.7x $5,185 10.5x $1,686 0% Mean 12,092 10.1x 11,509 9.9x 3,847 34% Median $4,970 10.6x $4,885 10.5x $1,539 0% Mean 14,326 10.7x 14,130 10.5x 5,513 24% Median $4,858 13.2x $3,857 13.2x $1,896 6% Mean 5,653 13.5x 5,201 13.5x 3,502 30% Median $4,573 11.0x $4,858 11.0x $1,811 0% Mean 12,715 11.5x 12,267 11.3x 5,144 24% Current Antero Midstream GP LP Antero Midstream Partners LP $8,673 9.7x -- -- -- 7% Yes C-Corp Affiliate At Announcement (10/8/2018) Antero Midstream GP LP Antero Midstream Partners LP $10,933 11.1x -- -- -- 5% Yes C-Corp Affiliate Overall 3rd Party % Cash Affiliate Acquiror Target C-Corp Buying MLP
AM DCF Analysis AR Base Volumes Case Valuation Effective Date: 12/31/2018 Discounted Levered DCF Analysis Levered DCF Attributable to AM LP Unitholders Discounted Distribution Analysis Distributions Attributable to LP Unitholders Discounted Levered DCF Analysis Supplemental Calculation Detail Discounted Distribution Analysis Supplemental Calculation Detail ___________________________________ Source: Management projections and FactSet as of 1/4/2019. 11 11 2019E 2020E 2021E 2022E LP DCF per Unit $2.44 $2.97 $3.54 $3.89 Discount Factor 0.954 0.867 0.788 PV of LP DCF per Unit $2.32 $2.57 $2.79 Disc. LP DCF Total $7.69 Terminal Multiple 8.5x Terminal Disc. Factor 0.751 Implied Terminal Value per Unit $24.85 Implied Value per Unit $32.54 2019E 2020E 2021E 2022E LP Distribution Per Unit $2.21 $2.85 $3.42 $3.76 Discount Factor 0.954 0.867 0.788 PV of LP Dist. per Unit $2.11 $2.47 $2.70 Disc. LP Dist. Total $7.28 Terminal Yield 9.0% Terminal Disc. Factor 0.751 Implied Terminal Value per Unit $31.39 Implied Value per Unit $38.66 2022E DCF Multiple ##### 7.0x 8.5x 10.0x 8.0% $29.54 $34.17 $38.81 10.0% $28.16 $32.54 $36.93 12.0% $26.87 $31.02 $35.18 Discount Rate 2022E Distribution Yield ##### 10.0% 9.0% 8.0% 8.0% $37.34 $40.65 $44.80 10.0% $35.52 $38.66 $42.59 12.0% $33.84 $36.81 $40.53 Discount Rate

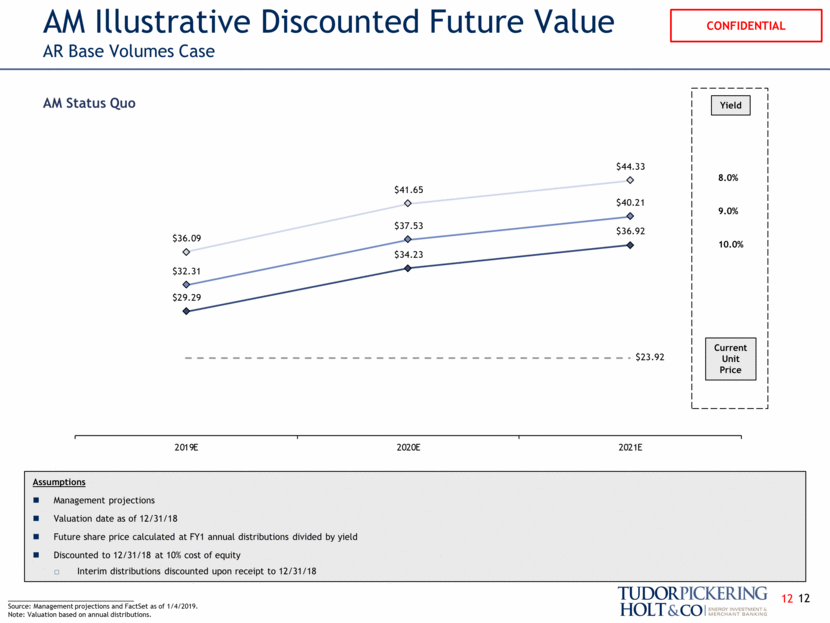
AM Illustrative Discounted Future Value AR Base Volumes Case ___________________________________ Source: Management projections and FactSet as of 1/4/2019. Note: Valuation based on annual distributions. AM Status Quo Assumptions Management projections Valuation date as of 12/31/18 Future share price calculated at FY1 annual distributions divided by yield Discounted to 12/31/18 at 10% cost of equity Interim distributions discounted upon receipt to 12/31/18 8.0% 9.0% 10.0% Current Unit Price Yield 12 12 $29.29 $34.23 $36.92 $32.31 $37.53 $40.21 $36.09 $41.65 $44.33 $23.92 2019E 2020E 2021E
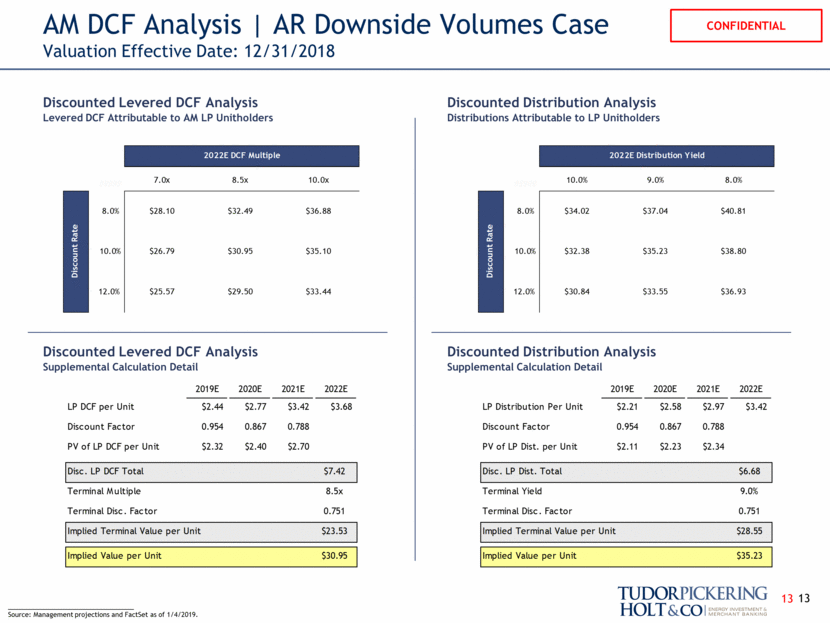
AM DCF Analysis AR Downside Volumes Case Valuation Effective Date: 12/31/2018 Discounted Levered DCF Analysis Levered DCF Attributable to AM LP Unitholders Discounted Distribution Analysis Distributions Attributable to LP Unitholders Discounted Levered DCF Analysis Supplemental Calculation Detail Discounted Distribution Analysis Supplemental Calculation Detail ___________________________________ Source: Management projections and FactSet as of 1/4/2019. 13 13 2019E 2020E 2021E 2022E LP DCF per Unit $2.44 $2.77 $3.42 $3.68 Discount Factor 0.954 0.867 0.788 PV of LP DCF per Unit $2.32 $2.40 $2.70 Disc. LP DCF Total $7.42 Terminal Multiple 8.5x Terminal Disc. Factor 0.751 Implied Terminal Value per Unit $23.53 Implied Value per Unit $30.95 2019E 2020E 2021E 2022E LP Distribution Per Unit $2.21 $2.58 $2.97 $3.42 Discount Factor 0.954 0.867 0.788 PV of LP Dist. per Unit $2.11 $2.23 $2.34 Disc. LP Dist. Total $6.68 Terminal Yield 9.0% Terminal Disc. Factor 0.751 Implied Terminal Value per Unit $28.55 Implied Value per Unit $35.23 2022E Distribution Yield ##### 10.0% 9.0% 8.0% 8.0% $34.02 $37.04 $40.81 10.0% $32.38 $35.23 $38.80 12.0% $30.84 $33.55 $36.93 Discount Rate 2022E DCF Multiple ##### 7.0x 8.5x 10.0x 8.0% $28.10 $32.49 $36.88 10.0% $26.79 $30.95 $35.10 12.0% $25.57 $29.50 $33.44 Discount Rate
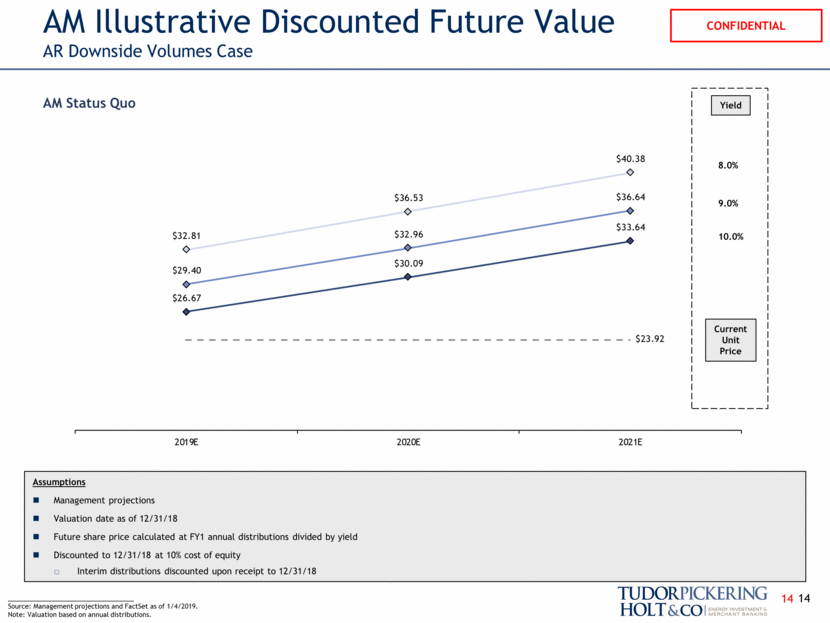
AM Illustrative Discounted Future Value AR Downside Volumes Case ___________________________________ Source: Management projections and FactSet as of 1/4/2019. Note: Valuation based on annual distributions. AM Status Quo Assumptions Management projections Valuation date as of 12/31/18 Future share price calculated at FY1 annual distributions divided by yield Discounted to 12/31/18 at 10% cost of equity Interim distributions discounted upon receipt to 12/31/18 8.0% 9.0% 10.0% Current Unit Price Yield 14 14 $26.67 $30.09 $33.64 $29.40 $32.96 $36.64 $32.81 $36.53 $40.38 $23.92 2019E 2020E 2021E
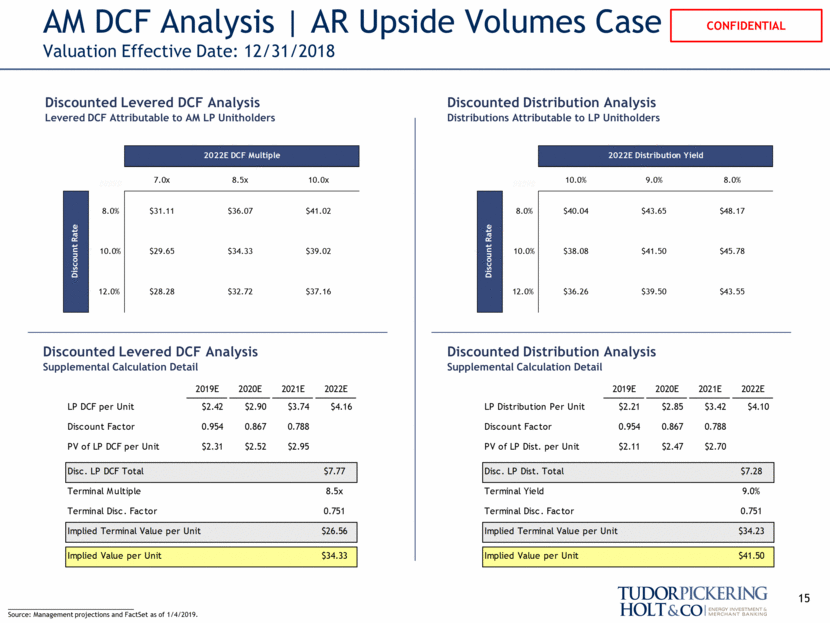
AM DCF Analysis AR Upside Volumes Case Valuation Effective Date: 12/31/2018 Discounted Levered DCF Analysis Levered DCF Attributable to AM LP Unitholders Discounted Distribution Analysis Distributions Attributable to LP Unitholders Discounted Levered DCF Analysis Supplemental Calculation Detail Discounted Distribution Analysis Supplemental Calculation Detail ___________________________________ Source: Management projections and FactSet as of 1/4/2019. 15 2019E 2020E 2021E 2022E LP DCF per Unit $2.42 $2.90 $3.74 $4.16 Discount Factor 0.954 0.867 0.788 PV of LP DCF per Unit $2.31 $2.52 $2.95 Disc. LP DCF Total $7.77 Terminal Multiple 8.5x Terminal Disc. Factor 0.751 Implied Terminal Value per Unit $26.56 Implied Value per Unit $34.33 2019E 2020E 2021E 2022E LP Distribution Per Unit $2.21 $2.85 $3.42 $4.10 Discount Factor 0.954 0.867 0.788 PV of LP Dist. per Unit $2.11 $2.47 $2.70 Disc. LP Dist. Total $7.28 Terminal Yield 9.0% Terminal Disc. Factor 0.751 Implied Terminal Value per Unit $34.23 Implied Value per Unit $41.50 2022E DCF Multiple ##### 7.0x 8.5x 10.0x 8.0% $31.11 $36.07 $41.02 10.0% $29.65 $34.33 $39.02 12.0% $28.28 $32.72 $37.16 Discount Rate 2022E Distribution Yield ##### 10.0% 9.0% 8.0% 8.0% $40.04 $43.65 $48.17 10.0% $38.08 $41.50 $45.78 12.0% $36.26 $39.50 $43.55 Discount Rate
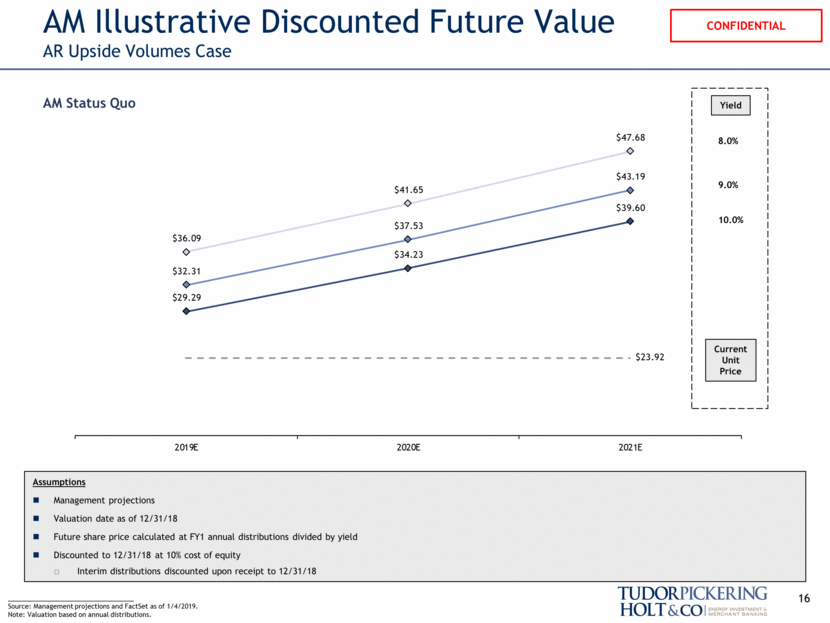
AM Illustrative Discounted Future Value AR Upside Volumes Case ___________________________________ Source: Management projections and FactSet as of 1/4/2019. Note: Valuation based on annual distributions. AM Status Quo Assumptions Management projections Valuation date as of 12/31/18 Future share price calculated at FY1 annual distributions divided by yield Discounted to 12/31/18 at 10% cost of equity Interim distributions discounted upon receipt to 12/31/18 8.0% 9.0% 10.0% Current Unit Price Yield 16 $29.29 $34.23 $39.60 $32.31 $37.53 $43.19 $36.09 $41.65 $47.68 $23.92 2019E 2020E 2021E
III. AMGP Financial Analysis 17
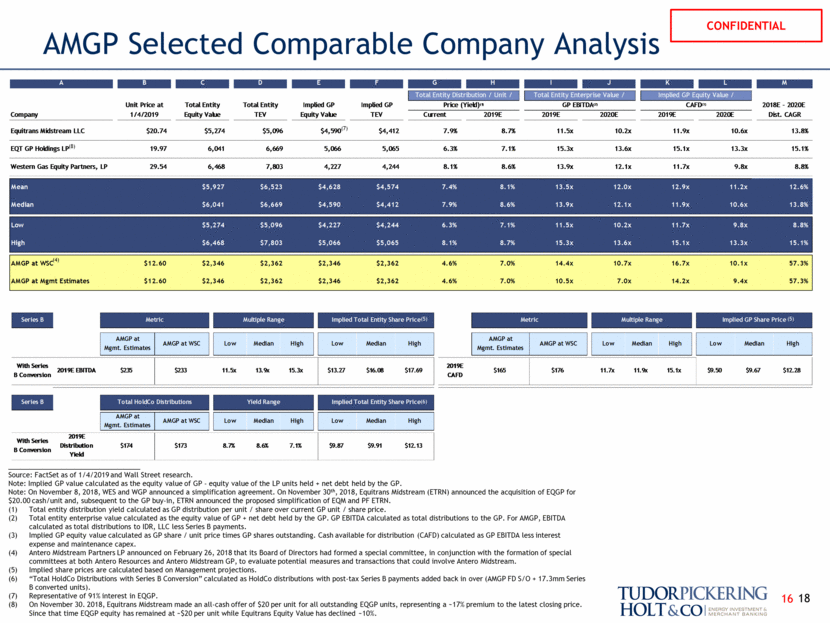
AMGP Selected Comparable Company Analysis ___________________________________ Source: FactSet as of 1/4/2019 and Wall Street research. Note: Implied GP value calculated as the equity value of GP - equity value of the LP units held + net debt held by the GP. Note: On November 8, 2018, WES and WGP announced a simplification agreement. On November 30th, 2018, Equitrans Midstream (ETRN) announced the acquisition of EQGP for $20.00 cash/unit and, subsequent to the GP buy-in, ETRN announced the proposed simplification of EQM and PF ETRN. Total entity distribution yield calculated as GP distribution per unit / share over current GP unit / share price. Total entity enterprise value calculated as the equity value of GP + net debt held by the GP. GP EBITDA calculated as total distributions to the GP. For AMGP, EBITDA calculated as total distributions to IDR, LLC less Series B payments. Implied GP equity value calculated as GP share / unit price times GP shares outstanding. Cash available for distribution (CAFD) calculated as GP EBITDA less interest expense and maintenance capex. Antero Midstream Partners LP announced on February 26, 2018 that its Board of Directors had formed a special committee, in conjunction with the formation of special committees at both Antero Resources and Antero Midstream GP, to evaluate potential measures and transactions that could involve Antero Midstream. Implied share prices are calculated based on Management projections. “Total HoldCo Distributions with Series B Conversion” calculated as HoldCo distributions with post-tax Series B payments added back in over (AMGP FD S/O + 17.3mm Series B converted units). Representative of 91% interest in EQGP. On November 30. 2018, Equitrans Midstream made an all-cash offer of $20 per unit for all outstanding EQGP units, representing a ~17% premium to the latest closing price. Since that time EQGP equity has remained at ~$20 per unit while Equitrans Equity Value has declined ~10%. (4) (5) (5) (6) 18 16 (7) (8) Series B Metric Multiple Range Implied Total Entity Share Price Metric Multiple Range Implied GP Share Price AMGP at Mgmt. Estimates AMGP at WSC Low Median High Low Median High AMGP at Mgmt. Estimates AMGP at WSC Low Median High Low Median High With Series B Conversion 2019E EBITDA $235 $233 11.5x 13.9x 15.3x $13.27 $16.08 $17.69 2019E CAFD $165 $176 11.7x 11.9x 15.1x $9.50 $9.67 $12.28 Series B Total HoldCo Distributions Yield Range Implied Total Entity Share Price AMGP at Mgmt. Estimates AMGP at WSC Low Median High Low Median High With Series B Conversion 2019E Distribution Yield $174 $173 8.7% 8.6% 7.1% $9.87 $9.91 $12.13 A B C D E F G H I J K L M Total Entity Distribution / Unit / Total Entity Enterprise Value / Implied GP Equity Value / Unit Price at Total Entity Total Entity Implied GP Implied GP Price (Yield) (1) GP EBITDA (2) CAFD (3) 2018E - 2020E Company 1/4/2019 Equity Value TEV Equity Value TEV Current 2019E 2019E 2020E 2019E 2020E Dist. CAGR Equitrans Midstream LLC $20.74 $5,274 $5,096 $4,590 $4,412 7.9% 8.7% 11.5x 10.2x 11.9x 10.6x 13.8% EQT GP Holdings LP 19.97 6,041 6,669 5,066 5,065 6.3% 7.1% 15.3x 13.6x 15.1x 13.3x 15.1% Western Gas Equity Partners, LP 29.54 6,468 7,803 4,227 4,244 8.1% 8.6% 13.9x 12.1x 11.7x 9.8x 8.8% Mean $5,927 $6,523 $4,628 $4,574 7.4% 8.1% 13.5x 12.0x 12.9x 11.2x 12.6% Median $6,041 $6,669 $4,590 $4,412 7.9% 8.6% 13.9x 12.1x 11.9x 10.6x 13.8% Low $5,274 $5,096 $4,227 $4,244 6.3% 7.1% 11.5x 10.2x 11.7x 9.8x 8.8% High $6,468 $7,803 $5,066 $5,065 8.1% 8.7% 15.3x 13.6x 15.1x 13.3x 15.1% AMGP at WSC $12.60 $2,346 $2,362 $2,346 $2,362 4.6% 7.0% 14.4x 10.7x 16.7x 10.1x 57.3% AMGP at Mgmt Estimates $12.60 $2,346 $2,362 $2,346 $2,362 4.6% 7.0% 10.5x 7.0x 14.2x 9.4x 57.3%
AMGP DCF Analysis AR Base Volumes Case AMGP with Series B Value Conversion Valuation Effective Date: 12/31/2018 Discounted Levered DCF(1) Analysis Distributions Attributable to IDR, LLC Before Series B Payments Discounted Distribution Analysis Pre-Series B Payment AMGP Distributions 1.0x Coverage SQ AM Distribution Policy Discounted Levered DCF(1) Analysis Supplemental Calculation Detail Discounted Distribution Analysis Supplemental Calculation Detail ___________________________________ Source: Management projections and FactSet as of 1/4/2019. AMGP discounted DCF defined as HoldCo DCF with Series B payments added back in. Discounted cost of equity at 10.0%. Adj. GP distribution per share calculated as (AMGP DCF + Series B payment added back) / (fully diluted AMGP shares outstanding + 17.354mm converted Series B units). 19 17 2022E CAFD Multiple $22 11.0x 12.5x 14.0x 8.0% $20.52 $22.85 $25.18 10.0% $19.50 $21.71 $23.91 12.0% $18.55 $20.64 $22.73 Discount Rate 2022E Distribution Yield ##### 9.0% 8.0% 7.0% 8.0% $20.69 $22.85 $25.62 10.0% $19.67 $21.71 $24.33 12.0% $18.71 $20.64 $23.13 Discount Rate 2019E 2020E 2021E 2022E HoldCo DCF $177 $269 $350 $398 Discount Factor 0.954 0.867 0.788 PV of GP FCF $169 $233 $276 Disc. IDR Distribution Total $678 Terminal Multiple 12.5x Terminal Disc. Factor 0.751 Implied Equity Value $4,419 AMGP Shares O/S (Inclusive of 17.354mm Series B Conversion Shares) 203.6 Implied Equity Value per Share $21.71 2019E 2020E 2021E 2022E Adj. GP Dist. Per Share (2) $0.87 $1.32 $1.72 $1.96 Discount Factor 0.954 0.867 0.788 PV of GP Dist. per Share $0.83 $1.14 $1.35 Disc. Adj. Dist. Total $3.33 Terminal Yield 8.0% Terminal Disc. Factor 0.751 Implied Terminal Value per Share $18.38 Implied Equity Value per Share $21.71

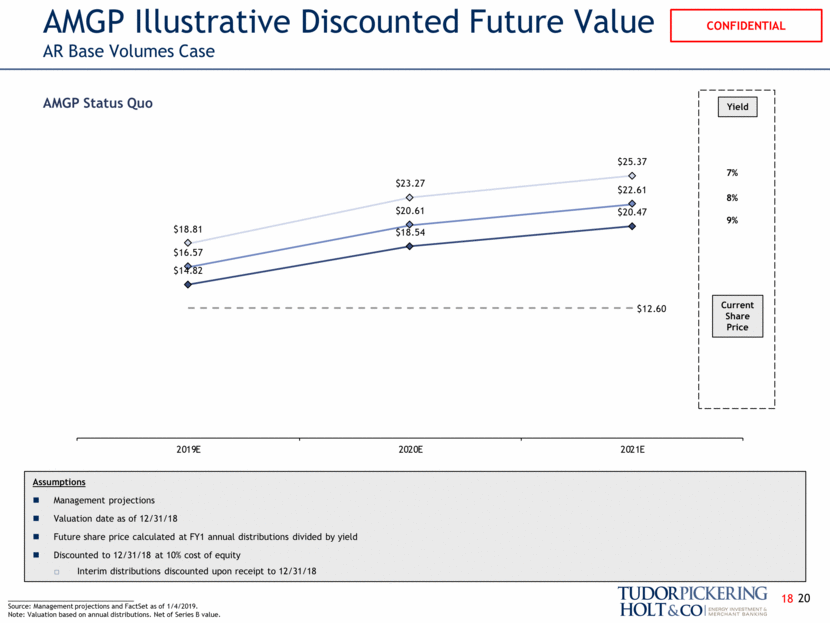
AMGP Illustrative Discounted Future Value AR Base Volumes Case ___________________________________ Source: Management projections and FactSet as of 1/4/2019. Note: Valuation based on annual distributions. Net of Series B value. AMGP Status Quo Assumptions Management projections Valuation date as of 12/31/18 Future share price calculated at FY1 annual distributions divided by yield Discounted to 12/31/18 at 10% cost of equity Interim distributions discounted upon receipt to 12/31/18 7% 8% 9% Current Share Price Yield 20 18 $14.82 $18.54 $20.47 $16.57 $20.61 $22.61 $18.81 $23.27 $25.37 $12.60 2019E 2020E 2021E
AMGP DCF Analysis AR Downside Volumes Case AMGP with Series B Value Conversion Valuation Effective Date: 12/31/2018 Discounted Levered DCF(1) Analysis Distributions Attributable to IDR, LLC Before Series B Payments Discounted Distribution Analysis Pre-Series B Payment AMGP Distributions 1.0x Coverage SQ AM Distribution Policy Discounted Levered DCF(1) Analysis Supplemental Calculation Detail Discounted Distribution Analysis Supplemental Calculation Detail ___________________________________ Source: Management projections and FactSet as of 1/4/2019. AMGP discounted IDR distribution defined as HoldCo DCF with Series B payments added back in. Discounted cost of equity at 10.0%. Adj. GP distribution per share calculated as (AMGP DCF + Series B payment added back) / (fully diluted AMGP shares outstanding + 17.354mm converted Series B units). 21 19 2022E CAFD Multiple $19 11.0x 12.5x 14.0x 8.0% $18.01 $20.06 $22.10 10.0% $17.12 $19.06 $20.99 12.0% $16.29 $18.13 $19.96 Discount Rate 2022E Distribution Yield ##### 9.0% 8.0% 7.0% 8.0% $18.16 $20.06 $22.49 10.0% $17.26 $19.06 $21.36 12.0% $16.43 $18.13 $20.31 Discount Rate 2019E 2020E 2021E 2022E HoldCo DCF $177 $229 $286 $350 Discount Factor 0.954 0.867 0.788 PV of GP FCF $169 $199 $225 Disc. IDR Distribution Total $593 Terminal Multiple 12.5x Terminal Disc. Factor 0.751 Implied Equity Value $3,879 AMGP Shares O/S (Inclusive of 17.354mm Series B Conversion Shares) 203.6 Implied Equity Value per Share $19.06 2019E 2020E 2021E 2022E Adj. GP Dist. Per Share (2) $0.87 $1.13 $1.40 $1.72 Discount Factor 0.954 0.867 0.788 PV of GP Dist. per Share $0.83 $0.98 $1.11 Disc. Adj. Dist. Total $2.92 Terminal Yield 8.0% Terminal Disc. Factor 0.751 Implied Terminal Value per Share $16.14 Implied Equity Value per Share $19.06

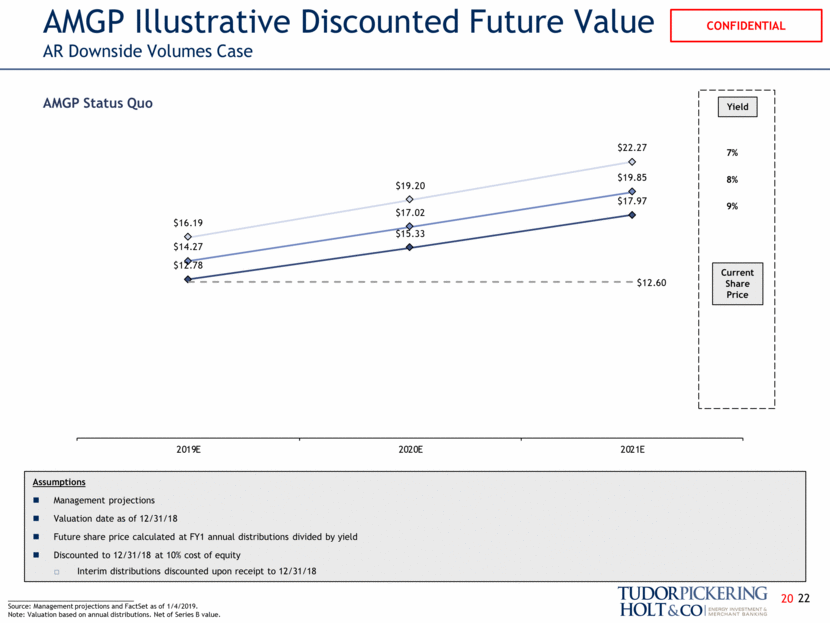
AMGP Illustrative Discounted Future Value AR Downside Volumes Case ___________________________________ Source: Management projections and FactSet as of 1/4/2019. Note: Valuation based on annual distributions. Net of Series B value. AMGP Status Quo Assumptions Management projections Valuation date as of 12/31/18 Future share price calculated at FY1 annual distributions divided by yield Discounted to 12/31/18 at 10% cost of equity Interim distributions discounted upon receipt to 12/31/18 7% 8% 9% Current Share Price Yield 22 20 $12.78 $15.33 $17.97 $14.27 $17.02 $19.85 $16.19 $19.20 $22.27 $12.60 2019E 2020E 2021E
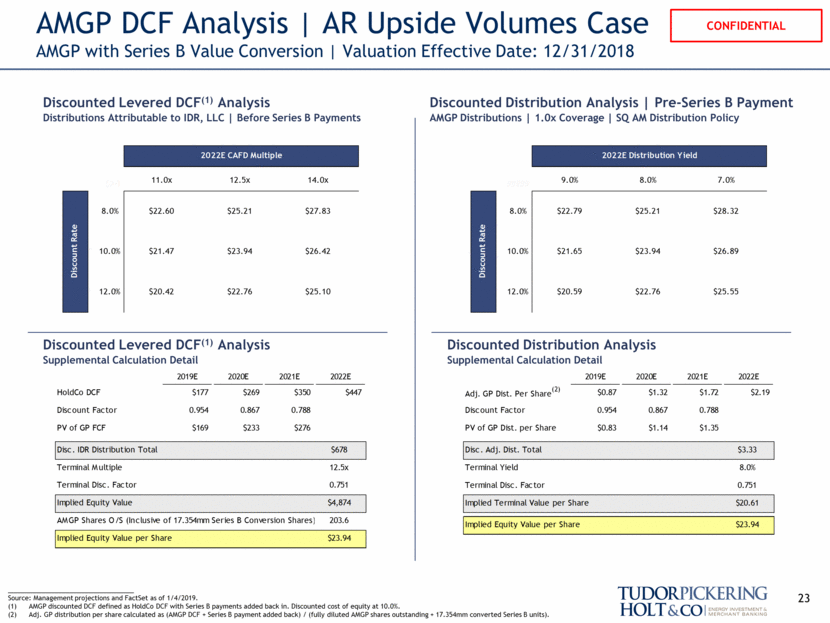
AMGP DCF Analysis AR Upside Volumes Case AMGP with Series B Value Conversion Valuation Effective Date: 12/31/2018 Discounted Levered DCF(1) Analysis Distributions Attributable to IDR, LLC Before Series B Payments Discounted Distribution Analysis Pre-Series B Payment AMGP Distributions 1.0x Coverage SQ AM Distribution Policy Discounted Levered DCF(1) Analysis Supplemental Calculation Detail Discounted Distribution Analysis Supplemental Calculation Detail ___________________________________ Source: Management projections and FactSet as of 1/4/2019. AMGP discounted DCF defined as HoldCo DCF with Series B payments added back in. Discounted cost of equity at 10.0%. Adj. GP distribution per share calculated as (AMGP DCF + Series B payment added back) / (fully diluted AMGP shares outstanding + 17.354mm converted Series B units). 23 2022E CAFD Multiple $24 11.0x 12.5x 14.0x 8.0% $22.60 $25.21 $27.83 10.0% $21.47 $23.94 $26.42 12.0% $20.42 $22.76 $25.10 Discount Rate 2022E Distribution Yield ##### 9.0% 8.0% 7.0% 8.0% $22.79 $25.21 $28.32 10.0% $21.65 $23.94 $26.89 12.0% $20.59 $22.76 $25.55 Discount Rate 2019E 2020E 2021E 2022E HoldCo DCF $177 $269 $350 $447 Discount Factor 0.954 0.867 0.788 PV of GP FCF $169 $233 $276 Disc. IDR Distribution Total $678 Terminal Multiple 12.5x Terminal Disc. Factor 0.751 Implied Equity Value $4,874 AMGP Shares O/S (Inclusive of 17.354mm Series B Conversion Shares) 203.6 Implied Equity Value per Share $23.94 2019E 2020E 2021E 2022E Adj. GP Dist. Per Share (2) $0.87 $1.32 $1.72 $2.19 Discount Factor 0.954 0.867 0.788 PV of GP Dist. per Share $0.83 $1.14 $1.35 Disc. Adj. Dist. Total $3.33 Terminal Yield 8.0% Terminal Disc. Factor 0.751 Implied Terminal Value per Share $20.61 Implied Equity Value per Share $23.94
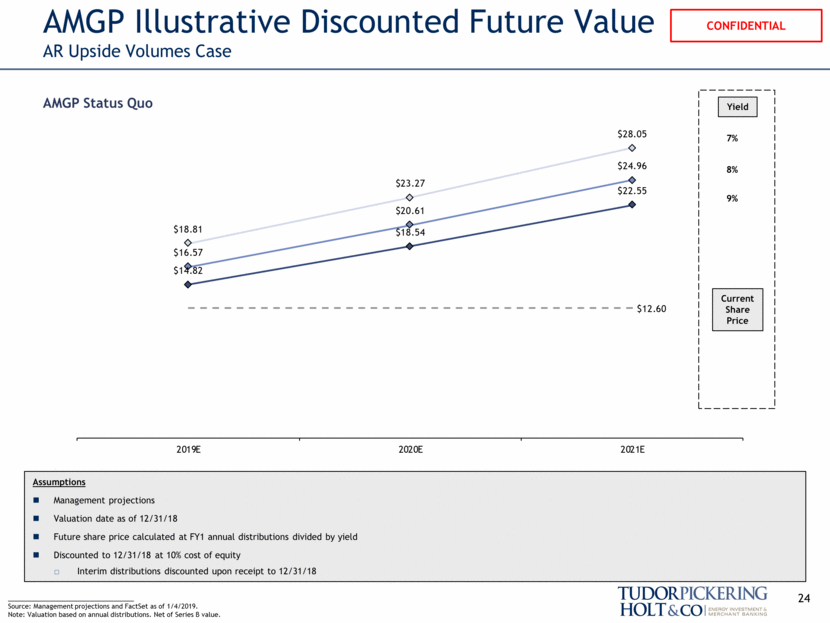
AMGP Illustrative Discounted Future Value AR Upside Volumes Case ___________________________________ Source: Management projections and FactSet as of 1/4/2019. Note: Valuation based on annual distributions. Net of Series B value. AMGP Status Quo Assumptions Management projections Valuation date as of 12/31/18 Future share price calculated at FY1 annual distributions divided by yield Discounted to 12/31/18 at 10% cost of equity Interim distributions discounted upon receipt to 12/31/18 7% 8% 9% Current Share Price Yield 24 $14.82 $18.54 $22.55 $16.57 $20.61 $24.96 $18.81 $23.27 $28.05 $12.60 2019E 2020E 2021E
IV. Analysis of Transaction 25
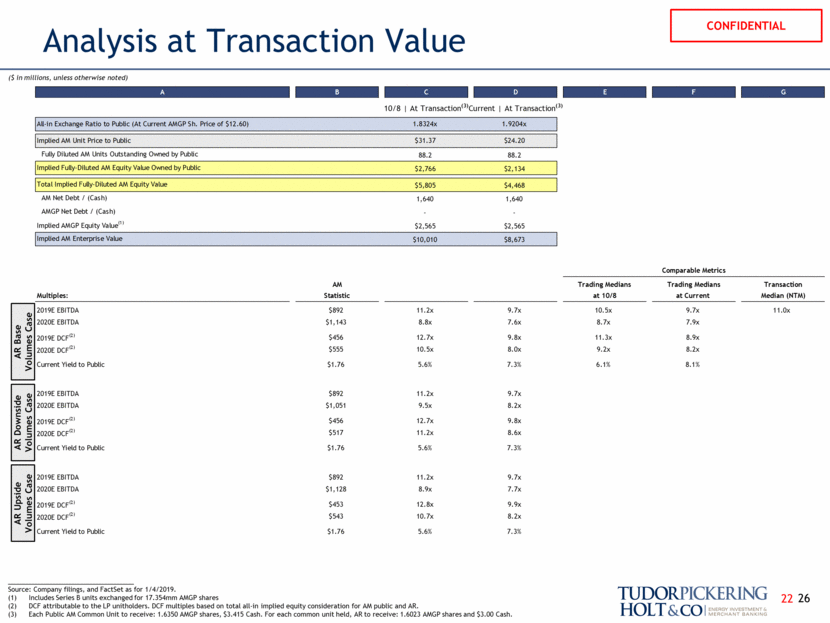
Analysis at Transaction Value ___________________________________ Source: Company filings, and FactSet as for 1/4/2019. Includes Series B units exchanged for 17.354mm AMGP shares DCF attributable to the LP unitholders. DCF multiples based on total all-in implied equity consideration for AM public and AR. Each Public AM Common Unit to receive: 1.6350 AMGP shares, $3.415 Cash. For each common unit held, AR to receive: 1.6023 AMGP shares and $3.00 Cash. ($ in millions, unless otherwise noted) AR Downside Volumes Case AR Base Volumes Case 26 AR Upside Volumes Case 22 A B C D E F G 10/8 At Transaction (3) Current At Transaction (3) All-in Exchange Ratio to Public (At Current AMGP Sh. Price of $12.60) 1.8324x 1.9204x Implied AM Unit Price to Public $31.37 $24.20 Fully Diluted AM Units Outstanding Owned by Public 88.2 88.2 Implied Fully-Diluted AM Equity Value Owned by Public $2,766 $2,134 Total Implied Fully-Diluted AM Equity Value $5,805 $4,468 AM Net Debt / (Cash) 1,640 1,640 AMGP Net Debt / (Cash) - - Implied AMGP Equity Value (1) $2,565 $2,565 Implied AM Enterprise Value $10,010 $8,673 Comparable Metrics AM Trading Medians Trading Medians Transaction Multiples: Statistic at 10/8 at Current Median (NTM) 2019E EBITDA $892 11.2x 9.7x 10.5x 9.7x 11.0x 2020E EBITDA $1,143 8.8x 7.6x 8.7x 7.9x 2019E DCF (2) $456 12.7x 9.8x 11.3x 8.9x 2020E DCF (2) $555 10.5x 8.0x 9.2x 8.2x Current Yield to Public $1.76 5.6% 7.3% 6.1% 8.1% 2019E EBITDA $892 11.2x 9.7x 2020E EBITDA $1,051 9.5x 8.2x 2019E DCF (2) $456 12.7x 9.8x 2020E DCF (2) $517 11.2x 8.6x Current Yield to Public $1.76 5.6% 7.3% 2019E EBITDA $892 11.2x 9.7x 2020E EBITDA $1,128 8.9x 7.7x 2019E DCF (2) $453 12.8x 9.9x 2020E DCF (2) $543 10.7x 8.2x Current Yield to Public $1.76 5.6% 7.3%
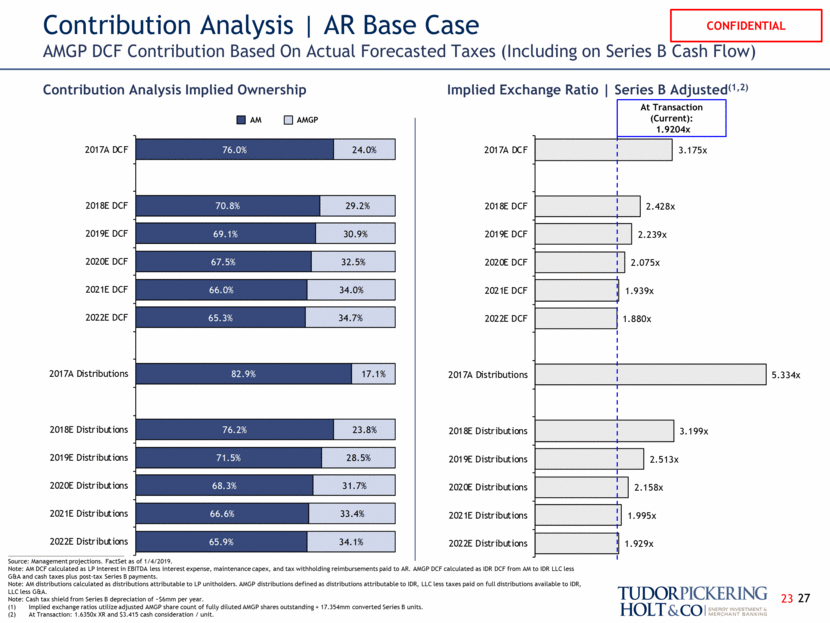
Contribution Analysis AR Base Case AMGP DCF Contribution Based On Actual Forecasted Taxes (Including on Series B Cash Flow) Contribution Analysis Implied Ownership Implied Exchange Ratio Series B Adjusted(1,2) AMGP AM 27 27 ___________________________________ Source: Management projections. FactSet as of 1/4/2019. Note: AM DCF calculated as LP Interest in EBITDA less interest expense, maintenance capex, and tax withholding reimbursements paid to AR. AMGP DCF calculated as IDR DCF from AM to IDR LLC less G&A and cash taxes plus post-tax Series B payments. Note: AM distributions calculated as distributions attributable to LP unitholders. AMGP distributions defined as distributions attributable to IDR, LLC less taxes paid on full distributions available to IDR, LLC less G&A. Note: Cash tax shield from Series B depreciation of ~$6mm per year. Implied exchange ratios utilize adjusted AMGP share count of fully diluted AMGP shares outstanding + 17.354mm converted Series B units. At Transaction: 1.6350x XR and $3.415 cash consideration / unit. At Transaction (Current): 1.9204x 23 3.175x 2.428x 2.239x 2.075x 1.939x 1.880x 5.334x 3.199x 2.513x 2.158x 1.995x 1.929x 2017A DCF 2018E DCF 2019E DCF 2020E DCF 2021E DCF 2022E DCF 2017A Distributions 2018E Distributions 2019E Distributions 2020E Distributions 2021E Distributions 2022E Distributions 76.0% 70.8% 69.1% 67.5% 66.0% 65.3% 82.9% 76.2% 71.5% 68.3% 66.6% 65.9% 24.0% 29.2% 30.9% 32.5% 34.0% 34.7% 17.1% 23.8% 28.5% 31.7% 33.4% 34.1% 2017A DCF 2018E DCF 2019E DCF 2020E DCF 2021E DCF 2022E DCF 2017A Distributions 2018E Distributions 2019E Distributions 2020E Distributions 2021E Distributions 2022E Distributions
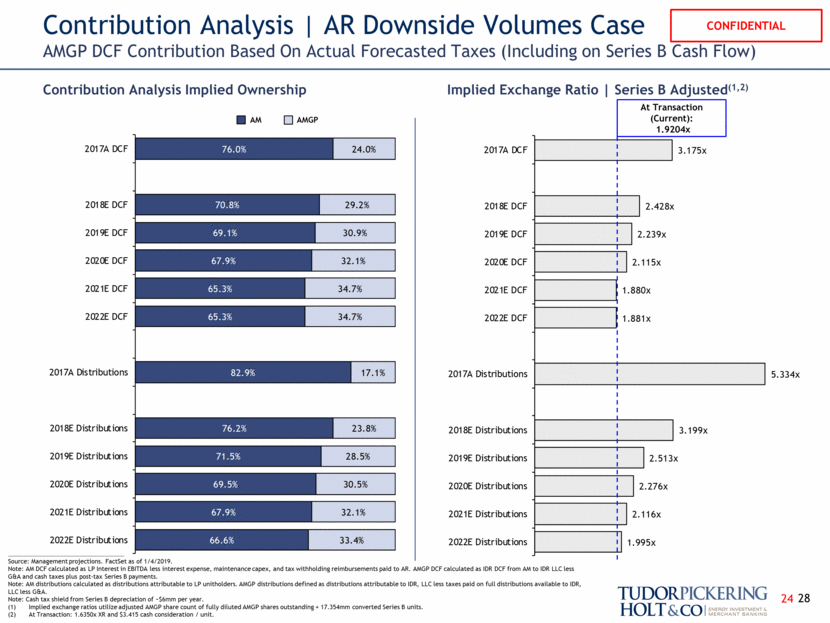
Contribution Analysis AR Downside Volumes Case AMGP DCF Contribution Based On Actual Forecasted Taxes (Including on Series B Cash Flow) Contribution Analysis Implied Ownership Implied Exchange Ratio Series B Adjusted(1,2) ___________________________________ Source: Management projections. FactSet as of 1/4/2019. Note: AM DCF calculated as LP Interest in EBITDA less interest expense, maintenance capex, and tax withholding reimbursements paid to AR. AMGP DCF calculated as IDR DCF from AM to IDR LLC less G&A and cash taxes plus post-tax Series B payments. Note: AM distributions calculated as distributions attributable to LP unitholders. AMGP distributions defined as distributions attributable to IDR, LLC less taxes paid on full distributions available to IDR, LLC less G&A. Note: Cash tax shield from Series B depreciation of ~$6mm per year. Implied exchange ratios utilize adjusted AMGP share count of fully diluted AMGP shares outstanding + 17.354mm converted Series B units. At Transaction: 1.6350x XR and $3.415 cash consideration / unit. AMGP AM 28 At Transaction (Current): 1.9204x 24 3.175x 2.428x 2.239x 2.115x 1.880x 1.881x 5.334x 3.199x 2.513x 2.276x 2.116x 1.995x 2017A DCF 2018E DCF 2019E DCF 2020E DCF 2021E DCF 2022E DCF 2017A Distributions 2018E Distributions 2019E Distributions 2020E Distributions 2021E Distributions 2022E Distributions 76.0% 70.8% 69.1% 67.9% 65.3% 65.3% 82.9% 76.2% 71.5% 69.5% 67.9% 66.6% 24.0% 29.2% 30.9% 32.1% 34.7% 34.7% 17.1% 23.8% 28.5% 30.5% 32.1% 33.4% 2017A DCF 2018E DCF 2019E DCF 2020E DCF 2021E DCF 2022E DCF 2017A Distributions 2018E Distributions 2019E Distributions 2020E Distributions 2021E Distributions 2022E Distributions
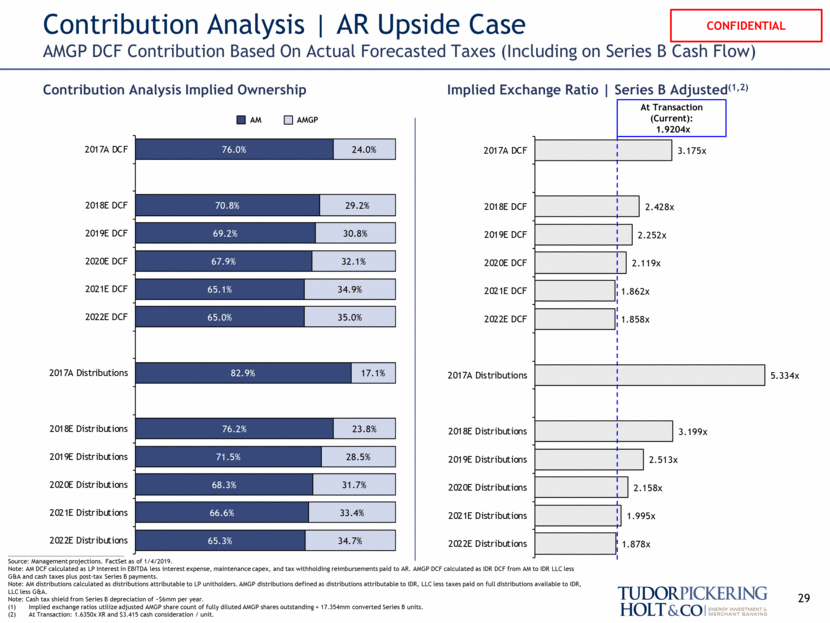
Contribution Analysis AR Upside Case AMGP DCF Contribution Based On Actual Forecasted Taxes (Including on Series B Cash Flow) Contribution Analysis Implied Ownership Implied Exchange Ratio Series B Adjusted(1,2) ___________________________________ Source: Management projections. FactSet as of 1/4/2019. Note: AM DCF calculated as LP Interest in EBITDA less interest expense, maintenance capex, and tax withholding reimbursements paid to AR. AMGP DCF calculated as IDR DCF from AM to IDR LLC less G&A and cash taxes plus post-tax Series B payments. Note: AM distributions calculated as distributions attributable to LP unitholders. AMGP distributions defined as distributions attributable to IDR, LLC less taxes paid on full distributions available to IDR, LLC less G&A. Note: Cash tax shield from Series B depreciation of ~$6mm per year. Implied exchange ratios utilize adjusted AMGP share count of fully diluted AMGP shares outstanding + 17.354mm converted Series B units. At Transaction: 1.6350x XR and $3.415 cash consideration / unit. AMGP AM 29 At Transaction (Current): 1.9204x 3.175x 2.428x 2.252x 2.119x 1.862x 1.858x 5.334x 3.199x 2.513x 2.158x 1.995x 1.878x 2017A DCF 2018E DCF 2019E DCF 2020E DCF 2021E DCF 2022E DCF 2017A Distributions 2018E Distributions 2019E Distributions 2020E Distributions 2021E Distributions 2022E Distributions 76.0% 70.8% 69.2% 67.9% 65.1% 65.0% 82.9% 76.2% 71.5% 68.3% 66.6% 65.3% 24.0% 29.2% 30.8% 32.1% 34.9% 35.0% 17.1% 23.8% 28.5% 31.7% 33.4% 34.7% 2017A DCF 2018E DCF 2019E DCF 2020E DCF 2021E DCF 2022E DCF 2017A Distributions 2018E Distributions 2019E Distributions 2020E Distributions 2021E Distributions 2022E Distributions
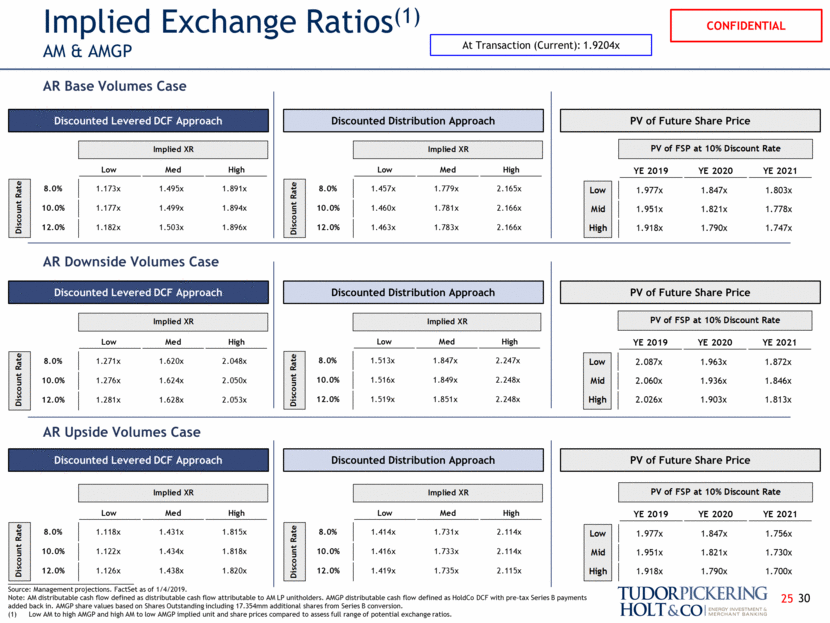
Implied Exchange Ratios(1) AM & AMGP AR Base Volumes Case AR Downside Volumes Case Discounted Levered DCF Approach Discounted Levered DCF Approach ___________________________________ Source: Management projections. FactSet as of 1/4/2019. Note: AM distributable cash flow defined as distributable cash flow attributable to AM LP unitholders. AMGP distributable cash flow defined as HoldCo DCF with pre-tax Series B payments added back in. AMGP share values based on Shares Outstanding including 17.354mm additional shares from Series B conversion. Low AM to high AMGP and high AM to low AMGP implied unit and share prices compared to assess full range of potential exchange ratios. Discounted Distribution Approach Discounted Distribution Approach PV of Future Share Price PV of Future Share Price At Transaction (Current): 1.9204x 30 Discounted Levered DCF Approach Discounted Distribution Approach PV of Future Share Price AR Upside Volumes Case 25 Implied XR Low Med High 8.0% 1.457x 1.779x 2.165x 10.0% 1.460x 1.781x 2.166x 12.0% 1.463x 1.783x 2.166x Discount Rate Implied XR Low Med High 8.0% 1.513x 1.847x 2.247x 10.0% 1.516x 1.849x 2.248x 12.0% 1.519x 1.851x 2.248x Discount Rate PV of FSP at 10% Discount Rate YE 2019 YE 2020 YE 2021 Low 1.977x 1.847x 1.803x Mid 1.951x 1.821x 1.778x High 1.918x 1.790x 1.747x Implied XR Low Med High 8.0% 1.271x 1.620x 2.048x 10.0% 1.276x 1.624x 2.050x 12.0% 1.281x 1.628x 2.053x Discount Rate Implied XR Low Med High 8.0% 1.173x 1.495x 1.891x 10.0% 1.177x 1.499x 1.894x 12.0% 1.182x 1.503x 1.896x Discount Rate PV of FSP at 10% Discount Rate YE 2019 YE 2020 YE 2021 Low 2.087x 1.963x 1.872x Mid 2.060x 1.936x 1.846x High 2.026x 1.903x 1.813x Implied XR Low Med High 8.0% 1.414x 1.731x 2.114x 10.0% 1.416x 1.733x 2.114x 12.0% 1.419x 1.735x 2.115x Discount Rate PV of FSP at 10% Discount Rate YE 2019 YE 2020 YE 2021 Low 1.977x 1.847x 1.756x Mid 1.951x 1.821x 1.730x High 1.918x 1.790x 1.700x Implied XR Low Med High 8.0% 1.118x 1.431x 1.815x 10.0% 1.122x 1.434x 1.818x 12.0% 1.126x 1.438x 1.820x Discount Rate
V. Pro Forma Impact for Transaction 31
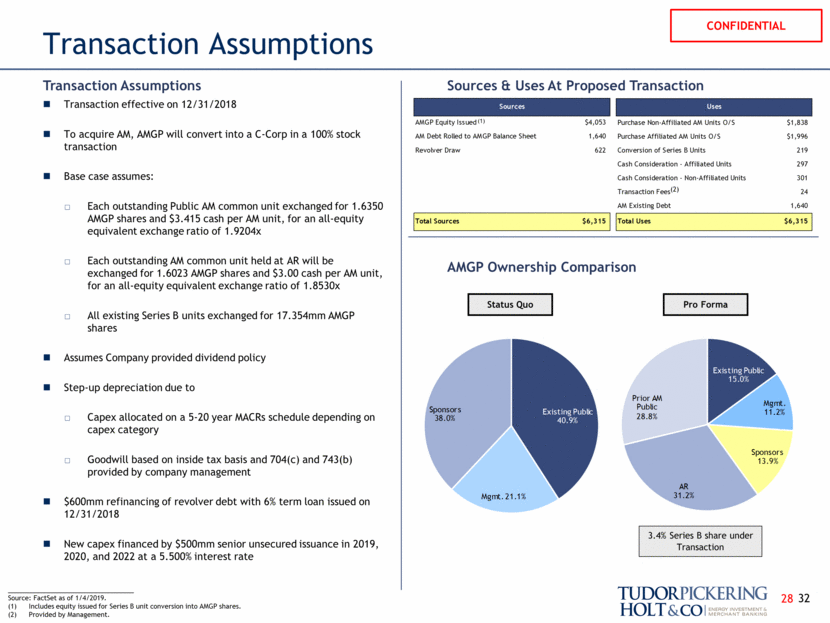
Transaction Assumptions ___________________________________ Source: FactSet as of 1/4/2019. Includes equity issued for Series B unit conversion into AMGP shares. Provided by Management. Status Quo Pro Forma Transaction effective on 12/31/2018 To acquire AM, AMGP will convert into a C-Corp in a 100% stock transaction Base case assumes: Each outstanding Public AM common unit exchanged for 1.6350 AMGP shares and $3.415 cash per AM unit, for an all-equity equivalent exchange ratio of 1.9204x Each outstanding AM common unit held at AR will be exchanged for 1.6023 AMGP shares and $3.00 cash per AM unit, for an all-equity equivalent exchange ratio of 1.8530x All existing Series B units exchanged for 17.354mm AMGP shares Assumes Company provided dividend policy Step-up depreciation due to Capex allocated on a 5-20 year MACRs schedule depending on capex category Goodwill based on inside tax basis and 704(c) and 743(b) provided by company management $600mm refinancing of revolver debt with 6% term loan issued on 12/31/2018 New capex financed by $500mm senior unsecured issuance in 2019, 2020, and 2022 at a 5.500% interest rate Transaction Assumptions Sources & Uses At Proposed Transaction AMGP Ownership Comparison (1) (2) 3.4% Series B share under Transaction 32 28 Sources AMGP Equity Issued $4,053 AM Debt Rolled to AMGP Balance Sheet 1,640 Revolver Draw 622 Total Sources $6,315 Existing Public 15.0% Mgmt. 11.2% Sponsors 13.9% AR 31.2% Prior AM Public 28.8% Existing Public 40.9% Mgmt. 21.1% Sponsors 38.0% Uses Purchase Non-Affiliated AM Units O/S $1,838 Purchase Affiliated AM Units O/S $1,996 Conversion of Series B Units 219 Cash Consideration - Affiliated Units 297 Cash Consideration - Non-Affiliated Units 301 Transaction Fees 24 AM Existing Debt 1,640 Total Uses $6,315
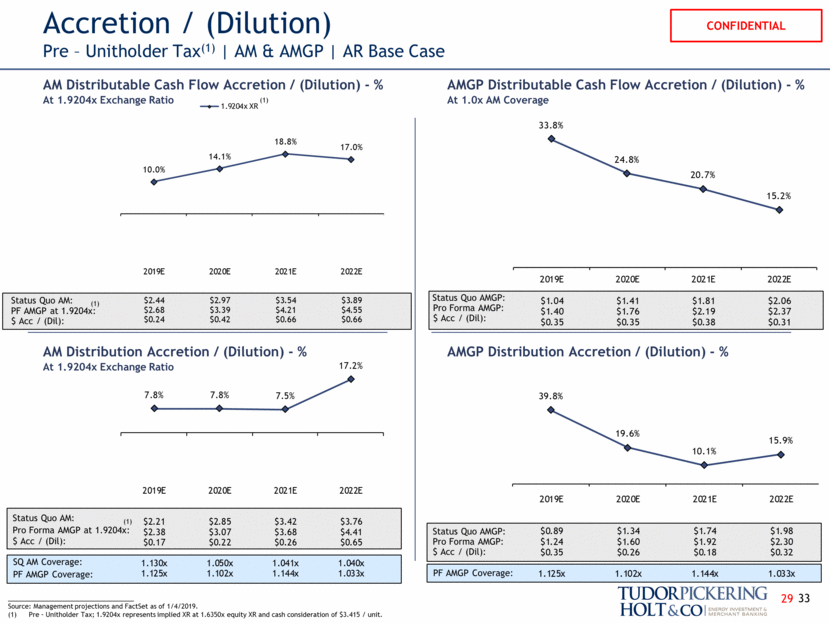
Accretion / (Dilution) Pre – Unitholder Tax(1) AM & AMGP AR Base Case AM Distributable Cash Flow Accretion / (Dilution) - % At 1.9204x Exchange Ratio AMGP Distributable Cash Flow Accretion / (Dilution) - % At 1.0x AM Coverage ___________________________________ Source: Management projections and FactSet as of 1/4/2019. Pre – Unitholder Tax; 1.9204x represents implied XR at 1.6350x equity XR and cash consideration of $3.415 / unit. Status Quo AMGP: Pro Forma AMGP: $ Acc / (Dil): 33 Status Quo AM: PF AMGP at 1.9204x: AM Distribution Accretion / (Dilution) - % At 1.9204x Exchange Ratio AMGP Distribution Accretion / (Dilution) - % $ Acc / (Dil): Status Quo AM: Pro Forma AMGP at 1.9204x: $ Acc / (Dil): (1) PF AMGP Coverage: Status Quo AMGP: Pro Forma AMGP: $ Acc / (Dil): PF AMGP Coverage: SQ AM Coverage: (1) (1) 29 10.0% 14.1% 18.8% 17.0% 2H 2018E $1.02 $0.95 $0.98 ($0.07) ($0.04) 2019E $2.44 $2.60 $2.68 $0.16 $0.24 2020E $2.97 $3.28 $3.39 $0.31 $0.42 2021E $3.54 $4.08 $4.21 $0.54 $0.66 1.9204x XR 10.0% 14.1% 18.8% 17.0% 2019E $2.44 $2.68 $0.24 2020E $2.97 $3.39 $0.42 2021E $3.54 $4.21 $0.66 2022E $3.89 $4.55 $0.66 7.8% 7.8% 7.5% 17.2% 2019E $2.21 $2.38 $0.17 1.130x 1.125x 2020E $2.85 $3.07 $0.22 1.050x 1.102x 2021E $3.42 $3.68 $0.26 1.041x 1.144x 2022E $3.76 $4.41 $0.65 1.040x 1.033x 39.8% 19.6% 10.1% 15.9% 2019E $0.89 $1.24 $0.35 1.125x 2020E $1.34 $1.60 $0.26 1.102x 2021E $1.74 $1.92 $0.18 1.144x 2022E $1.98 $2.30 $0.32 1.033x 33.8% 24.8% 20.7% 15.2% 2019E $1.04 $1.40 $0.35 2020E $1.41 $1.76 $0.35 2021E $1.81 $2.19 $0.38 2022E $2.06 $2.37 $0.31
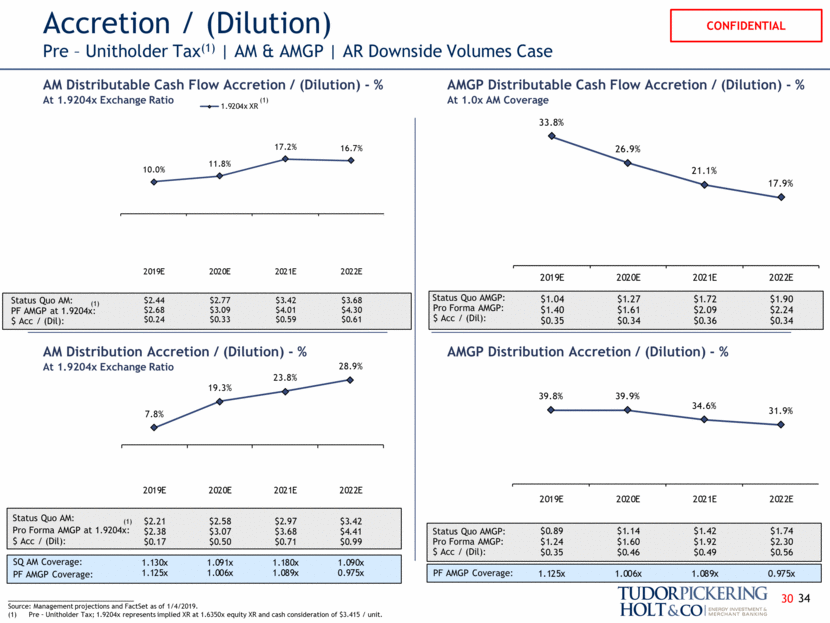
Status Quo AMGP: Pro Forma AMGP: $ Acc / (Dil): PF AMGP Coverage: AM Distributable Cash Flow Accretion / (Dilution) - % At 1.9204x Exchange Ratio Accretion / (Dilution) Pre – Unitholder Tax(1) AM & AMGP AR Downside Volumes Case AMGP Distributable Cash Flow Accretion / (Dilution) - % At 1.0x AM Coverage ___________________________________ Source: Management projections and FactSet as of 1/4/2019. Pre – Unitholder Tax; 1.9204x represents implied XR at 1.6350x equity XR and cash consideration of $3.415 / unit. Status Quo AMGP: Pro Forma AMGP: $ Acc / (Dil): 34 AM Distribution Accretion / (Dilution) - % At 1.9204x Exchange Ratio AMGP Distribution Accretion / (Dilution) - % PF AMGP Coverage: Status Quo AM: PF AMGP at 1.9204x: $ Acc / (Dil): (1) Status Quo AM: Pro Forma AMGP at 1.9204x: $ Acc / (Dil): (1) PF AMGP Coverage: SQ AM Coverage: (1) 30 7.8% 19.3% 23.8% 28.9% 2019E $2.21 $2.38 $0.17 1.130x 1.125x 2020E $2.58 $3.07 $0.50 1.091x 1.006x 2021E $2.97 $3.68 $0.71 1.180x 1.089x 2022E $3.42 $4.41 $0.99 1.090x 0.975x 39.8% 39.9% 34.6% 31.9% 2019E $0.89 $1.24 $0.35 1.125x 2020E $1.14 $1.60 $0.46 1.006x 2021E $1.42 $1.92 $0.49 1.089x 2022E $1.74 $2.30 $0.56 0.975x 33.8% 26.9% 21.1% 17.9% 2019E $1.04 $1.40 $0.35 2020E $1.27 $1.61 $0.34 2021E $1.72 $2.09 $0.36 2022E $1.90 $2.24 $0.34 10.0% 11.8% 17.2% 16.7% 2019E $2.44 $2.68 $0.24 2020E $2.77 $3.09 $0.33 2021E $3.42 $4.01 $0.59 2022E $3.68 $4.30 $0.61 10.0% 14.1% 18.8% 17.0% 2H 2018E $1.02 $0.95 $0.98 ($0.07) ($0.04) 2019E $2.44 $2.60 $2.68 $0.16 $0.24 2020E $2.97 $3.28 $3.39 $0.31 $0.42 2021E $3.54 $4.08 $4.21 $0.54 $0.66 1.9204x XR
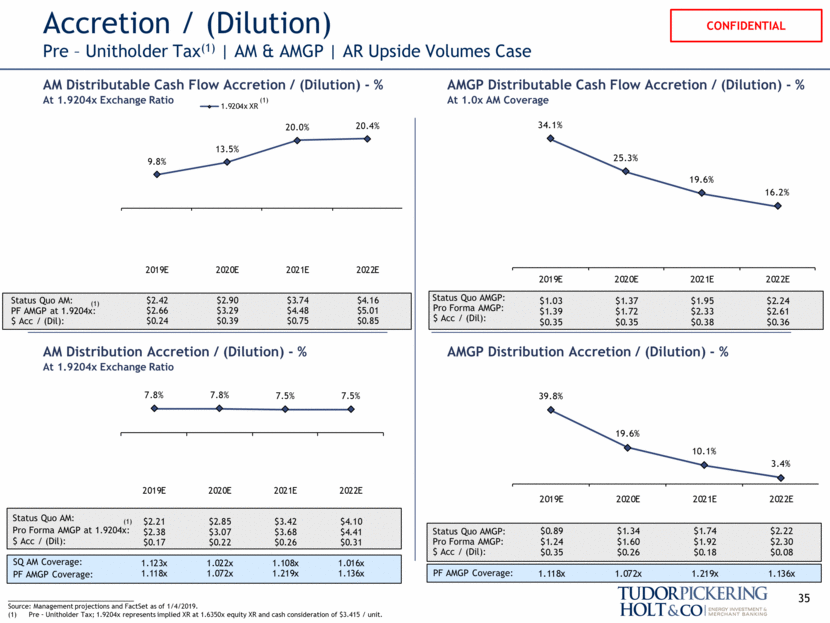
Status Quo AMGP: Pro Forma AMGP: $ Acc / (Dil): PF AMGP Coverage: AM Distributable Cash Flow Accretion / (Dilution) - % At 1.9204x Exchange Ratio Accretion / (Dilution) Pre – Unitholder Tax(1) AM & AMGP AR Upside Volumes Case AMGP Distributable Cash Flow Accretion / (Dilution) - % At 1.0x AM Coverage ___________________________________ Source: Management projections and FactSet as of 1/4/2019. Pre – Unitholder Tax; 1.9204x represents implied XR at 1.6350x equity XR and cash consideration of $3.415 / unit. Status Quo AMGP: Pro Forma AMGP: $ Acc / (Dil): 35 AM Distribution Accretion / (Dilution) - % At 1.9204x Exchange Ratio AMGP Distribution Accretion / (Dilution) - % PF AMGP Coverage: Status Quo AM: PF AMGP at 1.9204x: $ Acc / (Dil): (1) Status Quo AM: Pro Forma AMGP at 1.9204x: $ Acc / (Dil): (1) PF AMGP Coverage: SQ AM Coverage: (1) 9.8% 13.5% 20.0% 20.4% 2019E $2.42 $2.66 $0.24 2020E $2.90 $3.29 $0.39 2021E $3.74 $4.48 $0.75 2022E $4.16 $5.01 $0.85 7.8% 7.8% 7.5% 7.5% 2019E $2.21 $2.38 $0.17 1.123x 1.118x 2020E $2.85 $3.07 $0.22 1.022x 1.072x 2021E $3.42 $3.68 $0.26 1.108x 1.219x 2022E $4.10 $4.41 $0.31 1.016x 1.136x 39.8% 19.6% 10.1% 3.4% 2019E $0.89 $1.24 $0.35 1.118x 2020E $1.34 $1.60 $0.26 1.072x 2021E $1.74 $1.92 $0.18 1.219x 2022E $2.22 $2.30 $0.08 1.136x 34.1% 25.3% 19.6% 16.2% 2019E $1.03 $1.39 $0.35 2020E $1.37 $1.72 $0.35 2021E $1.95 $2.33 $0.38 2022E $2.24 $2.61 $0.36 10.0% 14.1% 18.8% 17.0% 2H 2018E $1.02 $0.95 $0.98 ($0.07) ($0.04) 2019E $2.44 $2.60 $2.68 $0.16 $0.24 2020E $2.97 $3.28 $3.39 $0.31 $0.42 2021E $3.54 $4.08 $4.21 $0.54 $0.66 1.9204x XR
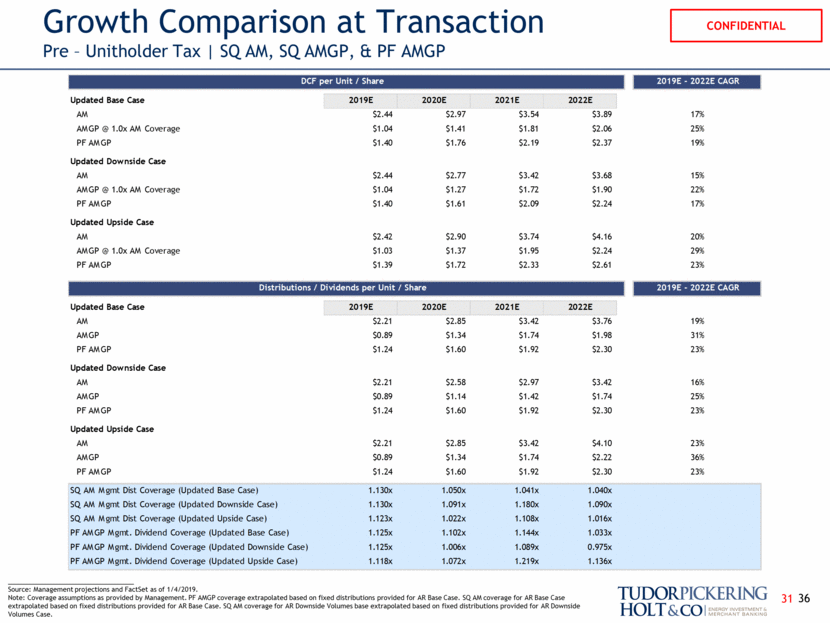
Growth Comparison at Transaction Pre – Unitholder Tax SQ AM, SQ AMGP, & PF AMGP ___________________________________ Source: Management projections and FactSet as of 1/4/2019. Note: Coverage assumptions as provided by Management. PF AMGP coverage extrapolated based on fixed distributions provided for AR Base Case. SQ AM coverage for AR Base Case extrapolated based on fixed distributions provided for AR Base Case. SQ AM coverage for AR Downside Volumes base extrapolated based on fixed distributions provided for AR Downside Volumes Case. 36 31 DCF per Unit / Share 2019E - 2022E CAGR Updated Base Case 2019E 2020E 2021E 2022E AM $2.44 $2.97 $3.54 $3.89 17% AMGP @ 1.0x AM Coverage $1.04 $1.41 $1.81 $2.06 25% PF AMGP $1.40 $1.76 $2.19 $2.37 19% Updated Downside Case AM $2.44 $2.77 $3.42 $3.68 15% AMGP @ 1.0x AM Coverage $1.04 $1.27 $1.72 $1.90 22% PF AMGP $1.40 $1.61 $2.09 $2.24 17% Updated Upside Case AM $2.42 $2.90 $3.74 $4.16 20% AMGP @ 1.0x AM Coverage $1.03 $1.37 $1.95 $2.24 29% PF AMGP $1.39 $1.72 $2.33 $2.61 23% Distributions / Dividends per Unit / Share 2019E - 2022E CAGR Updated Base Case 2019E 2020E 2021E 2022E AM $2.21 $2.85 $3.42 $3.76 19% AMGP $0.89 $1.34 $1.74 $1.98 31% PF AMGP $1.24 $1.60 $1.92 $2.30 23% Updated Downside Case AM $2.21 $2.58 $2.97 $3.42 16% AMGP $0.89 $1.14 $1.42 $1.74 25% PF AMGP $1.24 $1.60 $1.92 $2.30 23% Updated Upside Case AM $2.21 $2.85 $3.42 $4.10 23% AMGP $0.89 $1.34 $1.74 $2.22 36% PF AMGP $1.24 $1.60 $1.92 $2.30 23% SQ AM Mgmt Dist Coverage (Updated Base Case) 1.130x 1.050x 1.041x 1.040x SQ AM Mgmt Dist Coverage (Updated Downside Case) 1.130x 1.091x 1.180x 1.090x SQ AM Mgmt Dist Coverage (Updated Upside Case) 1.123x 1.022x 1.108x 1.016x PF AMGP Mgmt. Dividend Coverage (Updated Base Case) 1.125x 1.102x 1.144x 1.033x PF AMGP Mgmt. Dividend Coverage (Updated Downside Case) 1.125x 1.006x 1.089x 0.975x PF AMGP Mgmt. Dividend Coverage (Updated Upside Case) 1.118x 1.072x 1.219x 1.136x
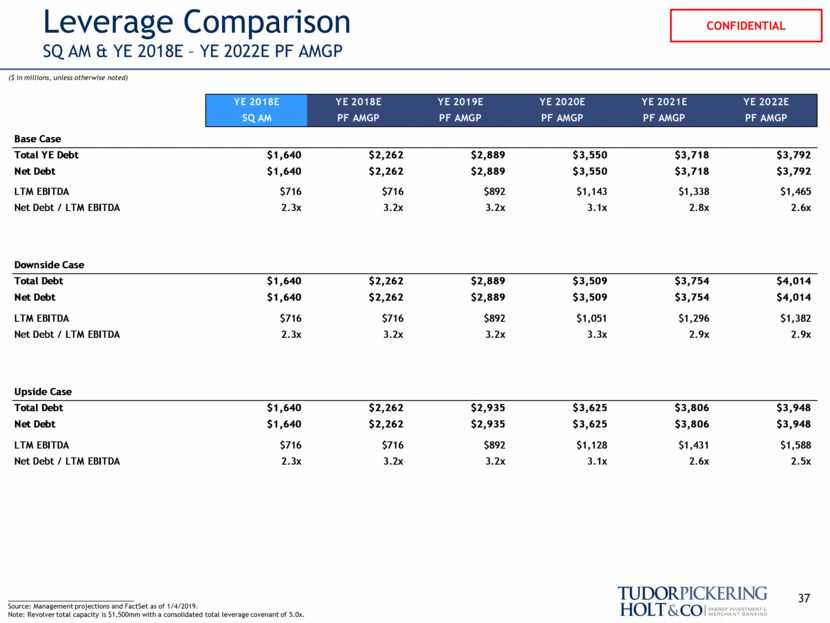
Leverage Comparison SQ AM & YE 2018E – YE 2022E PF AMGP ___________________________________ Source: Management projections and FactSet as of 1/4/2019. Note: Revolver total capacity is $1,500mm with a consolidated total leverage covenant of 5.0x. 37 ($ in millions, unless otherwise noted) YE 2018E YE 2018E YE 2019E YE 2020E YE 2021E YE 2022E SQ AM PF AMGP PF AMGP PF AMGP PF AMGP PF AMGP Base Case Total YE Debt $1,640 $2,262 $2,889 $3,550 $3,718 $3,792 Net Debt $1,640 $2,262 $2,889 $3,550 $3,718 $3,792 LTM EBITDA $716 $716 $892 $1,143 $1,338 $1,465 Net Debt / LTM EBITDA 2.3x 3.2x 3.2x 3.1x 2.8x 2.6x Downside Case Total Debt $1,640 $2,262 $2,889 $3,509 $3,754 $4,014 Net Debt $1,640 $2,262 $2,889 $3,509 $3,754 $4,014 LTM EBITDA $716 $716 $892 $1,051 $1,296 $1,382 Net Debt / LTM EBITDA 2.3x 3.2x 3.2x 3.3x 2.9x 2.9x Upside Case Total Debt $1,640 $2,262 $2,935 $3,625 $3,806 $3,948 Net Debt $1,640 $2,262 $2,935 $3,625 $3,806 $3,948 LTM EBITDA $716 $716 $892 $1,128 $1,431 $1,588 Net Debt / LTM EBITDA 2.3x 3.2x 3.2x 3.1x 2.6x 2.5x
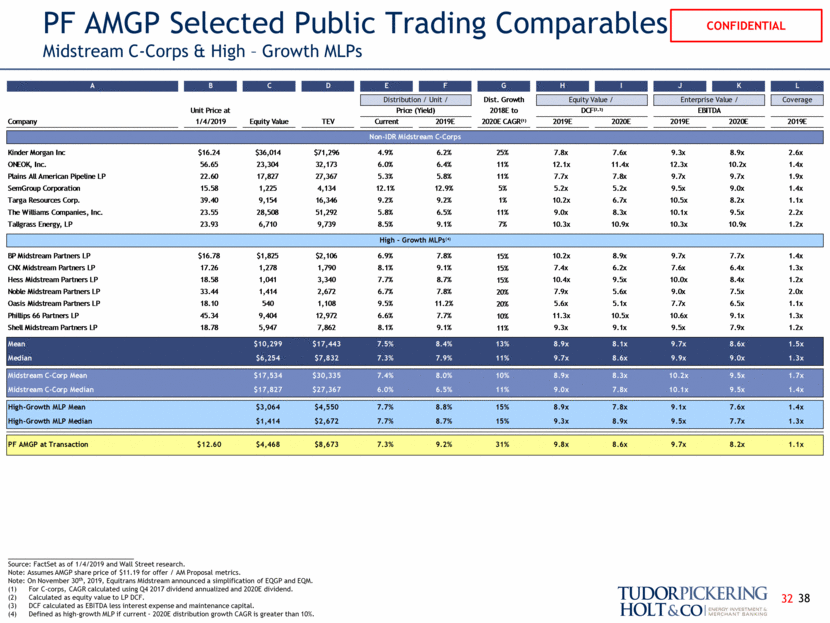
PF AMGP Selected Public Trading Comparables Midstream C-Corps & High – Growth MLPs ___________________________________ Source: FactSet as of 1/4/2019 and Wall Street research. Note: Assumes AMGP share price of $11.19 for offer / AM Proposal metrics. Note: On November 30th, 2019, Equitrans Midstream announced a simplification of EQGP and EQM. For C-corps, CAGR calculated using Q4 2017 dividend annualized and 2020E dividend. Calculated as equity value to LP DCF. DCF calculated as EBITDA less interest expense and maintenance capital. Defined as high-growth MLP if current – 2020E distribution growth CAGR is greater than 10%. 38 32 A B C D E F G H I J K L Distribution / Unit / Dist. Growth Equity Value / Enterprise Value / Coverage Unit Price at Price (Yield) 2018E to DCF (2,3) EBITDA Company 1/4/2019 Equity Value TEV Current 2019E 2020E CAGR (1) 2019E 2020E 2019E 2020E 2019E Non-IDR Midstream C-Corps Kinder Morgan Inc $16.24 $36,014 $71,296 4.9% 6.2% 25% 7.8x 7.6x 9.3x 8.9x 2.6x ONEOK, Inc. 56.65 23,304 32,173 6.0% 6.4% 11% 12.1x 11.4x 12.3x 10.2x 1.4x Plains All American Pipeline LP 22.60 17,827 27,367 5.3% 5.8% 11% 7.7x 7.8x 9.7x 9.7x 1.9x SemGroup Corporation 15.58 1,225 4,134 12.1% 12.9% 5% 5.2x 5.2x 9.5x 9.0x 1.4x Targa Resources Corp. 39.40 9,154 16,346 9.2% 9.2% 1% 10.2x 6.7x 10.5x 8.2x 1.1x The Williams Companies, Inc. 23.55 28,508 51,292 5.8% 6.5% 11% 9.0x 8.3x 10.1x 9.5x 2.2x Tallgrass Energy, LP 23.93 6,710 9,739 8.5% 9.1% 7% 10.3x 10.9x 10.3x 10.9x 1.2x High - Growth MLPs (4) BP Midstream Partners LP $16.78 $1,825 $2,106 6.9% 7.8% 15% 10.2x 8.9x 9.7x 7.7x 1.4x CNX Midstream Partners LP 17.26 1,278 1,790 8.1% 9.1% 15% 7.4x 6.2x 7.6x 6.4x 1.3x Hess Midstream Partners LP 18.58 1,041 3,340 7.7% 8.7% 15% 10.4x 9.5x 10.0x 8.4x 1.2x Noble Midstream Partners LP 33.44 1,414 2,672 6.7% 7.8% 20% 7.9x 5.6x 9.0x 7.5x 2.0x Oasis Midstream Partners LP 18.10 540 1,108 9.5% 11.2% 20% 5.6x 5.1x 7.7x 6.5x 1.1x Phillips 66 Partners LP 45.34 9,404 12,972 6.6% 7.7% 10% 11.3x 10.5x 10.6x 9.1x 1.3x Shell Midstream Partners LP 18.78 5,947 7,862 8.1% 9.1% 11% 9.3x 9.1x 9.5x 7.9x 1.2x Mean $10,299 $17,443 7.5% 8.4% 13% 8.9x 8.1x 9.7x 8.6x 1.5x Median $6,254 $7,832 7.3% 7.9% 11% 9.7x 8.6x 9.9x 9.0x 1.3x Midstream C-Corp Mean $17,534 $30,335 7.4% 8.0% 10% 8.9x 8.3x 10.2x 9.5x 1.7x Midstream C-Corp Median $17,827 $27,367 6.0% 6.5% 11% 9.0x 7.8x 10.1x 9.5x 1.4x High-Growth MLP Mean $3,064 $4,550 7.7% 8.8% 15% 8.9x 7.8x 9.1x 7.6x 1.4x High-Growth MLP Median $1,414 $2,672 7.7% 8.7% 15% 9.3x 8.9x 9.5x 7.7x 1.3x PF AMGP at Transaction $12.60 $4,468 $8,673 7.3% 9.2% 31% 9.8x 8.6x 9.7x 8.2x 1.1x
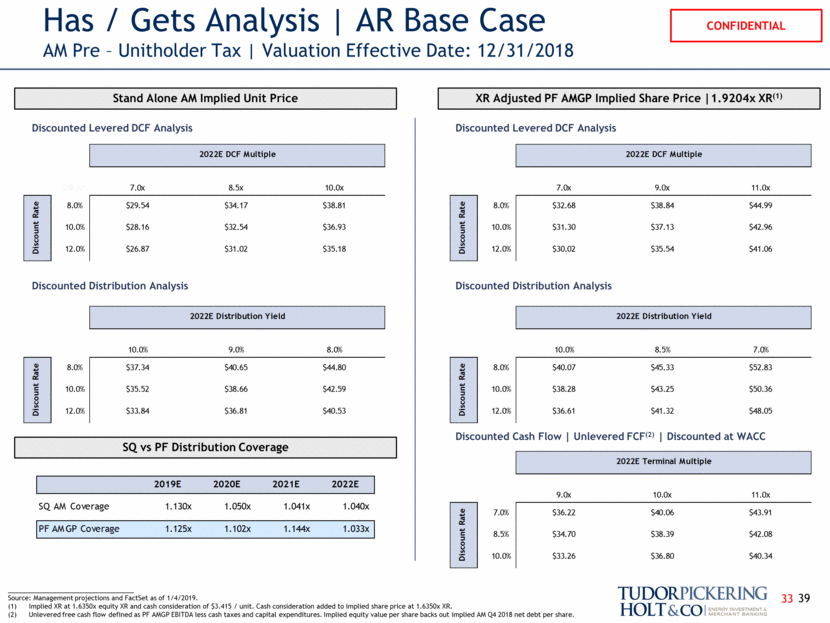
Has / Gets Analysis AR Base Case AM Pre – Unitholder Tax Valuation Effective Date: 12/31/2018 Stand Alone AM Implied Unit Price XR Adjusted PF AMGP Implied Share Price 1.9204x XR(1) ___________________________________ Source: Management projections and FactSet as of 1/4/2019. Implied XR at 1.6350x equity XR and cash consideration of $3.415 / unit. Cash consideration added to implied share price at 1.6350x XR. Unlevered free cash flow defined as PF AMGP EBITDA less cash taxes and capital expenditures. Implied equity value per share backs out implied AM Q4 2018 net debt per share. Discounted Levered DCF Analysis Discounted Distribution Analysis Discounted Levered DCF Analysis Discounted Distribution Analysis Discounted Cash Flow Unlevered FCF(2) Discounted at WACC 39 SQ vs PF Distribution Coverage 33 2022E DCF Multiple 2022E DCF Multiple $20.62 7.0x 8.5x 10.0x 8.0% $29.54 $34.17 $38.81 10.0% $28.16 $32.54 $36.93 12.0% $26.87 $31.02 $35.18 Discount Rate 2022E Distribution Yield 2022E Distribution Yield 10.0% 9.0% 8.0% 8.0% $37.34 $40.65 $44.80 10.0% $35.52 $38.66 $42.59 12.0% $33.84 $36.81 $40.53 Discount Rate 2022E DCF Multiple 2022E CAFD Multiple 7.0x 9.0x 11.0x 8.0% $32.68 $38.84 $44.99 10.0% $31.30 $37.13 $42.96 12.0% $30.02 $35.54 $41.06 Discount Rate 2022E Distribution Yield 2022E Distribution Yield 10.0% 8.5% 7.0% 8.0% $40.07 $45.33 $52.83 10.0% $38.28 $43.25 $50.36 12.0% $36.61 $41.32 $48.05 Discount Rate 2022E Terminal Multiple 9.0x 10.0x 11.0x 7.0% $36.22 $40.06 $43.91 8.5% $34.70 $38.39 $42.08 10.0% $33.26 $36.80 $40.34 Discount Rate 2019E 2020E 2021E 2022E SQ AM Coverage 1.130x 1.050x 1.041x 1.040x PF AMGP Coverage 1.125x 1.102x 1.144x 1.033x
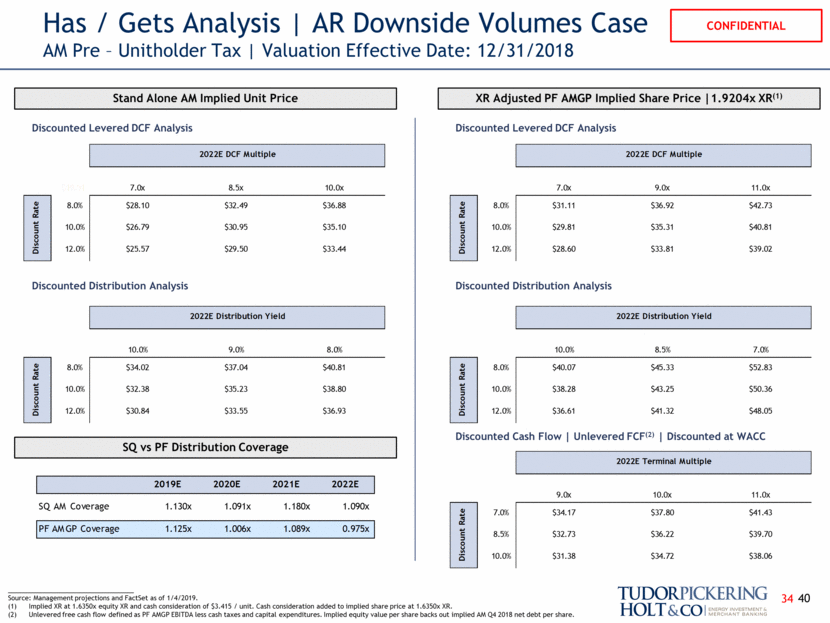
Has / Gets Analysis AR Downside Volumes Case AM Pre – Unitholder Tax Valuation Effective Date: 12/31/2018 Stand Alone AM Implied Unit Price XR Adjusted PF AMGP Implied Share Price 1.9204x XR(1) Discounted Levered DCF Analysis Discounted Distribution Analysis Discounted Levered DCF Analysis Discounted Distribution Analysis Discounted Cash Flow Unlevered FCF(2) Discounted at WACC 40 SQ vs PF Distribution Coverage ___________________________________ Source: Management projections and FactSet as of 1/4/2019. Implied XR at 1.6350x equity XR and cash consideration of $3.415 / unit. Cash consideration added to implied share price at 1.6350x XR. Unlevered free cash flow defined as PF AMGP EBITDA less cash taxes and capital expenditures. Implied equity value per share backs out implied AM Q4 2018 net debt per share. 34 2022E DCF Multiple 2022E DCF Multiple $19.51 7.0x 8.5x 10.0x 8.0% $28.10 $32.49 $36.88 10.0% $26.79 $30.95 $35.10 12.0% $25.57 $29.50 $33.44 Discount Rate 2022E Distribution Yield 2022E Distribution Yield 10.0% 9.0% 8.0% 8.0% $34.02 $37.04 $40.81 10.0% $32.38 $35.23 $38.80 12.0% $30.84 $33.55 $36.93 Discount Rate 2022E DCF Multiple 2022E CAFD Multiple 7.0x 9.0x 11.0x 8.0% $31.11 $36.92 $42.73 10.0% $29.81 $35.31 $40.81 12.0% $28.60 $33.81 $39.02 Discount Rate 2022E Distribution Yield 2022E Distribution Yield 10.0% 8.5% 7.0% 8.0% $40.07 $45.33 $52.83 10.0% $38.28 $43.25 $50.36 12.0% $36.61 $41.32 $48.05 Discount Rate 2022E Terminal Multiple 9.0x 10.0x 11.0x 7.0% $34.17 $37.80 $41.43 8.5% $32.73 $36.22 $39.70 10.0% $31.38 $34.72 $38.06 Discount Rate 2019E 2020E 2021E 2022E SQ AM Coverage 1.130x 1.091x 1.180x 1.090x PF AMGP Coverage 1.125x 1.006x 1.089x 0.975x
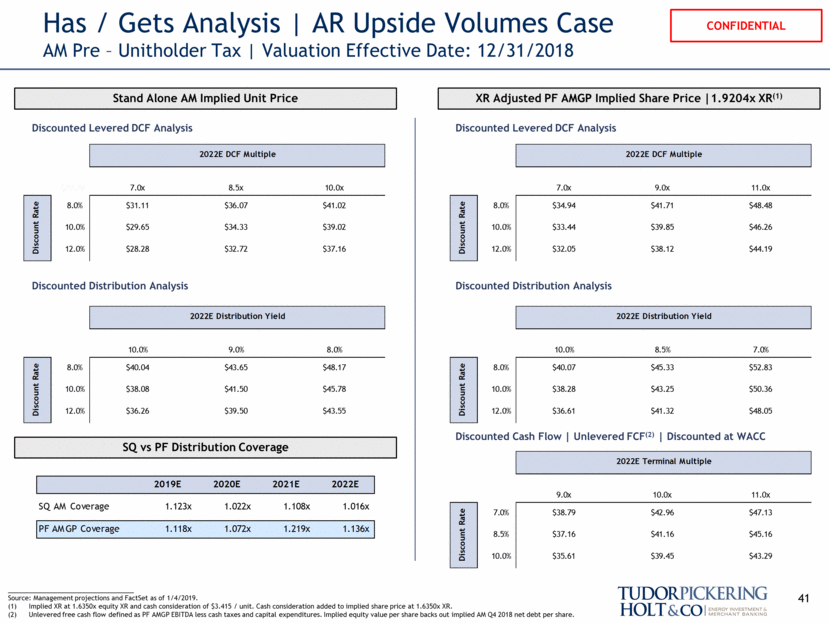
Has / Gets Analysis AR Upside Volumes Case AM Pre – Unitholder Tax Valuation Effective Date: 12/31/2018 Stand Alone AM Implied Unit Price XR Adjusted PF AMGP Implied Share Price 1.9204x XR(1) Discounted Levered DCF Analysis Discounted Distribution Analysis Discounted Levered DCF Analysis Discounted Distribution Analysis Discounted Cash Flow Unlevered FCF(2) Discounted at WACC 41 SQ vs PF Distribution Coverage ___________________________________ Source: Management projections and FactSet as of 1/4/2019. Implied XR at 1.6350x equity XR and cash consideration of $3.415 / unit. Cash consideration added to implied share price at 1.6350x XR. Unlevered free cash flow defined as PF AMGP EBITDA less cash taxes and capital expenditures. Implied equity value per share backs out implied AM Q4 2018 net debt per share. 2022E DCF Multiple 2022E DCF Multiple $22.29 7.0x 8.5x 10.0x 8.0% $31.11 $36.07 $41.02 10.0% $29.65 $34.33 $39.02 12.0% $28.28 $32.72 $37.16 Discount Rate 2022E Distribution Yield 2022E Distribution Yield 10.0% 9.0% 8.0% 8.0% $40.04 $43.65 $48.17 10.0% $38.08 $41.50 $45.78 12.0% $36.26 $39.50 $43.55 Discount Rate 2022E DCF Multiple 2022E CAFD Multiple 7.0x 9.0x 11.0x 8.0% $34.94 $41.71 $48.48 10.0% $33.44 $39.85 $46.26 12.0% $32.05 $38.12 $44.19 Discount Rate 2022E Distribution Yield 2022E Distribution Yield 10.0% 8.5% 7.0% 8.0% $40.07 $45.33 $52.83 10.0% $38.28 $43.25 $50.36 12.0% $36.61 $41.32 $48.05 Discount Rate 2022E Terminal Multiple 9.0x 10.0x 11.0x 7.0% $38.79 $42.96 $47.13 8.5% $37.16 $41.16 $45.16 10.0% $35.61 $39.45 $43.29 Discount Rate 2019E 2020E 2021E 2022E SQ AM Coverage 1.123x 1.022x 1.108x 1.016x PF AMGP Coverage 1.118x 1.072x 1.219x 1.136x
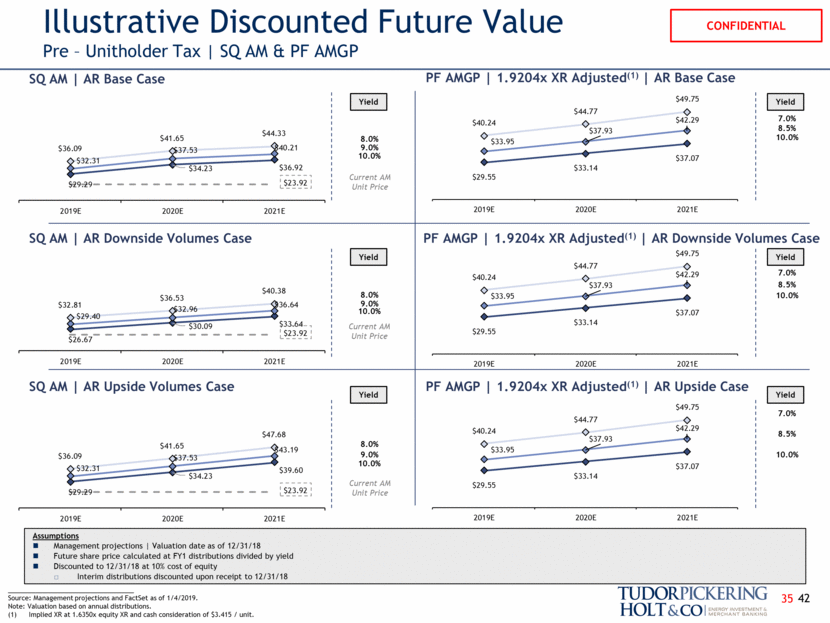
Illustrative Discounted Future Value Pre – Unitholder Tax SQ AM & PF AMGP ___________________________________ Source: Management projections and FactSet as of 1/4/2019. Note: Valuation based on annual distributions. Implied XR at 1.6350x equity XR and cash consideration of $3.415 / unit. SQ AM AR Upside Case Assumptions Management projections Valuation date as of 12/31/18 Future share price calculated at FY1 distributions divided by yield Discounted to 12/31/18 at 10% cost of equity Interim distributions discounted upon receipt to 12/31/18 PF AMGP 1.9204x XR Adjusted(1) AR Upside Case Yield SQ AM AR Downside Volumes Case PF AMGP 1.9204x XR Adjusted(1) AR Downside Volumes Case Yield Current AM Unit Price Yield Current AM Unit Price Yield 42 SQ AM AR Base Case PF AMGP 1.9204x XR Adjusted(1) AR Base Case 8.0% 9.0% 10.0% Yield Current AM Unit Price 7.0% 8.5% 10.0% Yield SQ AM AR Upside Volumes Case 8.0% 9.0% 10.0% 8.0% 9.0% 10.0% 7.0% 8.5% 10.0% 7.0% 8.5% 10.0% 35 $26.67 $30.09 $33.64 $29.40 $32.96 $36.64 $32.81 $36.53 $40.38 $23.92 2019E 2020E 2021E $29.55 $33.14 $37.07 $33.95 $37.93 $42.29 $40.24 $44.77 $49.75 2019E 2020E 2021E $29.29 $34.23 $36.92 $32.31 $37.53 $40.21 $36.09 $41.65 $44.33 $23.92 2019E 2020E 2021E $29.55 $33.14 $37.07 $33.95 $37.93 $42.29 $40.24 $44.77 $49.75 2019E 2020E 2021E $29.29 $34.23 $39.60 $32.31 $37.53 $43.19 $36.09 $41.65 $47.68 $23.92 2019E 2020E 2021E $29.55 $33.14 $37.07 $33.95 $37.93 $42.29 $40.24 $44.77 $49.75 2019E 2020E 2021E
VII. Supplemental Materials 43
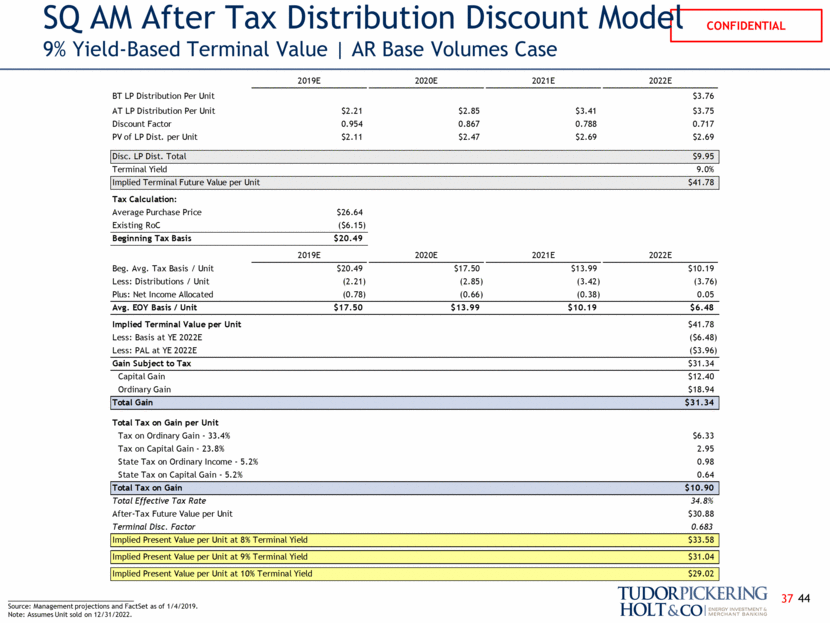
SQ AM After Tax Distribution Discount Model 9% Yield-Based Terminal Value AR Base Volumes Case 44 ___________________________________ Source: Management projections and FactSet as of 1/4/2019. Note: Assumes Unit sold on 12/31/2022. 37 2019E 2020E 2021E 2022E BT LP Distribution Per Unit $3.76 AT LP Distribution Per Unit $2.21 $2.85 $3.41 $3.75 Discount Factor 0.954 0.867 0.788 0.717 PV of LP Dist. per Unit $2.11 $2.47 $2.69 $2.69 Disc. LP Dist. Total $9.95 Terminal Yield 9.0% Implied Terminal Future Value per Unit $41.78 Tax Calculation: Average Purchase Price $26.64 Existing RoC ($6.15) Beginning Tax Basis $20.49 2019E 2020E 2021E 2022E Beg. Avg. Tax Basis / Unit $20.49 $17.50 $13.99 $10.19 Less: Distributions / Unit (2.21) (2.85) (3.42) (3.76) Plus: Net Income Allocated (0.78) (0.66) (0.38) 0.05 Avg. EOY Basis / Unit $17.50 $13.99 $10.19 $6.48 Implied Terminal Value per Unit $41.78 Less: Basis at YE 2022E ($6.48) Less: PAL at YE 2022E ($3.96) Gain Subject to Tax $31.34 Capital Gain $12.40 Ordinary Gain $18.94 Total Gain $31.34 Total Tax on Gain per Unit Tax on Ordinary Gain - 33.4% $6.33 Tax on Capital Gain - 23.8% 2.95 State Tax on Ordinary Income - 5.2% 0.98 State Tax on Capital Gain - 5.2% 0.64 Total Tax on Gain $10.90 Total Effective Tax Rate 34.8% After-Tax Future Value per Unit $30.88 Terminal Disc. Factor 0.683 Implied Present Value per Unit at 8% Terminal Yield $33.58 Implied Present Value per Unit at 9% Terminal Yield $31.04 Implied Present Value per Unit at 10% Terminal Yield $29.02
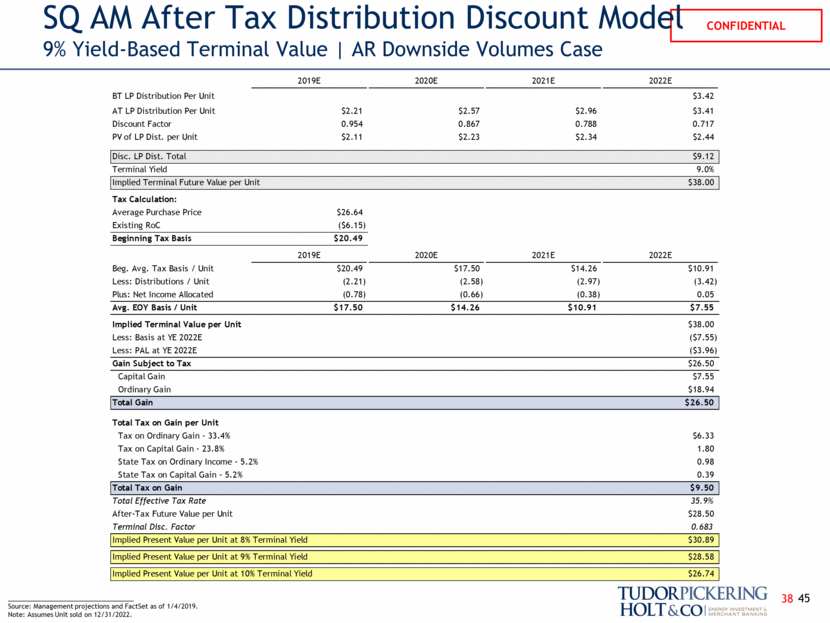
SQ AM After Tax Distribution Discount Model 9% Yield-Based Terminal Value AR Downside Volumes Case 45 ___________________________________ Source: Management projections and FactSet as of 1/4/2019. Note: Assumes Unit sold on 12/31/2022. 38 2019E 2020E 2021E 2022E BT LP Distribution Per Unit $3.42 AT LP Distribution Per Unit $2.21 $2.57 $2.96 $3.41 Discount Factor 0.954 0.867 0.788 0.717 PV of LP Dist. per Unit $2.11 $2.23 $2.34 $2.44 Disc. LP Dist. Total $9.12 Terminal Yield 9.0% Implied Terminal Future Value per Unit $38.00 Tax Calculation: Average Purchase Price $26.64 Existing RoC ($6.15) Beginning Tax Basis $20.49 2019E 2020E 2021E 2022E Beg. Avg. Tax Basis / Unit $20.49 $17.50 $14.26 $10.91 Less: Distributions / Unit (2.21) (2.58) (2.97) (3.42) Plus: Net Income Allocated (0.78) (0.66) (0.38) 0.05 Avg. EOY Basis / Unit $17.50 $14.26 $10.91 $7.55 Implied Terminal Value per Unit $38.00 Less: Basis at YE 2022E ($7.55) Less: PAL at YE 2022E ($3.96) Gain Subject to Tax $26.50 Capital Gain $7.55 Ordinary Gain $18.94 Total Gain $26.50 Total Tax on Gain per Unit Tax on Ordinary Gain - 33.4% $6.33 Tax on Capital Gain - 23.8% 1.80 State Tax on Ordinary Income - 5.2% 0.98 State Tax on Capital Gain - 5.2% 0.39 Total Tax on Gain $9.50 Total Effective Tax Rate 35.9% After-Tax Future Value per Unit $28.50 Terminal Disc. Factor 0.683 Implied Present Value per Unit at 8% Terminal Yield $30.89 Implied Present Value per Unit at 9% Terminal Yield $28.58 Implied Present Value per Unit at 10% Terminal Yield $26.74
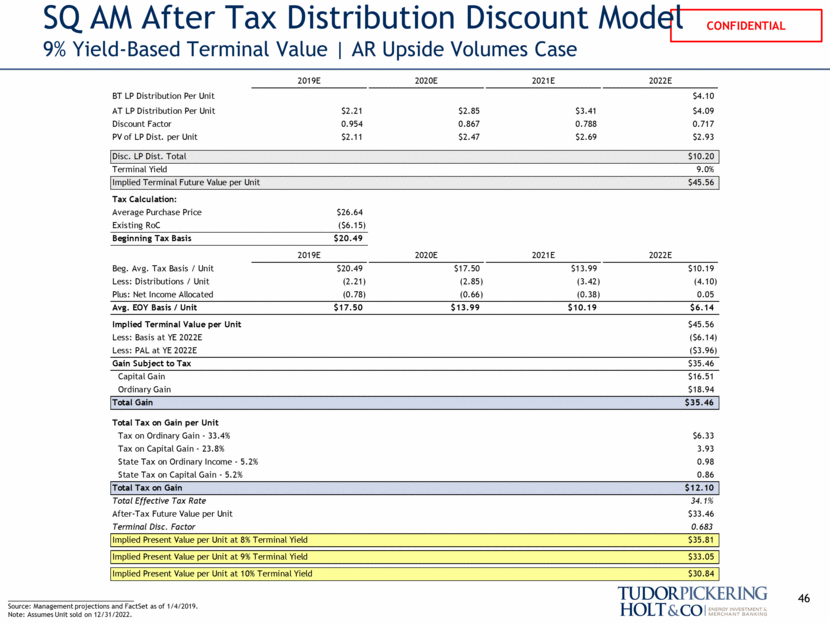
SQ AM After Tax Distribution Discount Model 9% Yield-Based Terminal Value AR Upside Volumes Case 46 ___________________________________ Source: Management projections and FactSet as of 1/4/2019. Note: Assumes Unit sold on 12/31/2022. 2019E 2020E 2021E 2022E BT LP Distribution Per Unit $4.10 AT LP Distribution Per Unit $2.21 $2.85 $3.41 $4.09 Discount Factor 0.954 0.867 0.788 0.717 PV of LP Dist. per Unit $2.11 $2.47 $2.69 $2.93 Disc. LP Dist. Total $10.20 Terminal Yield 9.0% Implied Terminal Future Value per Unit $45.56 Tax Calculation: Average Purchase Price $26.64 Existing RoC ($6.15) Beginning Tax Basis $20.49 2019E 2020E 2021E 2022E Beg. Avg. Tax Basis / Unit $20.49 $17.50 $13.99 $10.19 Less: Distributions / Unit (2.21) (2.85) (3.42) (4.10) Plus: Net Income Allocated (0.78) (0.66) (0.38) 0.05 Avg. EOY Basis / Unit $17.50 $13.99 $10.19 $6.14 Implied Terminal Value per Unit $45.56 Less: Basis at YE 2022E ($6.14) Less: PAL at YE 2022E ($3.96) Gain Subject to Tax $35.46 Capital Gain $16.51 Ordinary Gain $18.94 Total Gain $35.46 Total Tax on Gain per Unit Tax on Ordinary Gain - 33.4% $6.33 Tax on Capital Gain - 23.8% 3.93 State Tax on Ordinary Income - 5.2% 0.98 State Tax on Capital Gain - 5.2% 0.86 Total Tax on Gain $12.10 Total Effective Tax Rate 34.1% After-Tax Future Value per Unit $33.46 Terminal Disc. Factor 0.683 Implied Present Value per Unit at 8% Terminal Yield $35.81 Implied Present Value per Unit at 9% Terminal Yield $33.05 Implied Present Value per Unit at 10% Terminal Yield $30.84
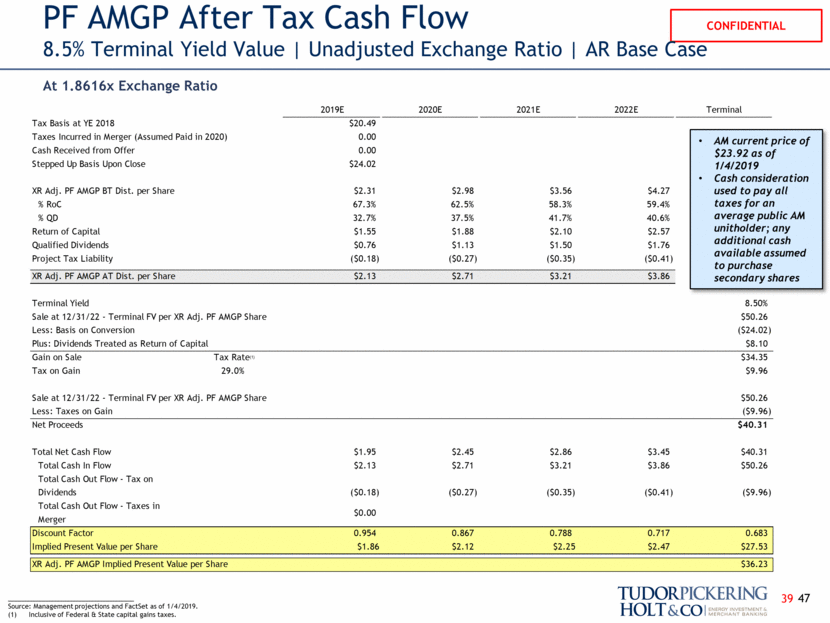
47 PF AMGP After Tax Cash Flow 8.5% Terminal Yield Value Unadjusted Exchange Ratio AR Base Case At 1.8616x Exchange Ratio ___________________________________ Source: Management projections and FactSet as of 1/4/2019. Inclusive of Federal & State capital gains taxes. AM current price of $23.92 as of 1/4/2019 Cash consideration used to pay all taxes for an average public AM unitholder; any additional cash available assumed to purchase secondary shares 39 2019E 2020E 2021E 2022E Terminal Tax Basis at YE 2018 $20.49 Taxes Incurred in Merger (Assumed Paid in 2020) 0.00 Cash Received from Offer 0.00 Stepped Up Basis Upon Close $24.02 XR Adj. PF AMGP BT Dist. per Share $2.31 $2.98 $3.56 $4.27 % RoC 67.3% 62.5% 58.3% 59.4% % QD 32.7% 37.5% 41.7% 40.6% Return of Capital $1.55 $1.88 $2.10 $2.57 Qualified Dividends $0.76 $1.13 $1.50 $1.76 Project Tax Liability ($0.18) ($0.27) ($0.35) ($0.41) XR Adj. PF AMGP AT Dist. per Share $2.13 $2.71 $3.21 $3.86 Terminal Yield 8.50% Sale at 12/31/22 - Terminal FV per XR Adj. PF AMGP Share $50.26 Less: Basis on Conversion ($24.02) Plus: Dividends Treated as Return of Capital $8.10 Gain on Sale Tax Rate (1) $34.35 Tax on Gain 29.0% $9.96 Sale at 12/31/22 - Terminal FV per XR Adj. PF AMGP Share $50.26 Less: Taxes on Gain ($9.96) Net Proceeds $40.31 Total Net Cash Flow $1.95 $2.45 $2.86 $3.45 $40.31 Total Cash In Flow $2.13 $2.71 $3.21 $3.86 $50.26 Total Cash Out Flow - Tax on Dividends ($0.18) ($0.27) ($0.35) ($0.41) ($9.96) Total Cash Out Flow - Taxes in Merger $0.00 Discount Factor 0.954 0.867 0.788 0.717 0.683 Implied Present Value per Share $1.86 $2.12 $2.25 $2.47 $27.53 XR Adj. PF AMGP Implied Present Value per Share $36.23
48 PF AMGP After Tax Cash Flow 8.5% Terminal Yield Value Unadjusted Exchange Ratio Downside Case At 1.8616x Exchange Ratio ___________________________________ Source: Management projections and FactSet as of 1/4/2019. Inclusive of Federal & State capital gains taxes. AM current price of $23.92 as of 1/4/2019 Cash consideration used to pay all taxes for an average public AM unitholder; any additional cash available assumed to purchase secondary shares 40 2019E 2020E 2021E 2022E Terminal Tax Basis at YE 2018 $20.49 Taxes Incurred in Merger (Assumed Paid in 2020) 0.00 Cash Received from Offer 0.00 Stepped Up Basis Upon Close $24.02 XR Adj. PF AMGP BT Dist. per Share $2.31 $2.98 $3.56 $4.27 % RoC 67.5% 72.9% 61.3% 59.3% % QD 32.5% 27.1% 38.7% 40.7% Return of Capital $1.56 $2.20 $2.21 $2.56 Qualified Dividends $0.75 $0.82 $1.40 $1.76 Project Tax Liability ($0.18) ($0.19) ($0.33) ($0.41) XR Adj. PF AMGP AT Dist. per Share $2.13 $2.79 $3.24 $3.86 Terminal Yield 8.50% Sale at 12/31/22 - Terminal FV per XR Adj. PF AMGP Share $50.26 Less: Basis on Conversion ($24.02) Plus: Dividends Treated as Return of Capital $8.53 Gain on Sale Tax Rate (1) $34.77 Tax on Gain 29.0% $10.08 Sale at 12/31/22 - Terminal FV per XR Adj. PF AMGP Share $50.26 Less: Taxes on Gain ($10.08) Net Proceeds $40.18 Total Net Cash Flow $1.95 $2.59 $2.91 $3.44 $40.18 Total Cash In Flow $2.13 $2.79 $3.24 $3.86 $50.26 Total Cash Out Flow - Tax on Dividends ($0.18) ($0.19) ($0.33) ($0.41) ($10.08) Total Cash Out Flow - Taxes in Merger $0.00 Discount Factor 0.954 0.867 0.788 0.717 0.683 Implied Present Value per Share $1.86 $2.25 $2.29 $2.47 $27.44 XR Adj. PF AMGP Implied Present Value per Share $36.32

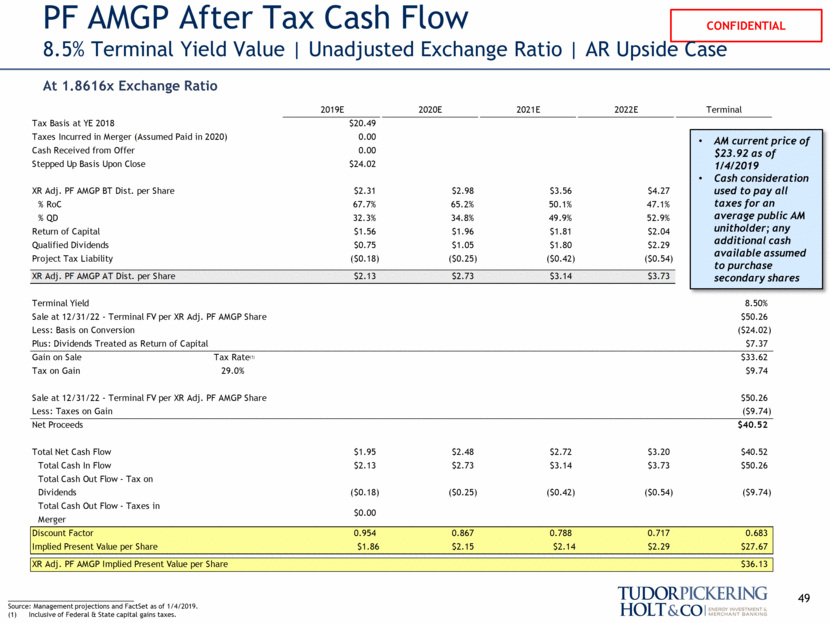
49 PF AMGP After Tax Cash Flow 8.5% Terminal Yield Value Unadjusted Exchange Ratio AR Upside Case At 1.8616x Exchange Ratio ___________________________________ Source: Management projections and FactSet as of 1/4/2019. Inclusive of Federal & State capital gains taxes. AM current price of $23.92 as of 1/4/2019 Cash consideration used to pay all taxes for an average public AM unitholder; any additional cash available assumed to purchase secondary shares 2019E 2020E 2021E 2022E Terminal Tax Basis at YE 2018 $20.49 Taxes Incurred in Merger (Assumed Paid in 2020) 0.00 Cash Received from Offer 0.00 Stepped Up Basis Upon Close $24.02 XR Adj. PF AMGP BT Dist. per Share $2.31 $2.98 $3.56 $4.27 % RoC 67.7% 65.2% 50.1% 47.1% % QD 32.3% 34.8% 49.9% 52.9% Return of Capital $1.56 $1.96 $1.81 $2.04 Qualified Dividends $0.75 $1.05 $1.80 $2.29 Project Tax Liability ($0.18) ($0.25) ($0.42) ($0.54) XR Adj. PF AMGP AT Dist. per Share $2.13 $2.73 $3.14 $3.73 Terminal Yield 8.50% Sale at 12/31/22 - Terminal FV per XR Adj. PF AMGP Share $50.26 Less: Basis on Conversion ($24.02) Plus: Dividends Treated as Return of Capital $7.37 Gain on Sale Tax Rate (1) $33.62 Tax on Gain 29.0% $9.74 Sale at 12/31/22 - Terminal FV per XR Adj. PF AMGP Share $50.26 Less: Taxes on Gain ($9.74) Net Proceeds $40.52 Total Net Cash Flow $1.95 $2.48 $2.72 $3.20 $40.52 Total Cash In Flow $2.13 $2.73 $3.14 $3.73 $50.26 Total Cash Out Flow - Tax on Dividends ($0.18) ($0.25) ($0.42) ($0.54) ($9.74) Total Cash Out Flow - Taxes in Merger $0.00 Discount Factor 0.954 0.867 0.788 0.717 0.683 Implied Present Value per Share $1.86 $2.15 $2.14 $2.29 $27.67 XR Adj. PF AMGP Implied Present Value per Share $36.13
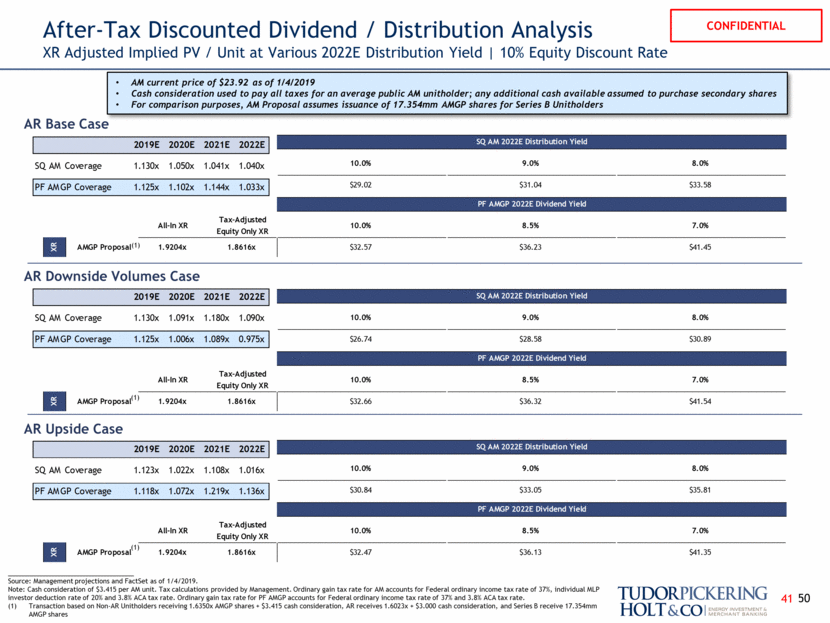
After-Tax Discounted Dividend / Distribution Analysis XR Adjusted Implied PV / Unit at Various 2022E Distribution Yield 10% Equity Discount Rate 50 AR Base Case AR Downside Volumes Case ___________________________________ Source: Management projections and FactSet as of 1/4/2019. Note: Cash consideration of $3.415 per AM unit. Tax calculations provided by Management. Ordinary gain tax rate for AM accounts for Federal ordinary income tax rate of 37%, individual MLP investor deduction rate of 20% and 3.8% ACA tax rate. Ordinary gain tax rate for PF AMGP accounts for Federal ordinary income tax rate of 37% and 3.8% ACA tax rate. Transaction based on Non-AR Unitholders receiving 1.6350x AMGP shares + $3.415 cash consideration, AR receives 1.6023x + $3.000 cash consideration, and Series B receive 17.354mm AMGP shares AM current price of $23.92 as of 1/4/2019 Cash consideration used to pay all taxes for an average public AM unitholder; any additional cash available assumed to purchase secondary shares For comparison purposes, AM Proposal assumes issuance of 17.354mm AMGP shares for Series B Unitholders (1) (1) AR Upside Case 41 (1) SQ AM 2022E Distribution Yield 10.0% 9.0% 8.0% $26.74 $28.58 $30.89 PF AMGP 2022E Dividend Yield All-In XR Tax-Adjusted Equity Only XR 10.0% 8.5% 7.0% XR AMGP Proposal 1.9204x 1.8616x $32.66 $36.32 $41.54 SQ AM 2022E Distribution Yield 10.0% 9.0% 8.0% $29.02 $31.04 $33.58 PF AMGP 2022E Dividend Yield All-In XR Tax-Adjusted Equity Only XR 10.0% 8.5% 7.0% XR AMGP Proposal 1.9204x 1.8616x $32.57 $36.23 $41.45 2019E 2020E 2021E 2022E SQ AM Coverage 1.130x 1.091x 1.180x 1.090x PF AMGP Coverage 1.125x 1.006x 1.089x 0.975x 2019E 2020E 2021E 2022E SQ AM Coverage 1.130x 1.050x 1.041x 1.040x PF AMGP Coverage 1.125x 1.102x 1.144x 1.033x SQ AM 2022E Distribution Yield 10.0% 9.0% 8.0% $30.84 $33.05 $35.81 PF AMGP 2022E Dividend Yield All-In XR Tax-Adjusted Equity Only XR 10.0% 8.5% 7.0% XR AMGP Proposal 1.9204x 1.8616x $32.47 $36.13 $41.35 2019E 2020E 2021E 2022E SQ AM Coverage 1.123x 1.022x 1.108x 1.016x PF AMGP Coverage 1.118x 1.072x 1.219x 1.136x
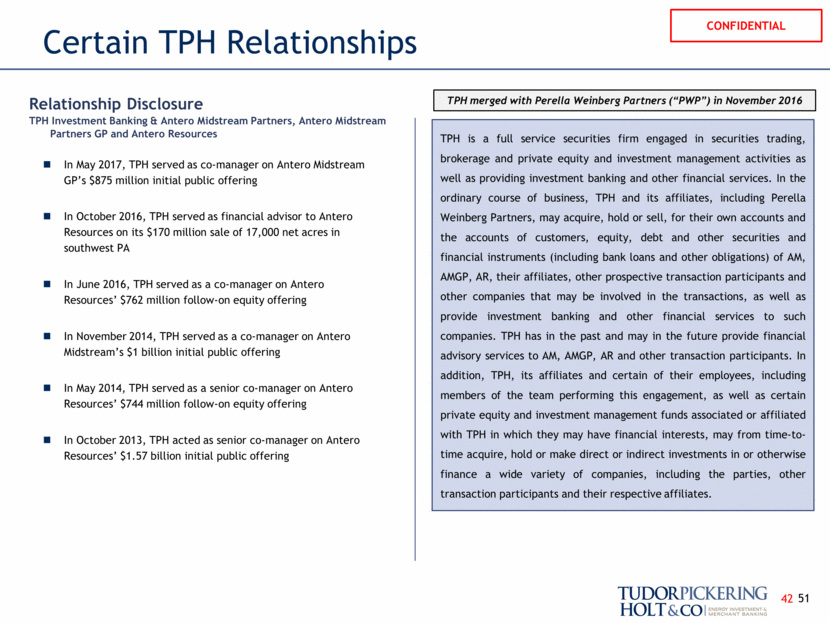
Certain TPH Relationships In May 2017, TPH served as co-manager on Antero Midstream GP’s $875 million initial public offering In October 2016, TPH served as financial advisor to Antero Resources on its $170 million sale of 17,000 net acres in southwest PA In June 2016, TPH served as a co-manager on Antero Resources’ $762 million follow-on equity offering In November 2014, TPH served as a co-manager on Antero Midstream’s $1 billion initial public offering In May 2014, TPH served as a senior co-manager on Antero Resources’ $744 million follow-on equity offering In October 2013, TPH acted as senior co-manager on Antero Resources’ $1.57 billion initial public offering TPH is a full service securities firm engaged in securities trading, brokerage and private equity and investment management activities as well as providing investment banking and other financial services. In the ordinary course of business, TPH and its affiliates, including Perella Weinberg Partners, may acquire, hold or sell, for their own accounts and the accounts of customers, equity, debt and other securities and financial instruments (including bank loans and other obligations) of AM, AMGP, AR, their affiliates, other prospective transaction participants and other companies that may be involved in the transactions, as well as provide investment banking and other financial services to such companies. TPH has in the past and may in the future provide financial advisory services to AM, AMGP, AR and other transaction participants. In addition, TPH, its affiliates and certain of their employees, including members of the team performing this engagement, as well as certain private equity and investment management funds associated or affiliated with TPH in which they may have financial interests, may from time-to-time acquire, hold or make direct or indirect investments in or otherwise finance a wide variety of companies, including the parties, other transaction participants and their respective affiliates. TPH merged with Perella Weinberg Partners (“PWP”) in November 2016 Relationship Disclosure TPH Investment Banking & Antero Midstream Partners, Antero Midstream Partners GP and Antero Resources 51 42
Appendix 52
Financial Projections 53
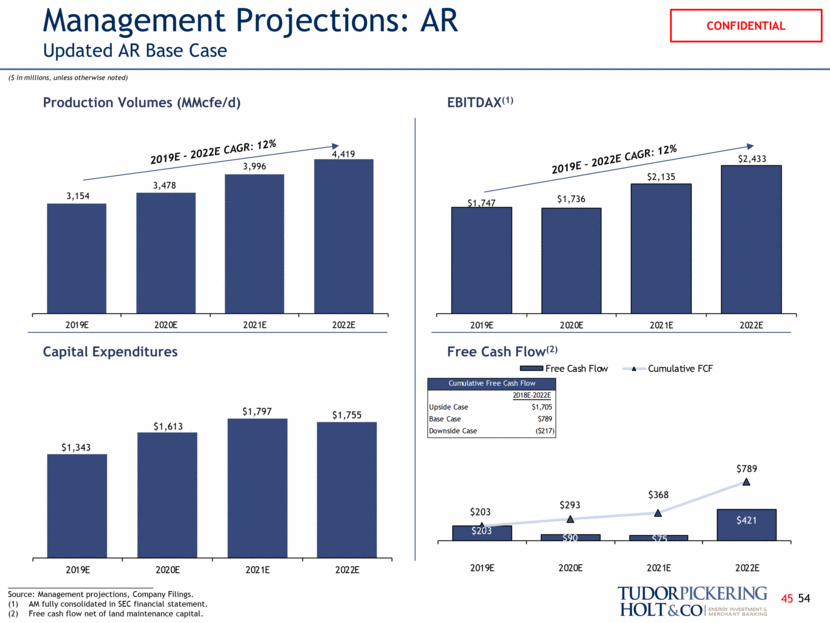
Management Projections: AR Updated AR Base Case Production Volumes (MMcfe/d) EBITDAX(1) Capital Expenditures Free Cash Flow(2) 2019E - 2022E CAGR: 12% 2019E – 2022E CAGR: 12% ___________________________________ Source: Management projections, Company Filings. AM fully consolidated in SEC financial statement. Free cash flow net of land maintenance capital. ($ in millions, unless otherwise noted) 54 45 $1,343 $1,613 $1,797 $1,755 2019E 2020E 2021E 2022E $1,747 $1,736 $2,135 $2,433 2019E 2020E 2021E 2022E 3,154 3,478 3,996 4,419 2019E 2020E 2021E 2022E $203 $90 $75 $421 $203 $293 $368 $789 2019E 2020E 2021E 2022E Free Cash Flow Cumulative FCF Cumulative Free Cash Flow 2018E-2022E Upside Case $1,705 Base Case $789 Downside Case ($217)
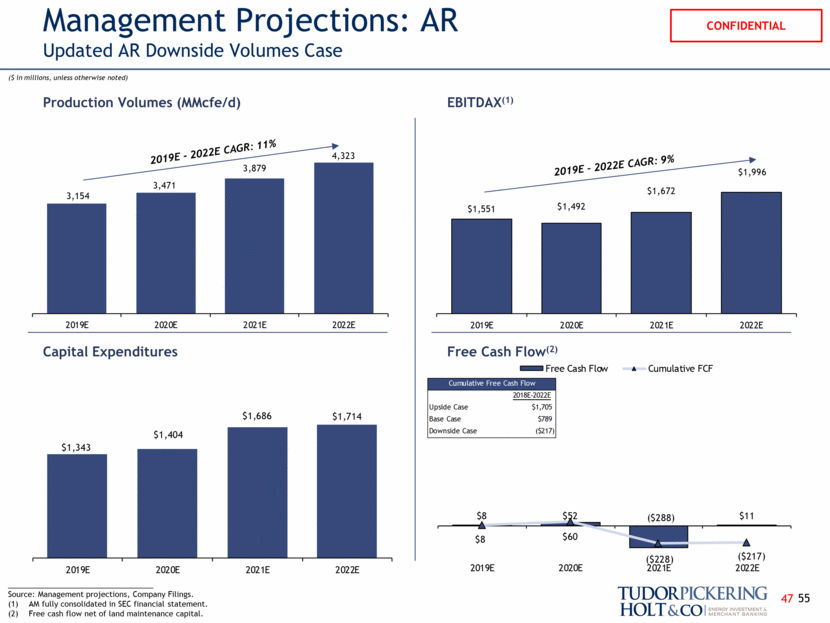
Management Projections: AR Updated AR Downside Volumes Case Production Volumes (MMcfe/d) EBITDAX(1) Capital Expenditures Free Cash Flow(2) 2019E - 2022E CAGR: 11% 2019E – 2022E CAGR: 9% ___________________________________ Source: Management projections, Company Filings. AM fully consolidated in SEC financial statement. Free cash flow net of land maintenance capital. ($ in millions, unless otherwise noted) 55 47 $1,343 $1,404 $1,686 $1,714 2019E 2020E 2021E 2022E $1,551 $1,492 $1,672 $1,996 2019E 2020E 2021E 2022E 3,154 3,471 3,879 4,323 2019E 2020E 2021E 2022E $8 $52 ($288) $11 $8 $60 ($228) ($217) 2019E 2020E 2021E 2022E Free Cash Flow Cumulative FCF Cumulative Free Cash Flow 2018E-2022E Upside Case $1,705 Base Case $789 Downside Case ($217)
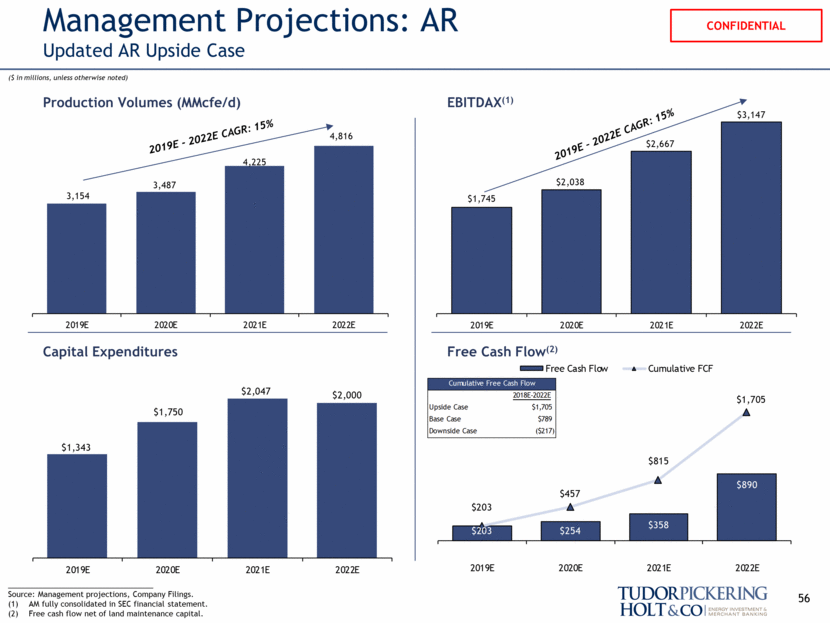
Management Projections: AR Updated AR Upside Case Production Volumes (MMcfe/d) EBITDAX(1) Capital Expenditures Free Cash Flow(2) 2019E - 2022E CAGR: 15% 2019E – 2022E CAGR: 15% ___________________________________ Source: Management projections, Company Filings. AM fully consolidated in SEC financial statement. Free cash flow net of land maintenance capital. ($ in millions, unless otherwise noted) 56 $1,343 $1,750 $2,047 $2,000 2019E 2020E 2021E 2022E $1,745 $2,038 $2,667 $3,147 2019E 2020E 2021E 2022E 3,154 3,487 4,225 4,816 2019E 2020E 2021E 2022E $203 $254 $358 $890 $203 $457 $815 $1,705 2019E 2020E 2021E 2022E Free Cash Flow Cumulative FCF Cumulative Free Cash Flow 2018E-2022E Upside Case $1,705 Base Case $789 Downside Case ($217)
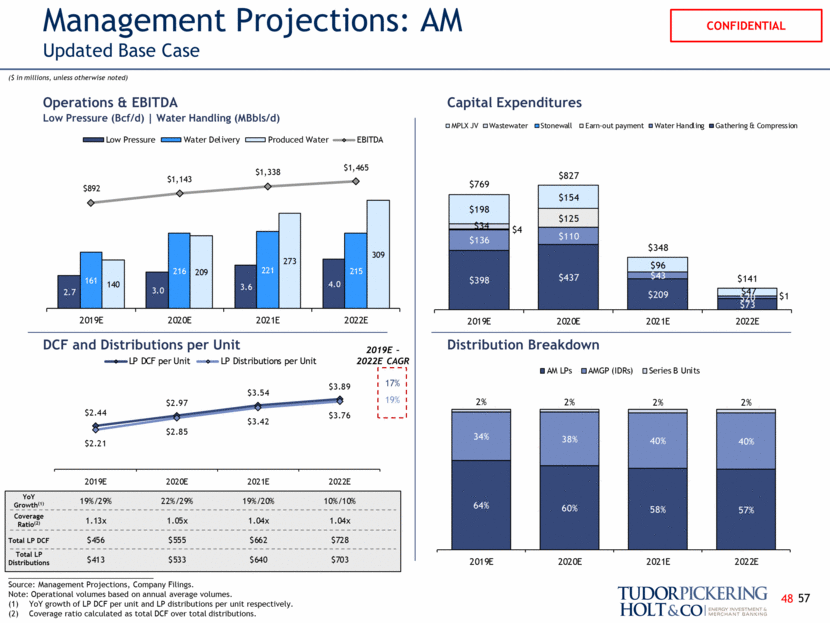
17% Management Projections: AM Updated Base Case Operations & EBITDA Low Pressure (Bcf/d) Water Handling (MBbls/d) Capital Expenditures DCF and Distributions per Unit Distribution Breakdown 2019E – 2022E CAGR ___________________________________ Source: Management Projections, Company Filings. Note: Operational volumes based on annual average volumes. YoY growth of LP DCF per unit and LP distributions per unit respectively. Coverage ratio calculated as total DCF over total distributions. Coverage Ratio(2) ($ in millions, unless otherwise noted) 19% Total LP DCF Total LP Distributions YoY Growth(1) 57 48 $398 $437 $209 $73 $136 $110 $43 $20 $125 $4 $34 $1 $198 $154 $96 $47 $769 $827 $348 $141 2019E 2020E 2021E 2022E 64% 60% 58% 57% 34% 38% 40% 40% 2% 2% 2% 2% 2019E 2020E 2021E 2022E $447 $445 $309 $274 $132 $113 $45 $22 $125 $34 $1 $198 $154 $96 $47 $815 $838 $450 $344 2019A 2020A 2021E 2022E MPLX JV Wastewater Stonewall Earn-out payment Water Handling Gathering & Compression 92% 78% 68% 63% 59% 57% 55% 8% 22% 30% 36% 39% 41% 42% - % 1% 1% 2% 2% 2% 2% 2016A 2017A 2018E 2019E 2020E 2021E 2022E AM LPs AMGP (IDRs) Series B Units $1.49 $1.61 $2.07 $2.76 $3.24 $3.75 $4.29 $1.03 $1.33 $1.72 $2.21 $2.85 $3.42 $4.10 2016A 2017A 2018E 2019E 2020E 2021E 2022E LP DCF per Unit LP Distributions per Unit $2.44 $2.97 $3.54 $3.89 $2.21 $2.85 $3.42 $3.76 2019E 19%/29% 1.13x $456 $413 2020E 22%/29% 1.05x $555 $533 2021E 19%/20% 1.04x $662 $640 2022E 10%/10% 1.04x $728 $703 161 216 221 215 140 209 273 309 2.7 3.0 3.6 4.0 $892 $1,143 $1,338 $1,465 2019E 2020E 2021E 2022E 1.4 1.7 2.2 2.8 3.5 4.1 4.7 3.5 4.4 5.1 5.9 6.3 6.9 7.4 0.8 1.1 1.2 1.5 2.1 2.7 3.1 4 4 5 6 6 7 7 $404 $529 $730 $989 $1,222 $1,413 $1,642 2016A 2017A 2018E 2019E 2020E 2021E 2022E Low Pressure Water Delivery Produced Water EBITDA
15% Management Projections: AM Updated Downside Case Operations & EBITDA Low Pressure (Bcf/d) Water Handling (MBbls/d) Capital Expenditures DCF and Distributions per Unit Distribution Breakdown 2019E – 2022E CAGR ___________________________________ Source: Management Projections, Company Filings. Note: Operational volumes based on annual average volumes. YoY growth of LP DCF per unit and LP distributions per unit respectively. Coverage ratio calculated as total DCF over total distributions. Coverage Ratio(2) ($ in millions, unless otherwise noted) 16% Total LP DCF Total LP Distributions YoY Growth(1) 58 49 $398 $319 $272 $147 $136 $131 $59 $19 $125 $4 $34 $1 $198 $119 $50 $95 $769 $695 $382 $262 2019E 2020E 2021E 2022E 64% 60% 58% 57% 34% 38% 40% 40% 2% 2% 2% 2% 2019E 2020E 2021E 2022E $447 $445 $309 $274 $132 $113 $45 $22 $125 $34 $1 $198 $154 $96 $47 $815 $838 $450 $344 2019A 2020A 2021E 2022E MPLX JV Wastewater Stonewall Earn-out payment Water Handling Gathering & Compression 92% 78% 68% 63% 59% 57% 55% 8% 22% 30% 36% 39% 41% 42% - % 1% 1% 2% 2% 2% 2% 2016A 2017A 2018E 2019E 2020E 2021E 2022E AM LPs AMGP (IDRs) Series B Units $1.49 $1.61 $2.07 $2.76 $3.24 $3.75 $4.29 $1.03 $1.33 $1.72 $2.21 $2.85 $3.42 $4.10 2016A 2017A 2018E 2019E 2020E 2021E 2022E LP DCF per Unit LP Distributions per Unit $2.44 $2.77 $3.42 $3.68 $2.21 $2.58 $2.97 $3.42 2019E 19%/29% 1.13x $456 $413 2020E 14%/17% 1.09x $517 $482 2021E 24%/15% 1.18x $640 $556 2022E 8%/15% 1.09x $689 $640 161 159 229 216 140 200 259 293 2.7 3.0 3.4 3.8 $892 $1,051 $1,296 $1,382 2019E 2020E 2021E 2022E 1.4 1.7 2.2 2.8 3.5 4.1 4.7 3.5 4.4 5.1 5.9 6.3 6.9 7.4 0.8 1.1 1.2 1.5 2.1 2.7 3.1 4 4 5 6 6 7 7 $404 $529 $730 $989 $1,222 $1,413 $1,642 2016A 2017A 2018E 2019E 2020E 2021E 2022E Low Pressure Water Delivery Produced Water EBITDA
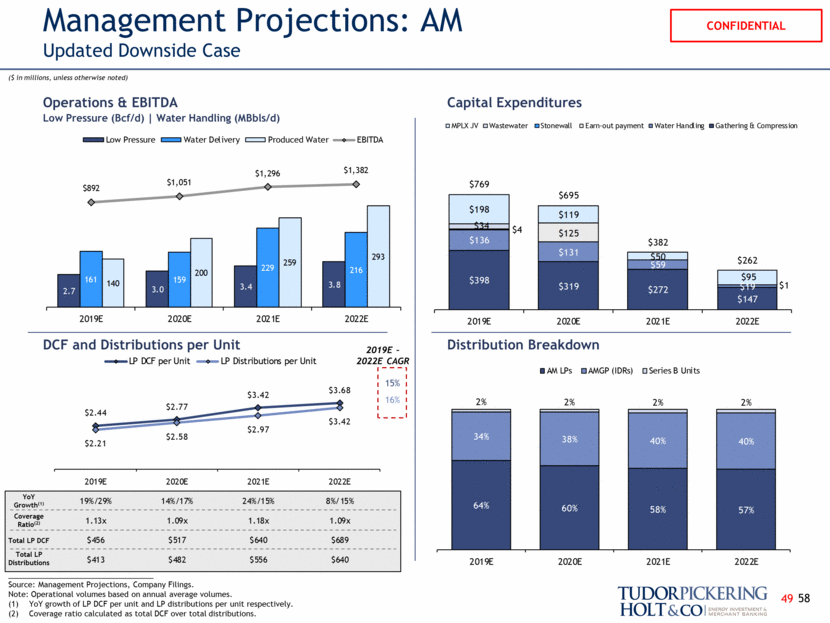
20% Management Projections: AM Updated Upside Case Operations & EBITDA Low Pressure (Bcf/d) Water Handling (MBbls/d) Capital Expenditures DCF and Distributions per Unit Distribution Breakdown 2019E – 2022E CAGR ___________________________________ Source: Management Projections, Company Filings. Note: Operational volumes based on annual average volumes. YoY growth of LP DCF per unit and LP distributions per unit respectively. Coverage ratio calculated as total DCF over total distributions. Coverage Ratio(2) ($ in millions, unless otherwise noted) 23% Total LP DCF Total LP Distributions YoY Growth(1) 59 $447 $445 $309 $274 $132 $113 $45 $22 $125 $4 $34 $1 $198 $154 $96 $47 $815 $838 $450 $344 2019E 2020E 2021E 2022E 64% 60% 58% 57% 34% 38% 40% 41% 2% 2% 2% 2% 2019E 2020E 2021E 2022E $447 $445 $309 $274 $132 $113 $45 $22 $125 $34 $1 $198 $154 $96 $47 $815 $838 $450 $344 2019A 2020A 2021E 2022E MPLX JV Wastewater Stonewall Earn-out payment Water Handling Gathering & Compression 92% 78% 68% 63% 59% 57% 55% 8% 22% 30% 36% 39% 41% 42% - % 1% 1% 2% 2% 2% 2% 2016A 2017A 2018E 2019E 2020E 2021E 2022E AM LPs AMGP (IDRs) Series B Units $1.49 $1.61 $2.07 $2.76 $3.24 $3.75 $4.29 $1.03 $1.33 $1.72 $2.21 $2.85 $3.42 $4.10 2016A 2017A 2018E 2019E 2020E 2021E 2022E LP DCF per Unit LP Distributions per Unit $2.42 $2.90 $3.74 $4.16 $2.21 $2.85 $3.42 $4.10 2019E 18%/29% 1.12x $453 $413 2020E 20%/29% 1.02x $543 $533 2021E 29%/20% 1.11x $699 $640 2022E 11%/20% 1.02x $778 $767 161 205 262 254 140 207 283 331 2.7 3.0 3.7 4.3 $892 $1,128 $1,431 $1,588 2019E 2020E 2021E 2022E 1.4 1.7 2.2 2.8 3.5 4.1 4.7 3.5 4.4 5.1 5.9 6.3 6.9 7.4 0.8 1.1 1.2 1.5 2.1 2.7 3.1 4 4 5 6 6 7 7 $404 $529 $730 $989 $1,222 $1,413 $1,642 2016A 2017A 2018E 2019E 2020E 2021E 2022E Low Pressure Water Delivery Produced Water EBITDA
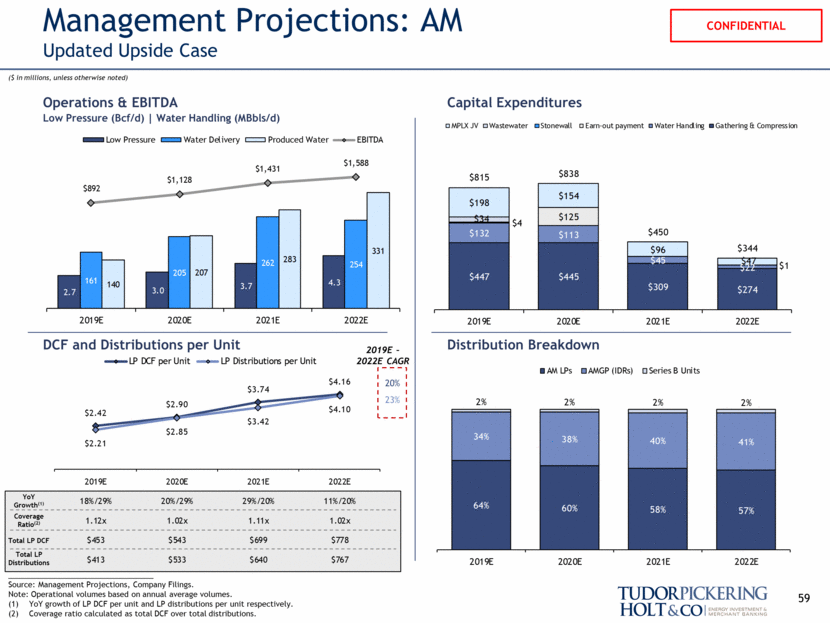
AMGP & Series B Unit Valuation(1,2,5) Management Projections: AMGP Updated Base Case IDR LLC owns the 100% of the IDRs in AM and has two share classes AMGP owns 100% of the Series A units Management owns 100% of the Series B units Series B unitholders are entitled to receive up to 6% of the distributions from AM in excess of $7.5MM per quarter Remaining profits pass through AMGP via Series A shares Series B units scheduled to vest at a value of 6% of equity value above $2 billion in the event of a liquidation of IDR LLC AMGP currently pays corporate taxes of 21% and 4% at the federal and state taxes, respectively IDR LLC, Series B Cash Flow, and Tax Observations AMGP Total Distributions IDR LLC Cash Flow ’19 – ’22 CAGR 26% 31% ($ in millions, unless otherwise noted) ___________________________________ Source: Management Projections, Company Filings. Implied AMGP and Series B valuation from 2016A through 2020E based on 2018E yield. Implied AMGP and Series B valuation from 2021E forward based on yield vs growth regression analysis. Excludes IPO related G&A. Series B valuation calculated as 6% of the valuation of AMGP less $2 billion. Illustrative yield based on regression analysis. 60 50 2019E 2020E 2021E 2022E AM Distributions to IDR LLC $235 $355 $462 $525 Series B Take (12) (20) (26) (30) Cash Distributions to AMGP $223 $336 $436 $496 G&A (3) (2) (2) (2) (2) Taxes (56) (85) (110) (125) CAFD to AMGP Shareholders $165 $249 $324 $369 Illustrative Yield 3.3% 3.3% 3.5% 5.9% AMGP Valuation $5,000 $7,545 $9,370 $6,246 Series B Valuation (4) $180 $333 $442 $255 $165 $249 $324 $369 $56 $85 $110 $125 $2 $2 $2 $2 $12 $20 $26 $30 $235 $355 $462 $525 2019E 2020E 2021E 2022E $10 $48 $100 $165 $249 $324 $413 $6 $16 $34 $56 $85 $110 $140 $1 $2 $2 $2 $2 $2 $2 $2 $7 $12 $20 $26 $34 2016A 2017A 2018E 2019E 2020E 2021E 2022E Distributions to AMGP Taxes G&A Series B Reserved CF $10 $48 $101 $166 $250 $326 $415 $52 $86 $144 $237 $302 $369 $441 2016A 2017A 2018E 2019E 2020E 2021E 2022E SQ AM Distribution Policy SQ AM Fully Distributed $165 $249 $324 $369 $195 $265 $340 $386 2019A 2020A 2021E 2022E
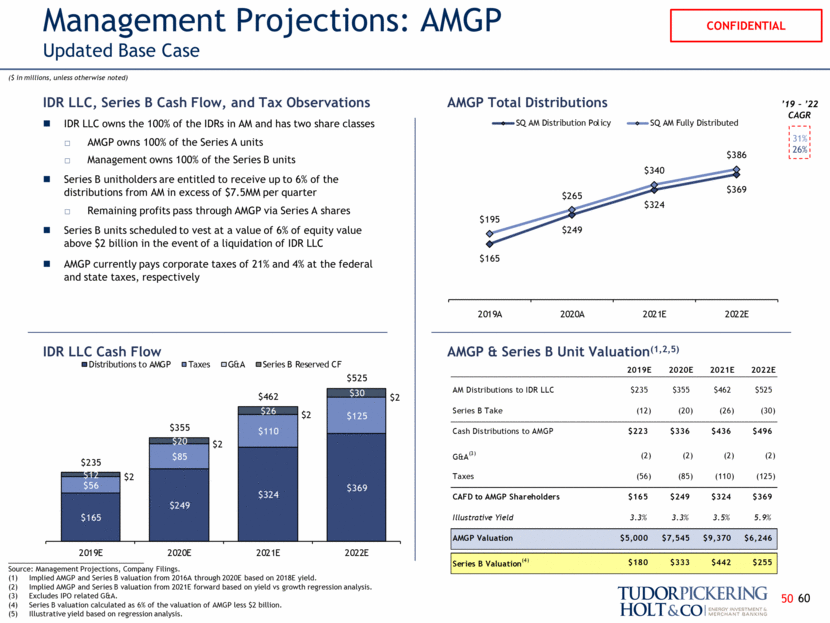
AMGP & Series B Unit Valuation(1,2,5) Management Projections: AMGP Updated Downside Case IDR LLC owns the 100% of the IDRs in AM and has two share classes AMGP owns 100% of the Series A units Management owns 100% of the Series B units Series B unitholders are entitled to receive up to 6% of the distributions from AM in excess of $7.5MM per quarter Remaining profits pass through AMGP via Series A shares Series B units scheduled to vest at a value of 6% of equity value above $2 billion in the event of a liquidation of IDR LLC AMGP currently pays corporate taxes of 21% and 4% at the federal and state taxes, respectively IDR LLC, Series B Cash Flow, and Tax Observations AMGP Total Distributions IDR LLC Cash Flow ’19 – ’22 CAGR 23% 25% ($ in millions, unless otherwise noted) ___________________________________ Source: Management Projections, Company Filings. Implied AMGP and Series B valuation from 2016A through 2020E based on 2018E yield. Implied AMGP and Series B valuation from 2021E forward based on yield vs growth regression analysis. Excludes IPO related G&A. Series B valuation calculated as 6% of the valuation of AMGP less $2 billion. Illustrative yield based on regression analysis. 61 51 2019E 2020E 2021E 2022E AM Distributions to IDR LLC $235 $304 $378 $462 Series B Take (12) (16) (21) (26) Cash Distributions to AMGP $223 $287 $357 $436 G&A (3) (2) (2) (2) (2) Taxes (56) (72) (90) (110) CAFD to AMGP Shareholders $165 $213 $265 $324 Illustrative Yield 3.3% 3.3% 5.1% 5.6% AMGP Valuation $5,000 $6,451 $5,193 $5,764 Series B Valuation (4) $180 $267 $192 $226 $165 $213 $265 $324 $56 $72 $90 $110 $2 $2 $2 $2 $12 $16 $21 $26 $235 $304 $378 $462 2019E 2020E 2021E 2022E $10 $48 $100 $165 $249 $324 $413 $6 $16 $34 $56 $85 $110 $140 $1 $2 $2 $2 $2 $2 $2 $2 $7 $12 $20 $26 $34 2016A 2017A 2018E 2019E 2020E 2021E 2022E Distributions to AMGP Taxes G&A Series B Reserved CF $10 $48 $101 $166 $250 $326 $415 $52 $86 $144 $237 $302 $369 $441 2016A 2017A 2018E 2019E 2020E 2021E 2022E SQ AM Distribution Policy SQ AM Fully Distributed $165 $213 $265 $324 $195 $238 $324 $359 2019A 2020A 2021E 2022E
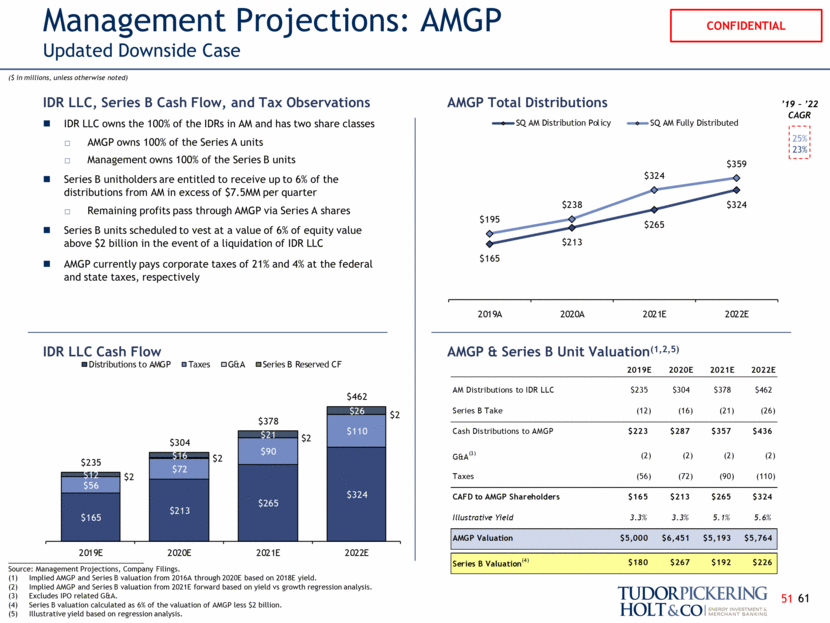
AMGP & Series B Unit Valuation(1,2,5) Management Projections: AMGP Updated Upside Case IDR LLC owns the 100% of the IDRs in AM and has two share classes AMGP owns 100% of the Series A units Management owns 100% of the Series B units Series B unitholders are entitled to receive up to 6% of the distributions from AM in excess of $7.5MM per quarter Remaining profits pass through AMGP via Series A shares Series B units scheduled to vest at a value of 6% of equity value above $2 billion in the event of a liquidation of IDR LLC AMGP currently pays corporate taxes of 21% and 4% at the federal and state taxes, respectively IDR LLC, Series B Cash Flow, and Tax Observations AMGP Total Distributions IDR LLC Cash Flow ’19 – ’22 CAGR 30% 36% ($ in millions, unless otherwise noted) ___________________________________ Source: Management Projections, Company Filings. Implied AMGP and Series B valuation from 2016A through 2020E based on 2018E yield. Implied AMGP and Series B valuation from 2021E forward based on yield vs growth regression analysis. Excludes IPO related G&A. Series B valuation calculated as 6% of the valuation of AMGP less $2 billion. Illustrative yield based on regression analysis. 62 2019E 2020E 2021E 2022E AM Distributions to IDR LLC $235 $355 $462 $589 Series B Take (12) (20) (26) (34) Cash Distributions to AMGP $223 $336 $436 $555 G&A (3) (2) (2) (2) (2) Taxes (56) (85) (110) (140) CAFD to AMGP Shareholders $165 $249 $324 $413 Illustrative Yield 3.3% 3.3% 3.5% 4.8% AMGP Valuation $5,000 $7,545 $9,370 $8,617 Series B Valuation (4) $180 $333 $442 $397 $165 $249 $324 $413 $56 $85 $110 $140 $2 $2 $2 $2 $12 $20 $26 $34 $235 $355 $462 $589 2019E 2020E 2021E 2022E $10 $48 $100 $165 $249 $324 $413 $6 $16 $34 $56 $85 $110 $140 $1 $2 $2 $2 $2 $2 $2 $2 $7 $12 $20 $26 $34 2016A 2017A 2018E 2019E 2020E 2021E 2022E Distributions to AMGP Taxes G&A Series B Reserved CF $10 $48 $101 $166 $250 $326 $415 $52 $86 $144 $237 $302 $369 $441 2016A 2017A 2018E 2019E 2020E 2021E 2022E SQ AM Distribution Policy SQ AM Fully Distributed $165 $249 $324 $413 $193 $256 $366 $421 2019A 2020A 2021E 2022E
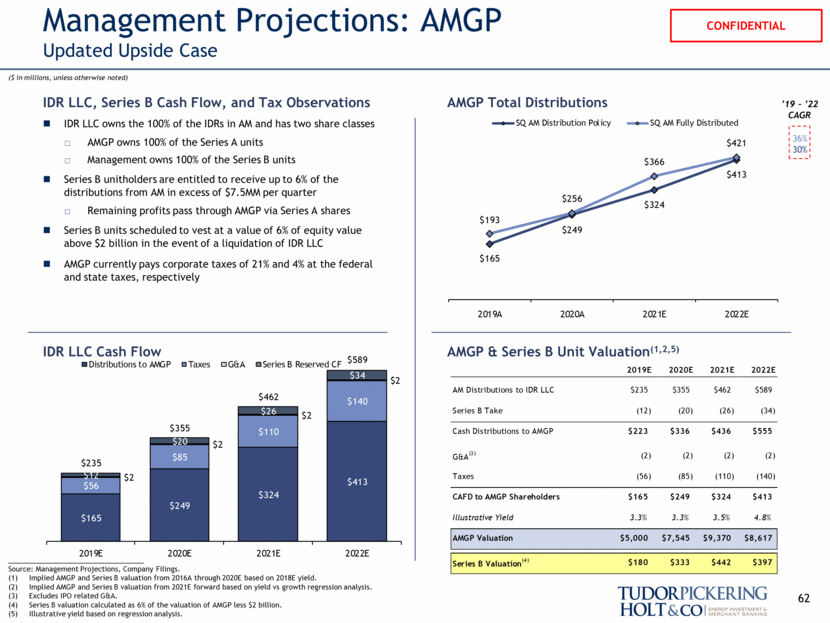
AM Status Quo Management Projections & Wall Street Consensus AM is covered by 14 analysts as compared to 22 for AR and 12 for AMGP Median price target of $37.00 as of 1/4/2019 Average price target range of $23.00 - $49.00 as of 1/4/2019 Commentary EBITDA Distributable Cash Flow / LP Unit Distributions per Unit ___________________________________ Source: Management Projections, Thomson One, FactSet as of 1/4/2019. ($ in millions, unless otherwise noted) 23% 2019E – 2022E CAGR 19% 20% 2019E – 2022E CAGR 15% 21% 2019E – 2022E CAGR 19% 17% 17% 18% 63 16% 15% 16% 52 $2.85 $3.42 $4.10 $2.20 $2.81 $2.53 $3.52 $2.85 $3.42 $3.76 $2.21 $2.58 $2.97 $3.42 2019E 2020E 2021E 2022E $2.90 $3.74 $4.16 $2.88 $3.31 $2.97 $3.54 $3.89 $2.44 $2.77 $3.42 $3.68 2019E 2020E 2021E 2022E $3.76 $3.89 $4.17 $3.42 1E Wall Street Consensus Mgmt. Projections at Updated Upside Case Mgmt. Projections at Updated Base Case Mgmt. Projections at Updated Downside Case $1,128 $1,431 $1,588 $932 $1,184 $1,431 $1,564 $1,143 $1,338 $1,465 $892 $1,051 $1,296 $1,382 2019E 2020E 2021E 2022E
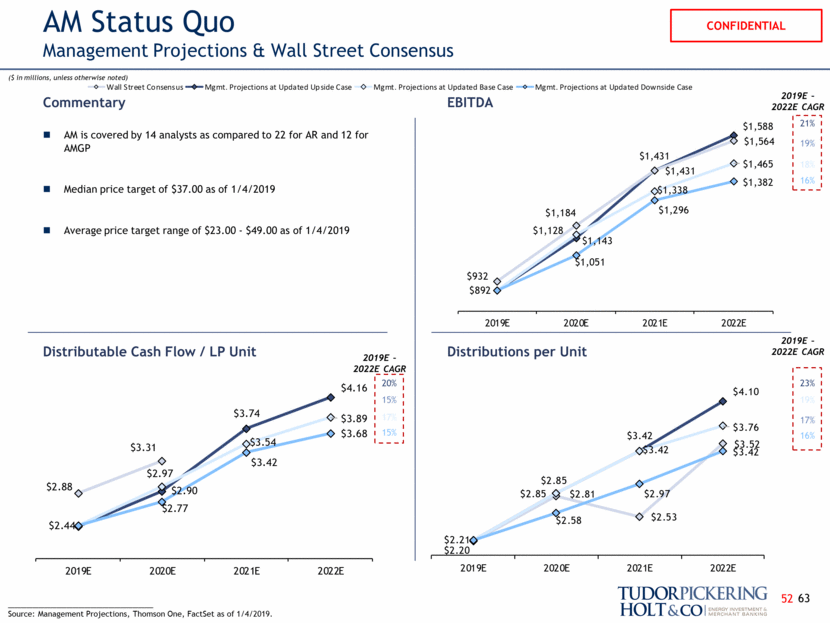
AMGP Status Quo Management Projections & Wall Street Consensus AMGP is covered by 12 analysts as compared to 22 for AR and 14 for AM Median price target of $21.00 as of 1/4/2019 Average price target range of $15.00 - $27.00 as of 1/4/2019 Commentary EBITDA Total Distributions to AMGP Shareholders Distributions per Share ___________________________________ Source: Management Projections, Thomson One, FactSet as of 1/4/2019. Note: WSC estimates available for AMGP through 2020E. 2017A distributions / share represents 4th quarter distribution annualized. ($ in millions, unless otherwise noted) 36% 2019E – 2022E CAGR 31% 36% 2019E – 2022E CAGR 31% 36% 2019E – 2022E CAGR 30% 64 25% 25% 25% 53 $336 $436 $555 $223 $336 $436 $496 $330 $280 $458 $223 $287 $357 $436 2019E 2020E 2021E 2022E $1.34 $1.74 $2.22 $1.34 $1.74 $1.98 $1.32 $1.55 $1.81 $0.89 $1.14 $1.42 $1.74 2019E 2020E 2021E 2022E $249 $324 $413 $249 $324 $369 $245 $289 $337 $165 $213 $265 $324 2019E 2020E 2021E 2022E $3.76 $3.89 $4.17 $3.42 1E Wall Street Consensus Mgmt. Projections at Updated Upside Case Mgmt. Projections at Updated Base Case Mgmt. Projections at Updated Downside Case
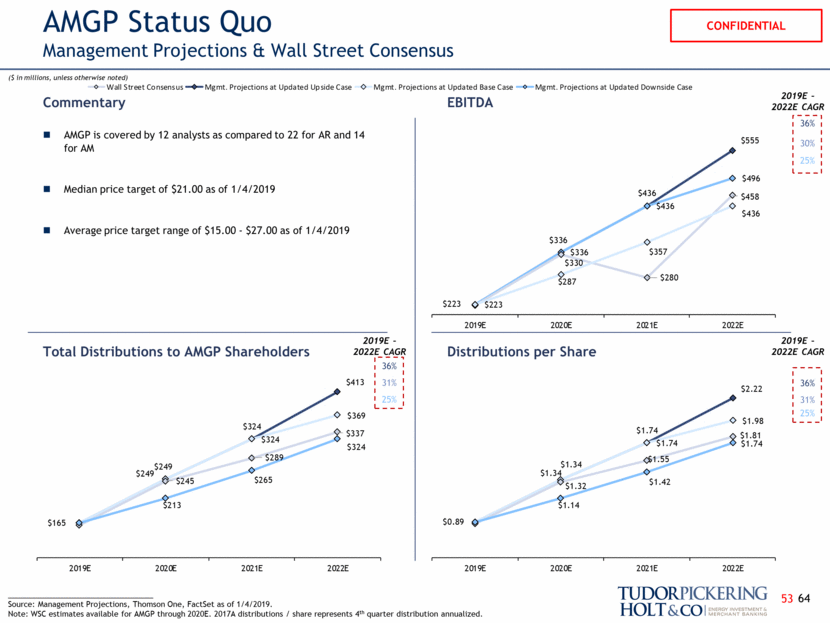
PF AMGP Projections at Transaction EBITDA Distributable Cash Flow Dividend / Share ___________________________________ Source: Management Projections Note: Analysis based on fully diluted share count. ($ in millions, unless otherwise noted) 21% 2019E – 2022E CAGR 18% 23% 2019E – 2022E CAGR 23% 24% 2019E – 2022E CAGR 21% Distributable Cash Flow / Share 24% 20% 2019E – 2022E CAGR 65 17% 16% 18% 23% 54 $1.24 $1.60 $1.92 $2.30 $1.24 $1.60 $1.92 $2.30 $1.24 $1.60 $1.92 $2.30 2019E 2020E 2021E 2022E $892 $1,128 $1,431 $1,588 $892 $1,143 $1,338 $1,465 $892 $1,051 $1,296 $1,382 2019E 2020E 2021E 2022E $1.39 $1.72 $2.33 $2.61 $1.40 $1.76 $2.19 $2.37 $1.40 $1.61 $2.09 $2.24 2019E 2020E 2021E 2022E $696 $872 $1,186 $1,325 $701 $896 $1,113 $1,205 $701 $818 $1,060 $1,137 2019E 2020E 2021E 2022E $3.76 $3.89 $4.17 $3.42 1E Wall Street Consensus Mgmt. Projections at Updated Upside Case Mgmt. Projections at Updated Base Case Mgmt. Projections at Updated Downside Case
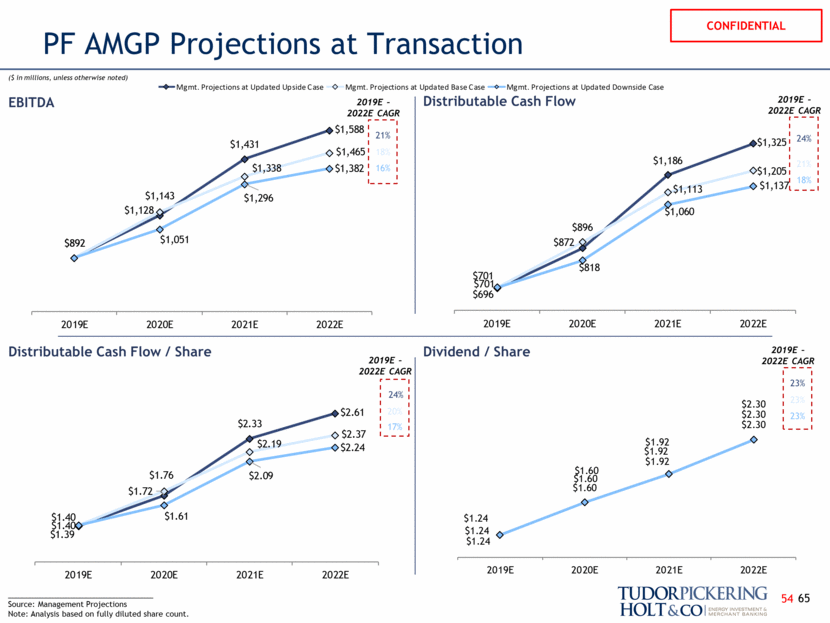
Cost of Capital 66
SQ AM Peer Group Cost of Equity Analysis Comparable Public Company Yield-Based Cost of Equity Expected Total Return Cost of Equity Sensitized Peer Total Return Cost of Equity Barra Beta ______________________________________________ Source: Bloomberg, Duff & Phelps, FactSet, Federal Reserve, Company filings as of 1/4/2019. Weights Expected Current – 2020E distribution growth estimates 15% and long-term economic growth estimate by 85% to arrive at a long-term distribution growth estimate. Barra beta as of 12/29/2018. Illustrative low and high range reflects a -/+ 15% range around Barra beta. 20-year treasury bond yield as of 1/4/2019. Duff & Phelps historical arithmetic premium. Low High (2) (3) (4) 67 56 A B C D E F Expected Current - 2020E Long-Term Economic Company Distribution CAGR Growth Estimate Expected Growth (1) Current Yield Implied Total Return CNX Midstream Partners LP 15.0% 4.0% 5.6% 8.1% 13.7% Phillips 66 Partners LP 10.0% 4.0% 4.9% 6.6% 11.5% Oasis Midstream Partners LP 20.0% 4.0% 6.4% 9.5% 15.9% Hess Midstream Partners LP 14.9% 4.0% 5.6% 7.7% 13.3% Noble Midstream Partners LP 19.7% 4.0% 6.4% 6.7% 13.1% BP Midstream Partners LP 14.7% 4.0% 5.6% 6.9% 12.5% Shell Midstream Partners LP 11.5% 4.0% 5.1% 8.1% 13.3% Western Gas Partners, L.P. 6.1% 4.0% 4.3% 8.6% 12.9% EQT Midstream Partners LP 8.7% 4.0% 4.7% 10.0% 14.7% Median 14.7% 4.0% 5.6% 8.1% 13.3% Mean 13.4% 4.0% 5.4% 8.0% 13.4% Raw Beta 0.61 0.82 Spot Risk-Free Rate 2.8% 2.8% Equity Risk Premium 6.0% 6.0% Cost of Equity 6.5% 7.8% Cost of Equity 12.8% 13.8%
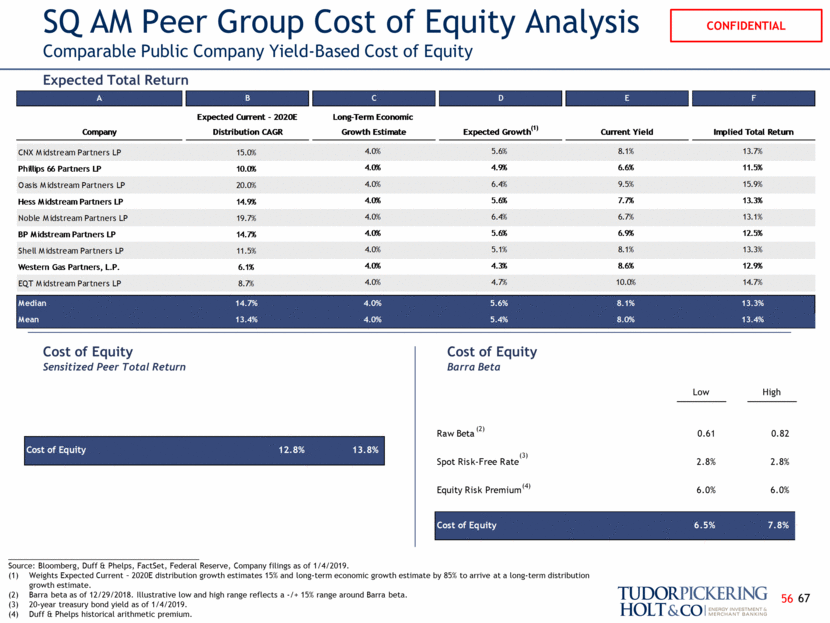
SQ AMGP Peer Group Cost of Equity Analysis Comparable Public Company Yield-Based Cost of Equity Expected Total Return Cost of Equity Sensitized Peer Total Return Cost of Equity Barra Beta ______________________________________________ Source: Bloomberg, Duff & Phelps, FactSet, Federal Reserve, Company filings as of 1/4/2019. Weights Expected Current – 2020E distribution growth estimates 15% and long-term economic growth estimate by 85% to arrive at a long-term distribution growth estimate. Barra beta as of 12/29/2018. Illustrative low and high range reflects a -/+ 15% range around Barra beta. 20-year treasury bond yield as of 1/4/2019. Duff & Phelps historical arithmetic premium. Low High (2) (3) (4) 68 57 Raw Beta 0.69 0.93 Spot Risk-Free Rate 2.8% 2.8% Equity Risk Premium 6.0% 6.0% Cost of Equity 7.0% 8.4% Cost of Equity 12.3% 13.3% A B C D E F Expected Current - 2020E Long-Term Economic Company Distribution CAGR Growth Estimate Expected Growth (1) Current Yield Implied Total Return EQT GP Holdings LP 8.0% 4.0% 4.6% 6.3% 10.9% Equitrans Midstream LLC 9.7% 4.0% 4.9% 7.9% 12.8% Western Gas Equity Partners, LP 9.4% 4.0% 4.8% 8.1% 12.9% Median 9.4% 4.0% 4.8% 7.9% 12.8% Mean 9.0% 4.0% 4.8% 7.4% 12.2%
PF AMGP Peer Group WACC Analysis ______________________________________________ Source: Bloomberg, Duff & Phelps, FactSet, Federal Reserve, Company filings as of 1/4/2019. Weights Expected Current – 2020E distribution growth estimates 15% and long-term economic growth estimate by 85% to arrive at a long-term distribution growth estimate. Expected Total Return 69 58 A B C D E F 2018E - 2020E Long-Term Economic Company Dividend CAGR Growth Estimate Expected Growth (1) Current Yield Implied Total Return Kinder Morgan Inc 25.0% 4.0% 7.1% 3.1% 10.2% ONEOK, Inc. 10.5% 4.0% 5.0% 5.3% 10.2% Plains All American Pipeline LP 10.7% 4.0% 5.0% 5.3% 10.3% SemGroup Corporation 5.1% 4.0% 4.2% 11.6% 15.7% Tallgrass Energy, LP 6.6% 4.0% 4.4% 5.0% 9.4% Targa Resources Corp. 0.8% 4.0% 3.5% 9.2% 12.8% The Williams Companies, Inc. 11.3% 4.0% 5.1% 5.1% 10.2% BP Midstream Partners LP 14.7% 4.0% 5.6% 6.9% 12.5% CNX Midstream Partners LP 15.0% 4.0% 5.6% 8.1% 13.7% Hess Midstream Partners LP 14.9% 4.0% 5.6% 7.7% 13.3% Noble Midstream Partners LP 19.7% 4.0% 6.4% 6.7% 13.1% Oasis Midstream Partners LP 20.0% 4.0% 6.4% 9.5% 15.9% Phillips 66 Partners LP 10.0% 4.0% 4.9% 6.6% 11.5% Shell Midstream Partners LP 11.5% 4.0% 5.1% 8.1% 13.3% Median 11.4% 4.0% 5.1% 6.8% 12.7% Mean 12.5% 4.0% 5.3% 7.0% 12.3%
PF AMGP Peer Group WACC Analysis (cont.) Cost of Equity Comparable Company Yield-Based Cost of Equity Barra Beta 70 ______________________________________________ Source: Bloomberg, Duff & Phelps, FactSet, Federal Reserve, Company filings as of 1/4/2019. Illustrative low and high range reflects a -/+ 100 bps range around after tax current 5.6% cost of debt at AM. Barra beta for AMGP as of 12/29/2018. Illustrative low and high range reflects a -/+ 15% range around Barra beta. 20-year treasury bond yield as of 1/4/2019. Duff & Phelps historical arithmetic premium. Optimal Capital Structure based on Total Debt of 3.5x 2019E EBITDA Low High Low High (2) (3) (4) Low High Low High (1) Cost of Capital Yield Based PF Capital Structure Cost of Capital Yield Based Optimal Capital Structure(5) (1) Low High Low High Cost of Capital Barra Beta PF Capital Structure Cost of Capital Barra Beta Optimal Capital Structure(5) (1) (1) 59 Raw Beta 0.69 0.93 Spot Risk-Free Rate 2.8% 2.8% Equity Risk Premium 6.0% 6.0% Cost of Equity 7.0% 8.4% Cost of Equity 12.2% 13.2% Cost of Debt 3.4% 4.9% Market Value of Equity $6,403 $6,403 Total Debt $3,121 $3,121 Cost of Capital 9.3% 10.5% Cost of Equity 12.2% 13.2% Cost of Debt 3.4% 4.9% Market Value of Equity $6,403 $6,403 Total Debt $1,205 $1,205 Cost of Capital 10.8% 11.9% Cost of Equity 12.2% 13.2% Market Value of Equity $6,403 $6,403 Cost of Equity 12.2% 13.2% Cost of Equity 7.0% 8.4% Cost of Debt 3.4% 4.9% Market Value of Equity $6,403 $6,403 Total Debt $3,121 $3,121 Cost of Capital 5.8% 7.3% Cost of Equity 7.0% 8.4% Cost of Debt 3.4% 4.9% Market Value of Equity $6,403 $6,403 Total Debt $1,205 $1,205 Cost of Capital 6.4% 7.9%
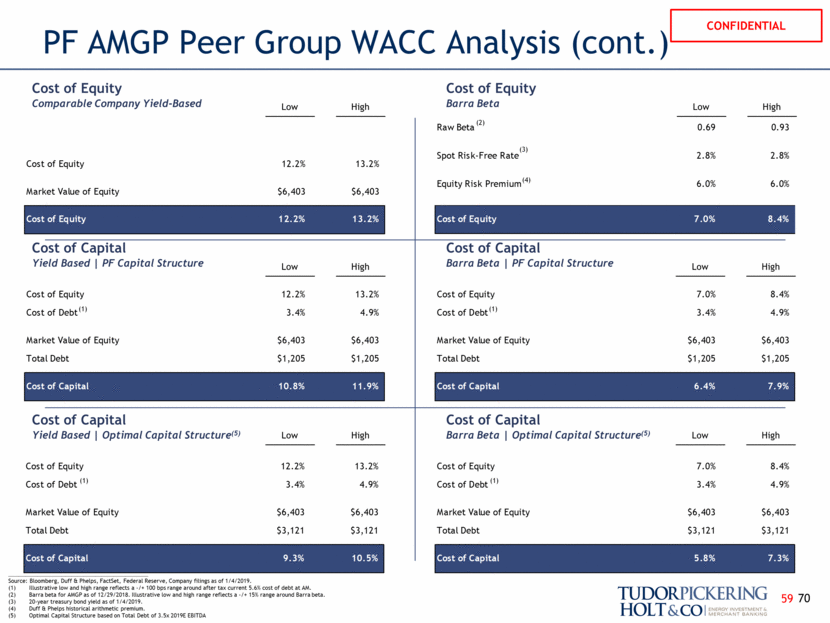
Updated Financial Projections Summary 71
Commodity Price Comparison Prior Forecast vs. 12/21/2018 Model Oil ($/bbl) Gas ($/MMBtu) 72 ______________________________________ Source: Company Management. C3+ NGLs ($/bbl) $56.18 $53.76 $52.29 $51.67 $50.00 $50.00 $50.00 $50.00 $57.50 $65.00 $65.00 $65.00 $57.50 $57.50 $57.50 $57.50 $50.00 $50.00 $50.00 $50.00 $49.53 $51.63 $52.40 $53.01 $45.00 $50.00 $55.00 $60.00 $65.00 $70.00 2019 2020 2021 2022 $2.81 $2.82 $2.85 $2.89 $2.50 $2.50 $2.50 $2.50 $3.25 $3.15 $3.15 $3.15 $3.25 $3.00 $3.00 $3.00 $3.25 $2.85 $2.85 $2.85 $2.86 $2.65 $2.61 $2.66 $2.30 $2.50 $2.70 $2.90 $3.10 $3.30 $3.50 2019 2020 2021 2022 $40.14 $38.47 $37.44 $36.95 $35.54 $35.45 $35.52 $35.50 $36.19 $41.49 $41.47 $41.49 $36.19 $36.70 $36.68 $36.71 $31.47 $31.91 $31.90 $31.92 $30.00 $32.00 $34.00 $36.00 $38.00 $40.00 $42.00 $44.00 2019 2020 2021 2022 $56.18 $53.76 $52.29 $51.67 $50.00 $50.00 $50.00 $50.00 $57.50 $65.00 $65.00 $65.00 $57.50 $57.50 $57.50 $57.50 $50.00 $50.00 $50.00 $50.00 $45.00 $50.00 $55.00 $60.00 $65.00 $70.00 2019 2020 2021 2022 Prior AM Base Case Prior AM Downside Case New AM Upside Case New AM Base Case New AM Downside Case Strip @ 1/4/2019
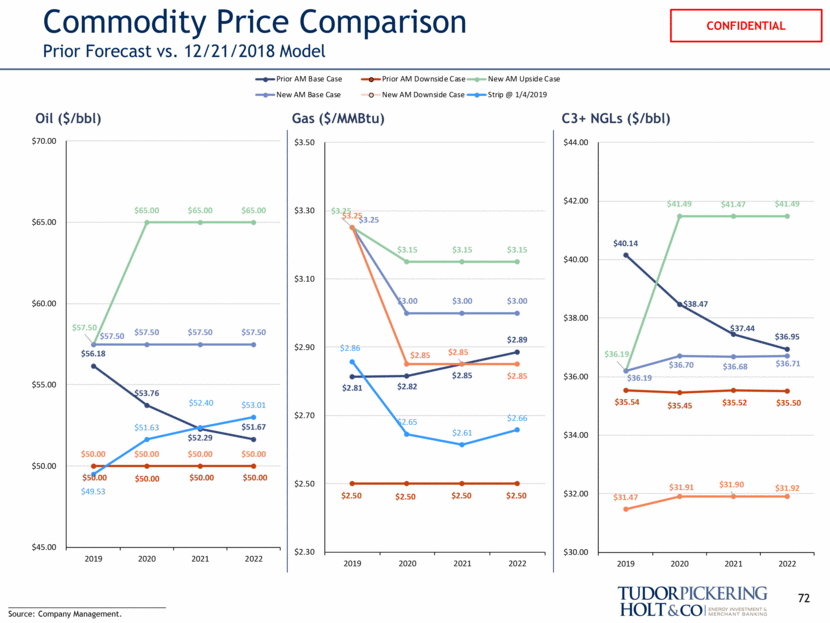
Management Projections: AM EBITDA Capital Expenditures Total DCF LP DCF per Unit ___________________________________ Source: Management projections ($ in millions, unless otherwise noted) 73 $989 $1,222 $1,413 $1,642 $851 $1,105 $1,229 $1,409 $892 $1,143 $1,338 $1,465 $1,128 $1,431 $1,588 $1,051 $1,296 $1,383 $800 $900 $1,000 $1,100 $1,200 $1,300 $1,400 $1,500 $1,600 $1,700 2019 2020 2021 2022 $989 $1,222 $1,413 $1,642 $851 $1,105 $1,229 $1,409 $1,128 $1,431 $1,588 $892 $1,143 $1,338 $1,465 $1,051 $1,296 $1,383 $800 $900 $1,000 $1,100 $1,200 $1,300 $1,400 $1,500 $1,600 $1,700 2019 2020 2021 2022 Prior AM Base Case Prior AM Downside Case New AM Upside Case New AM Base Case New AM Downside Case $815 $719 $430 $352 $488 $506 $272 $194 $769 $827 $348 $141 $838 $450 $344 $695 $382 $262 $100 $200 $300 $400 $500 $600 $700 $800 $900 2019 2020 2021 2022 $849 $1,034 $1,222 $1,425 $721 $955 $1,071 $1,233 $728 $928 $1,145 $1,277 $732 $907 $1,223 $1,381 $727 $852 $1,099 $1,199 $700 $800 $900 $1,000 $1,100 $1,200 $1,300 $1,400 $1,500 2019 2020 2021 2022 $2.73 $3.22 $3.72 $4.26 $2.39 $3.01 $3.32 $3.75 $2.42 $2.96 $3.54 $3.89 $2.43 $2.90 $3.74 $4.17 $2.42 $2.75 $3.41 $3.68 $2.00 $2.50 $3.00 $3.50 $4.00 $4.50 2019 2020 2021 2022
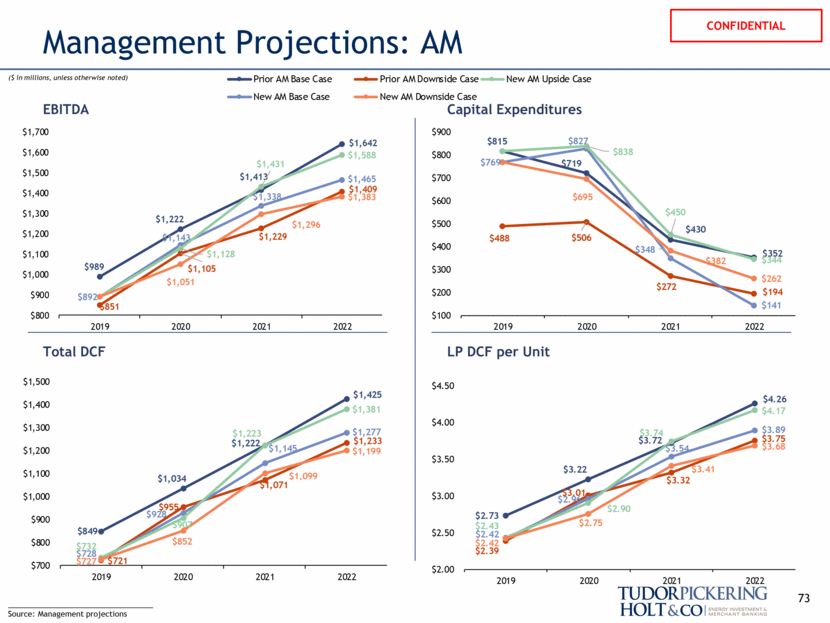
Management Projections: AM (cont.) 74 ___________________________________ Source: Management projections ($ in millions, unless otherwise noted) LP Coverage Distribution per Unit 1.24x 1.13x 1.09x 1.04x 1.12x 1.17x 1.12x 1.10x 1.10x 1.04x 1.03x 1.03x 1.10x 1.02x 1.09x 1.02x 1.09x 1.07x 1.15x 1.08x 1.00x 1.05x 1.10x 1.15x 1.20x 1.25x 2019 2020 2021 2022 $989 $1,222 $1,413 $1,642 $851 $1,105 $1,229 $1,409 $1,128 $1,431 $1,588 $892 $1,143 $1,338 $1,465 $1,051 $1,296 $1,383 $800 $900 $1,000 $1,100 $1,200 $1,300 $1,400 $1,500 $1,600 $1,700 2019 2020 2021 2022 Prior AM Base Case Prior AM Downside Case New AM Upside Case New AM Base Case New AM Downside Case $2.21 $2.85 $3.42 $3.76 $2.21 $2.85 $3.42 $4.10 $2.15 $2.58 $2.97 $3.42 $2.21 $2.85 $3.42 $4.10 $2.21 $2.58 $2.97 $3.42 $2.00 $2.50 $3.00 $3.50 $4.00 $4.50 2019 2020 2021 2022
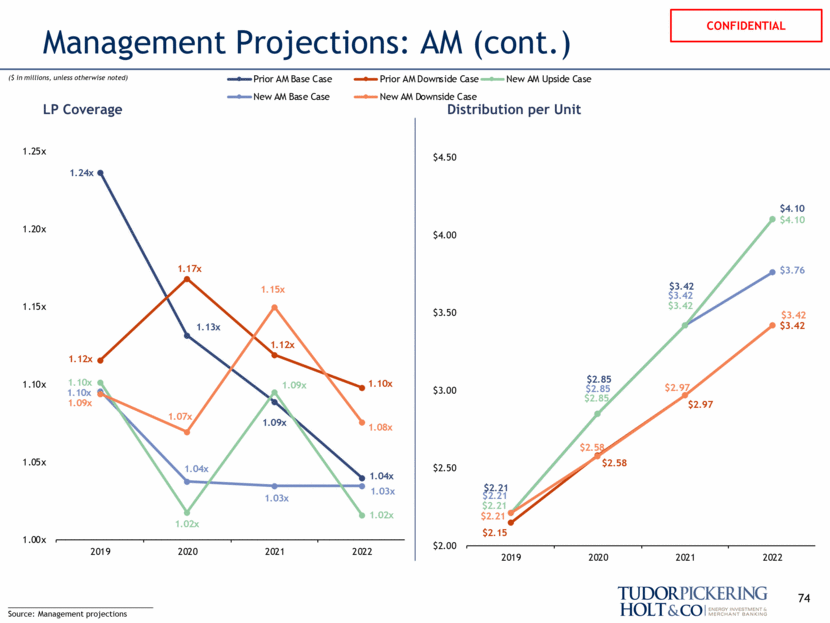
Tudor, Pickering, Holt & Co. is an integrated energy investment and merchant bank, providing high quality advice and services to institutional and corporate clients. Through the company’s two broker-dealer units, Tudor, Pickering, Holt & Co. Securities, Inc. (TPHCSI) and Tudor Pickering Holt & Co Advisors LP (TPHCA), members FINRA, together with affiliates in the United Kingdom and Canada, the company offers securities and investment banking services to the energy community. Perella Weinberg Partners Capital Management LP is an SEC registered investment adviser that delivers a suite of energy investment strategies. The firm, headquartered in Houston, Texas, has approximately 170 employees and offices in Calgary, Canada; Denver, Colorado; New York, New York; and London, England. Contact Us Houston (Research, Sales and Trading): 713-333-2960 Houston (Investment Banking): 713-333-7100 Houston (Asset Management): 713-337-3999 Denver (Sales): 303-300-1900 Denver (Investment Banking): 303-300-1900 New York (Investment Banking): 212-610-1660 New York (Research, Sales): 212-610-1600 London: +011 44(0) 20 7268 2800 Calgary: 403-705-7830 www.TPHco.com Copyright 2019 — Tudor, Pickering, Holt & Co. Tudor, Pickering, Holt & Co. does not provide accounting, tax or legal advice. In addition, we mutually agree that, subject to applicable law, you (and your employees, representatives and other agents) may disclose any aspects of any potential transaction or structure described herein that are necessary to support any U.S. federal income tax benefits, and all materials of any kind (including tax opinions and other tax analyses) related to those benefits, with no limitations imposed by Tudor, Pickering, Holt & Co. The information contained herein is confidential (except for information relating to United States tax issues) and may not be reproduced in whole or in part. Tudor, Pickering, Holt & Co. assumes no responsibility for independent verification of third-party information and has relied on such information being complete and accurate in all material respects. To the extent such information includes estimates and forecasts of future financial performance (including estimates of potential cost savings and synergies) prepared by, reviewed or discussed with the managements of your company and/ or other potential transaction participants or obtained from public sources, we have assumed that such estimates and forecasts have been reasonably prepared on bases reflecting the best currently available estimates and judgments of such managements (or, with respect to estimates and forecasts obtained from public sources, represent reasonable estimates). These materials were designed for use by specific persons familiar with the business and the affairs of your company for use in a specific context and were not prepared with a view to public disclosure or to conform with any disclosure standards under any state, federal or international securities laws or other laws, rules or regulations. Under no circumstances is this presentation to be used or considered as an offer to sell or a solicitation of any offer to buy, any security. Prior to making any trade, you should discuss with your professional tax, accounting, or regulatory advisers how such particular trade(s) affect you. This brief statement does not disclose all of the risks and other significant aspects of entering into any particular transaction. Tudor, Pickering, Holt & Co. operates in the United Kingdom under the trading name Perella Weinberg Partners UK LLP (authorized and regulated by the Financial Conduct Authority), and in Canada through its affiliate, Tudor, Pickering, Holt & Co. Securities – Canada, ULC, located in Calgary, Alberta. About The Firm Disclosure Statement 75