Project Francis Conflicts Committee GP LLC Discussion Materials of the Board of Directors of AMGP January 10, 2019
Project Francis Conflicts Committee GP LLC Discussion Materials of the Board of Directors of AMGP January 10, 2019

Disclaimer These materials have been prepared and are provided by Goldman Sachs on a confidential basis solely for the information and assistance of the Conflicts Committee of Board of Directors of AMGP GP LLC (the “Committee"), the general partner of Antero Midstream GP LP (the "Company"), in connection with its consideration of the matters referred to herein. These materials and Goldman Sachs’ presentation relating to these materials (the “Confidential Information”) may not be disclosed to any third party or circulated or referred to publicly or used for or relied upon for any other purpose without the prior written consent of Goldman Sachs. The Confidential Information was not prepared with a view to public disclosure or to conform to any disclosure standards under any state, federal or international securities laws or other laws, rules or regulations, and Goldman Sachs does not take any responsibility for the use of the Confidential Information by persons other than those set forth above. Notwithstanding anything in this Confidential Information to the contrary, the Company may disclose to any person the US federal income and state income tax treatment and tax structure of any transaction described herein and all materials of any kind (including tax opinions and other tax analyses) that are provided to the Company relating to such tax treatment and tax structure, without Goldman Sachs imposing any limitation of any kind. The Confidential Information has been prepared by the Investment Banking Division of Goldman Sachs and is not a product of its research department. Goldman Sachs and its affiliates are engaged in advisory, underwriting and financing, principal investing, sales and trading, research, investment management and other financial and non-financial activities and services for various persons and entities. Goldman Sachs and its affiliates and employees, and funds or other entities they manage or in which they invest or have other economic interests or with which they co-invest, may at any time purchase, sell, hold or vote long or short positions and investments in securities, derivatives, loans, commodities, currencies, credit default swaps and other financial instruments of the Company, any other party to any transaction and any of their respective affiliates or any currency or commodity that may be involved in any transaction. Goldman Sachs’ investment banking division maintains regular, ordinary course client service dialogues with clients and potential clients to review events, opportunities, and conditions in particular sectors and industries and, in that connection, Goldman Sachs may make reference to the Company, but Goldman Sachs will not disclose any confidential information received from the Company. The Confidential Information has been prepared based on historical financial information, forecasts and other information obtained by Goldman Sachs from publicly available sources, the management of the Company or other sources (approved for our use by the Company in the case of information from management and non-public information). In preparing the Confidential Information, Goldman Sachs has relied upon and assumed, without assuming any responsibility for independent verification, the accuracy and completeness of all of the financial, legal, regulatory, tax, accounting and other information provided to, discussed with or reviewed by us, and Goldman Sachs does not assume any liability for any such information. Goldman Sachs does not provide accounting, tax, legal or regulatory advice. Goldman Sachs has not made an independent evaluation or appraisal of the assets and liabilities (including any contingent, derivative or other off-balance sheet assets and liabilities) of the Company or any other party to any transaction or any of their respective affiliates and has no obligation to evaluate the solvency of the Company or any other party to any transaction under any state or federal laws relating to bankruptcy, insolvency or similar matters. The analyses contained in the Confidential Information do not purport to be appraisals nor do they necessarily reflect the prices at which businesses or securities actually may be sold or purchased. Goldman Sachs’ role in any due diligence review is limited solely to performing such a review as it shall deem necessary to support its own advice and analysis and shall not be on behalf of the Company. Analyses based upon forecasts of future results are not necessarily indicative of actual future results, which may be significantly more or less favorable than suggested by these analyses, and Goldman Sachs does not assume responsibility if future results are materially different from those forecast. The Confidential Information does not address the underlying business decision of the Company to engage in any transaction, or the relative merits of any transaction or strategic alternative referred to herein as compared to any other transaction or alternative that may be available to the Company. The Confidential Information is necessarily based on economic, monetary, market and other conditions as in effect on, and the information made available to Goldman Sachs as of, the date of such Confidential Information and Goldman Sachs assumes no responsibility for updating or revising the Confidential Information based on circumstances, developments or events occurring after such date. The Confidential Information does not constitute any opinion, nor does the Confidential Information constitute a recommendation to the Committee, any security holder of the Company or any other person as to how to vote or act with respect to any transaction or any other matter. The Confidential Information, including this disclaimer, is subject to, and governed by, any written agreement between the Company and the Committee, on the one hand, and Goldman Sachs, on the other hand. 1
Summary of Recent Developments and Updated Financial Analysis Summary of Recent Developments On 8-Jan-2019, AR released updated guidance to the market reflective of updates to the company’s annual budget, consistent with the company’s normal practices and timeline AR communicated that it will adjust production growth depending natural gas, oil, and NGL price expectations with the objectives of funding all drilling and completion activity from standalone operating cash flow, maintaining low leverage, and returning capital to shareholders Changes in AR’s production forecast directly impact AM and AMGP because AR provides substantially all of the volumes that flow through AM’s systems and AM operates under long-term fixed, fee contracts with AR Volumes in the new base case forecast are lower than volumes in the 2018 base case AR budget that was the basis for the AM, AMGP, and New AM forecasts developed by AR management for Project Francis, resulting in cash flow forecasts for AM, AMGP, and New AM in the 2019 budget that are lower than expected from the Project Francis forecasts Summary of Updated Financial Analysis Financial forecasts adjusted to reflect the New AM Revised Budget, AM Revised Budget, and AMGP Revised Budget Performed financial analyses for contribution analysis and intrinsic valuation methods using the revised New AM structure (Pro Forma entity) and Old AM/AMGP structure (Status Quo entities) — Multiples and yields used in the present value of future stock/unit price analyses are reduced by approximately 15% from October, commensurate with the decline in an index of the peer set used in Project Francis Merger consideration consistent with October analysis and terms of the simplification agreement — No change in cash or equity consideration offered to AR or public holders of AM common units — Market movements result in a marginal increase in the number of restricted shares issued in exchange for the AM LTIP units because the LTIP units receive the All Equity Consideration, which converts the $3.415 cash consideration to equity using the AMGP 20-trading day VWAP 2
Key Terminology and Sources New AM: Antero Midstream upon completion of simplification transaction — Also referred to as “Pro Forma” in financial analyses Old AM/AMGP: Antero Midstream in prior LP & GP/IDR structure, including AMGP, AM, and Series B units — Also referred to as “Status Quo” in financial analyses New AM Revised Budget: 2019 budget provided by Antero Resources management and approved for Goldman Sachs’ use by the Special Committee, which includes forecasts for 2019-2022 — Budget assumes completion of simplification transaction in Q1 2019 AM Revised Budget and AMGP Revised Budget: 2019 budget for AM and AMGP, respectively, each provided by Antero Resources management, each approved for Goldman Sachs’ use by the Special Committee, and each of which includes forecasts for 2019-2022 — Neither budget assumes a simplification transaction Project Francis Pro Forma Forecast: New AM forecast for Project Francis provided by Antero Resources management and approved for Goldman Sachs’ use by the Special Committee in October 2018 (in prior Project Francis materials, the “GP Pro Forma Forecast”) Project Francis Status Quo Forecast: AM and AMGP standalone forecasts provided for Project Francis by Antero Resources management and approved for Goldman Sachs’ use by the Special Committee in October 2018 (in prior project Francis materials, the “Midstream Forecast” and the “GP Standalone Forecast”) 3 Old Forecasts New Forecasts Structure
I. Recent Developments and 2019 Capital Budget, Guidance, and Long-Term Outlook
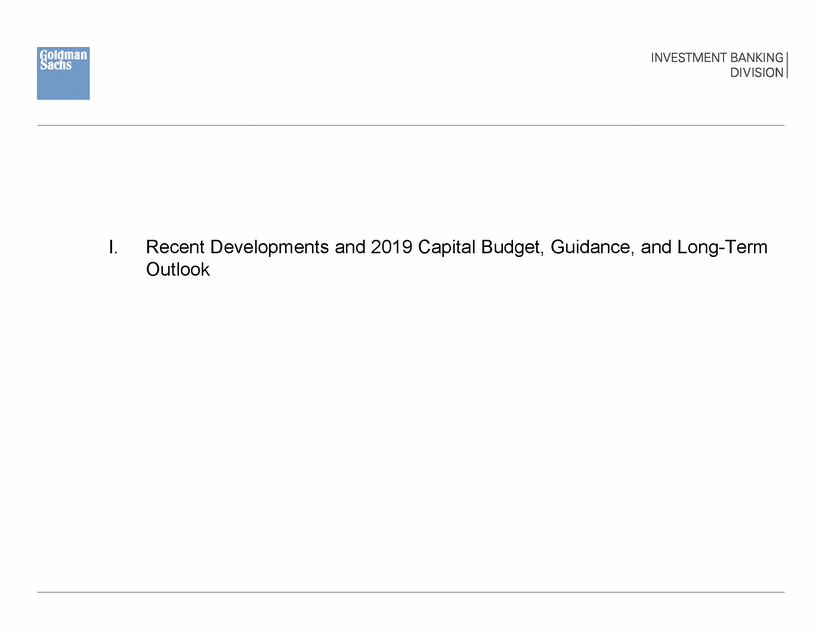
Overview of Recent Antero Midstream Trading Performance Since Announcement | AM & AMGP vs Selected Peers Proj. Francis Peer Performance Details Indexed Unit Price 20% WES 8 % CNXM 10% ENBL 0% Alerian HESM (10)% (14)% (17)% (10)% SHLX (14)% EQM (20)% NBLX (1 (25)% (17)% CEQP (30)% (17)% AM (40)% (23)% DCP (24)% TRGP (50)% 8-Oct-18 23-Oct-18 7-Nov-1822-Nov-18 7-Dec-18 22-Dec-18 6-Jan-19 AMGP (25)% (25)% ENLK AM AMGP Project Francis Peers¹ Alerian MLP Index Source: Bloomberg market data as of 9-Jan-2019 1 Project Francis Peers include CNXM, CEQP, DCP, ENBL, ENLK, EQM, HESM, NBLX, SHLX, TRGP, and WES. Recent Developments and 2019 Capital Budget, Guidance, and Long-Term Outlook 5 (8)% (9)% (10)% (10)% (11)% 6)%
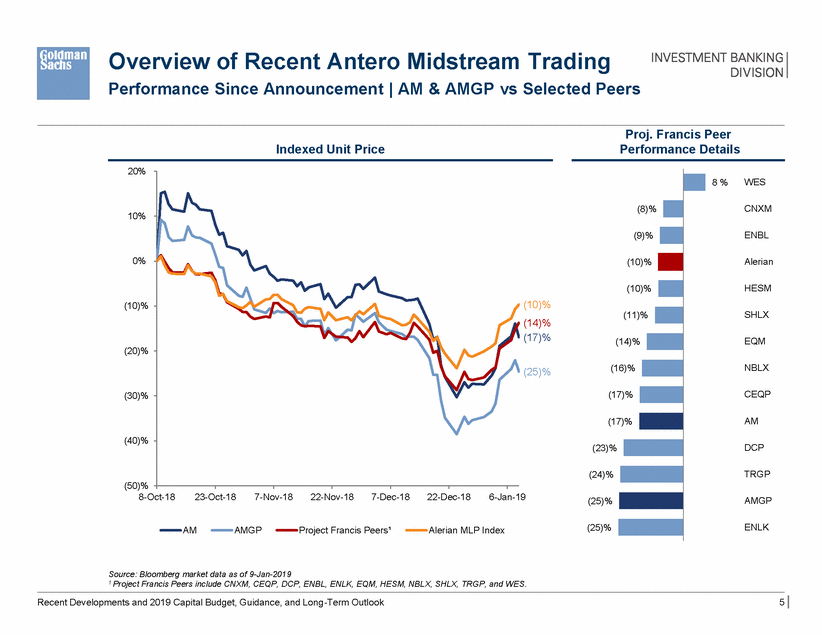
Overview of Recent Antero Midstream Trading AM Unit Price vs. Implied Value at New AM to Public Unit Holders $ 36.00 $ 34.00 $ 32.00 $ 30.00 $ 28.00 $ 26.00 $24.52 $24.48 $ 24.00 $ 22.00 $ 20.00 9-Oct-18 21-Oct-18 2-Nov-18 14-Nov-18 26-Nov-18 8-Dec-18 20-Dec-18 1-Jan-19 AM Closing Price Implied Value of New AM to AM Public Unitholders Per Agreement¹ Source: Bloomberg market data as of 9-Jan-2019 ¹ Calculated using the mixed election consideration to public unitholders of 1.635 shares of New AM plus $3.415 cash per Common Unit of AM. 6 Recent Developments and 2019 Capital Budget, Guidance, and Long-Term Outlook
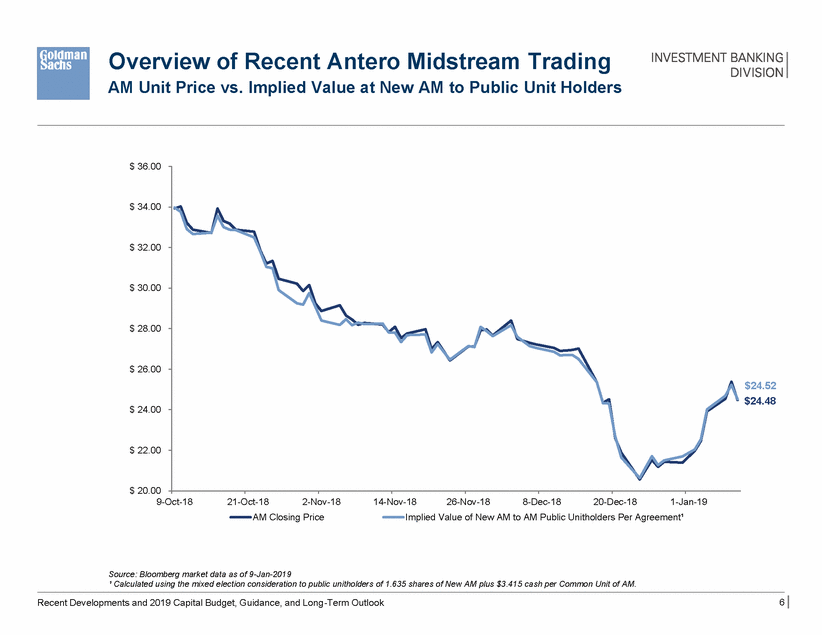
New AM Revised Budget Summary ($ in millions, except per share data) $ 1,588 $ 1,465 $ 1,431 $ 1,383 $ 1,296 $ 1,338 $ 1,143 $ 1,128 $ 1,051 $ 892 $ 892 $ 892 2019E 2020E 2021E 2022E 2019E 2020E 2021E 2022E 2019E 2020E 2021E 2022E $ 2.66 $ 2.46 $ 2.34 $ 2.28 $ 2.19 $ 2.10 $ 1.76 $ 1.71 $ 1.62 $ 1.40 $ 1.40 $ 1.39 2019E 2020E 2021E 2022E 2019E 2020E 2021E 2022E 2019E 2020E 2021E 2022E $ 2.30 $ 2.30 $ 2.30 $ 1.92 $ 1.92 $ 1.92 $ 1.60 $ 1.60 $ 1.60 $ 1.24 $ 1.24 $ 1.24 2019E 2020E 2021E 2022E 2019E 2020E 2021E 2022E 2019E 2020E 2021E 2022E 1.13 x 1.10 x 1.13 x 1.10 x 1.15 x 1.07 x 1.12 x 1.07 x 1.22 x 1.16 x 1.01 x 0.99 x 2019E 2020E 2021E 2022E 2019E 2020E 2021E 2022E 2019E 2020E 2021E 2022E Source: New AM Revised Budget, 2019 downside budget for New AM (the “New AM Revised Budget – Downside Case”), and 2019 upside budget for New AM (“New AM Revised Budget – Upside Case”), each of which was provided by Antero Resources management and approved for Goldman Sachs’ use by the Special Committee, includes forecasts for 2019-2022, and assumes completion of a simplification transaction in 1Q2019 Note: All budget cases assume C3+ NGL pricing at 63%-64% of WTI. 7 Recent Developments and 2019 Capital Budget, Guidance, and Long-Term Outlook Coverage New AM Ratio New AM DPS New AM DCF Per Share New AM EBITDA Upside Case WTI: $65 / bbl flat Natural Gas: $3.15 / MMBtu flat Base Case WTI: $57.50 / bbl Natural Gas: $3.00 / MMBtu Downside Case WTI: $50 / bbl flat Natural Gas: $2.85 / MMBtu flat
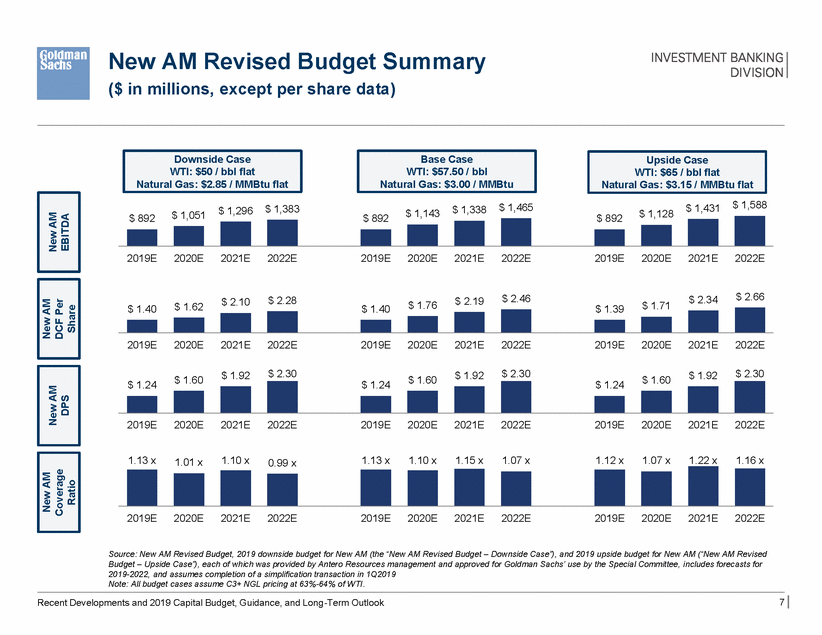
New AM Revised Budget Comparison Revised Budget vs. Project Francis Pro Forma Forecast | ($ in millions, except per share data) 2019 2020 2021 2022 CAGR EBITDA New AM Revised Budget Project Francis Pro Forma Forecast $ 892 989 $ 1,143 1,222 $ 1,338 1,413 $ 1,465 1,642 18 % 18 DCF Per Share New AM Revised Budget Project Francis Pro Forma Forecast $ 1.40 1.62 $ 1.76 1.97 $ 2.19 2.38 $ 2.46 2.74 21 % 19 DPS New AM Revised Budget Project Francis Pro Forma Forecast $ 1.24 1.24 $ 1.60 1.60 $ 1.92 1.93 $ 2.30 2.31 23 % 23 Coverage Ratio New AM Revised Budget Project Francis Pro Forma Forecast 1.13 x 1.31 1.10 x 1.23 1.15 x 1.23 1.07 x 1.19 Total Growth Capital Expenditures1 New AM Revised Budget Project Francis Pro Forma Forecast $ 705 776 $ 744 656 $ 308 386 $ 113 294 Net Debt / LTM EBITDA New AM Revised Budget Project Francis Pro Forma Forecast 3.2 x 2.9 3.1 x 2.7 2.7 x 2.5 2.5 x 2.2 Source: New AM Revised Budget and the Project Francis Pro Forma Forecast ¹ Total Growth Capital Expenditures calculated as total capital expenditures less maintenance capital expenditures and cash consideration related to the simplification agreement that is included in capital expenditures. 8 Recent Developments and 2019 Capital Budget, Guidance, and Long-Term Outlook Increase (Decrease) in Leverage 0.3 x 0.3 x 0.3 x 0.4 x % Change (9)% 13 % (20)% (62)% Increase (Decrease) in Coverage (0.18)x (0.13)x (0.09)x (0.12)x % Change (0)% (0)% (1)% (1)% % Change (14)% (11)% (8)% (10)% % Change (10)% (6)% (5)% (11)%
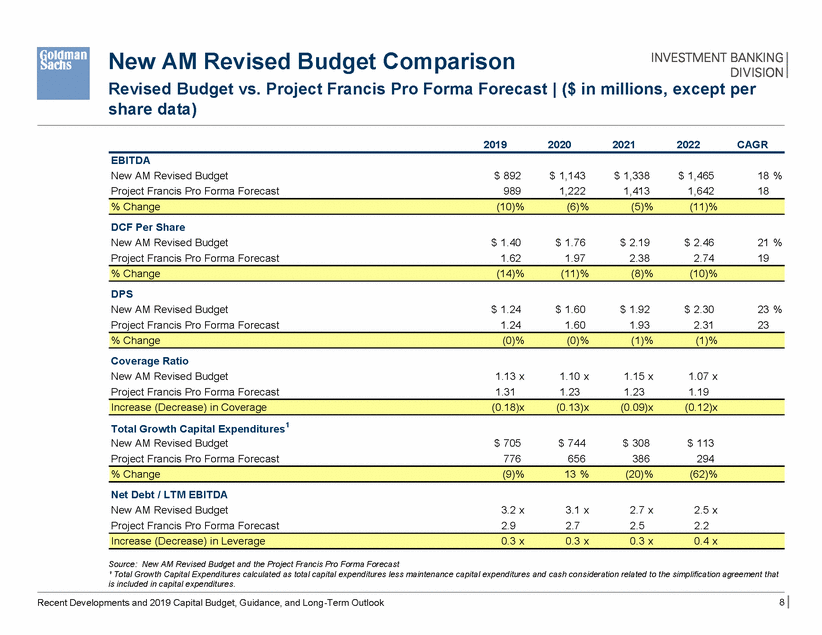
Revised Budget Under New AM Structure vs AM / AMGP Structure Base Case | ($ in millions, except per share data) Old 2019 2020 2021 2022 CAGR EBITDA New AM Structure Old AM / AMGP Structure $ 892 892 $ 1,143 1,143 $ 1,338 1,338 $ 1,465 1,465 18 % 18 DCF Per Share - AMGP Public Shareholder Perspective 2019 Budget - New AM 2019 Budget - Status Quo AMGP $ 1.40 0.89 $ 1.76 1.34 $ 2.19 1.74 $ 2.46 1.98 21 % 31 DPS - AMGP Public Shareholder Perspective 2019 Budget - New AM 2019 Budget - Status Quo AMGP $ 1.24 0.89 $ 1.60 1.34 $ 1.92 1.74 $ 2.30 1.98 23 % 31 Coverage Ratio 2019 Budget - New AM 2019 Budget - Status Quo AM 1.13 x 1.12 1.10 x 1.05 1.15 x 1.04 1.07 x 1.04 Net Debt 2019 Budget - New AM 2019 Budget - Status Quo AM $ 2,838 2,240 $ 3,500 2,944 $ 3,661 3,203 $ 3,692 3,267 Net Debt / LTM EBITDA 2019 Budget - New AM 2019 Budget - Status Quo AM 3.2 x 2.5 3.1 x 2.6 2.7 x 2.4 2.5 x 2.2 Source: New AM Revised Budget, AM Revised Budget, and AMGP Revised Budget 9 Recent Developments and 2019 Capital Budget, Guidance, and Long-Term Outlook Increase (Decrease) in Leverage 0.7 x 0.5 x 0.3 x 0.3 x % Change 27 % 19 % 14 % 13 % Increase (Decrease) in Coverage 0.01 x 0.06 x 0.11 x 0.03 x % Change 40 % 20 % 10 % 16 % % Change 58 % 32 % 26 % 24 % % Change 0 % 0 % 0 % 0 %
II. Updated Selected Financial Analyses For New AM Revised Budget
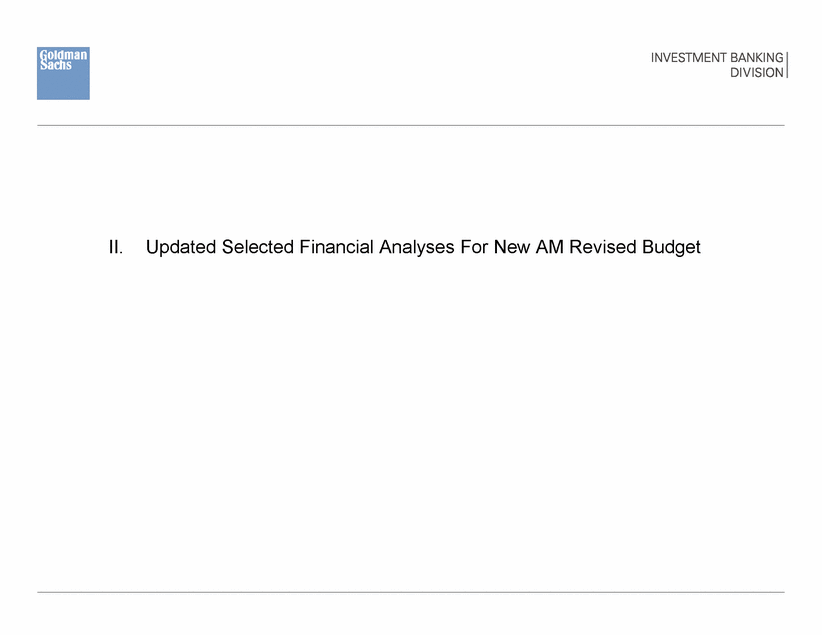
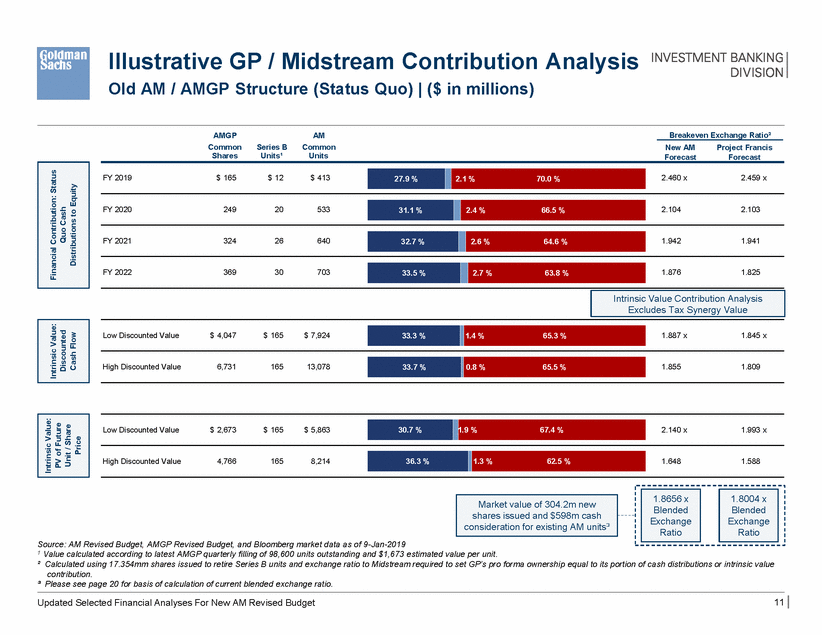
Illustrative GP / Midstream Contribution Analysis Old AM / AMGP Structure (Status Quo) | ($ in millions) AMGP Common Shares AM Common Units Breakeven Exchange Ratio² Series B Units¹ New AM Forecast Project Francis Forecast FY 2019 $ 165 $ 12 $ 413 2.460 x 2.459 x FY 2020 249 20 533 2.104 2.103 FY 2021 324 26 640 1.942 1.941 FY 2022 369 30 703 1.876 1.825 Low Discounted Value $ 4,047 $ 165 $ 7,924 1.887 x 1.845 x High Discounted Value 6,731 165 13,078 1.855 1.809 Low Discounted Value $ 2,673 $ 165 $ 5,863 2.140 x 1.993 x High Discounted Value 4,766 165 8,214 1.648 1.588 shares issued and $598m cash Source: AM Revised Budget, AMGP Revised Budget, and Bloomberg market data as of 9-Jan-2019 1 Value calculated according to latest AMGP quarterly filling of 98,600 units outstanding and $1,673 estimated value per unit. ² Calculated using 17.354mm shares issued to retire Series B units and exchange ratio to Midstream required to set GP’s pro forma ownership equal to its portion of cash distributions or intrinsic value contribution. ³ Please see page 20 for basis of calculation of current blended exchange ratio. 11 Updated Selected Financial Analyses For New AM Revised Budget PV of Future Price Market value of 304.2m new consideration for existing AM units³ 1.8004 x Blended Exchange Ratio 1.8656 x Blended Exchange Ratio 36.3 % 1.3 %62.5 % 30.7 % 1.9 %67.4 % Intrinsic Value: Unit / Share 33.7 % 0.8 %65.5 % 33.3 % 1.4 %65.3 % Intrinsic Value: Discounted Cash Flow Intrinsic Value Contribution Analysis Excludes Tax Synergy Value 33.5 % 2.7 %63.8 % 32.7 % 2.6 %64.6 % 31.1 % 2.4 %66.5 % 27.9 % 2.1 %70.0 % Financial Contribution: Status Quo Cash Distributions to Equity
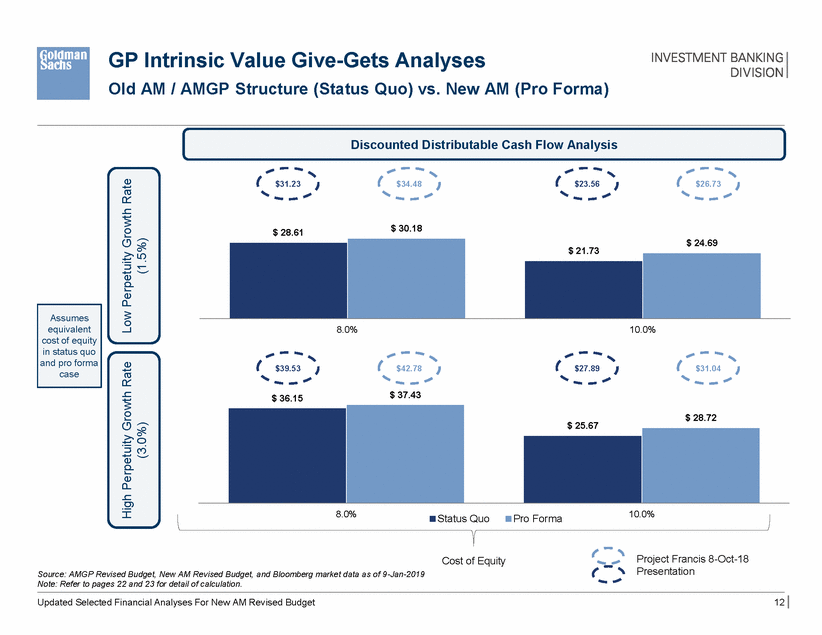
GP Intrinsic Value Give-Gets Analyses Old AM / AMGP Structure (Status Quo) vs. New AM (Pro Forma) Discounted Distributable Cash Flow Analysis $31.23 $34.48 $23.56 $26.73 $ 30.18 $ 28.61 $ 21.73 8.0% 10.0% $39.53 $42.78 $27.89 $31.04 $ 37.43 $ 36.15 $ 25.67 8.0% 10.0% Status Quo Pro Forma Project Francis 8-Oct-18 Presentation Cost of Equity Source: AMGP Revised Budget, New AM Revised Budget, and Bloomberg market data as of 9-Jan-2019 Note: Refer to pages 22 and 23 for detail of calculation. Updated Selected Financial Analyses For New AM Revised Budget 12 High Perpetuity Growth Rate (3.0%) Low Perpetuity Growth Rate (1.5%) $ 28.72 Assumes equivalent cost of equity in status quo and pro forma case $ 24.69
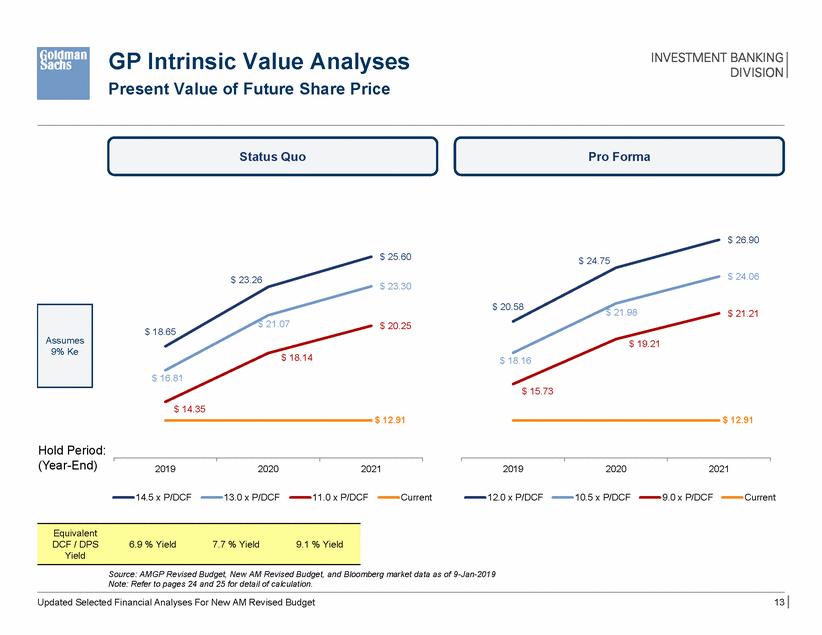
GP Intrinsic Value Analyses Present Value of Future Share Price Status Quo Pro Forma $ 26.90 $ 25.60 $ 24.75 $ 24.06 $ 23.26 $ 23.30 $ 20.58 $ 21.98 $ 21.21 $ 21.07 $ 20.25 $ 18.65 $ 19.21 $ 18.14 $ 18.16 $ 16.81 $ 15.73 $ 14.35 $ 12.91 $ 12.91 Hold Period: (Year-End) 2019 2020 2021 2019 2020 2021 14.5 x P/DCF 13.0 x P/DCF 11.0 x P/DCF Current 12.0 x P/DCF 10.5 x P/DCF 9.0 x P/DCF Current Source: AMGP Revised Budget, New AM Revised Budget, and Bloomberg market data as of 9-Jan-2019 Note: Refer to pages 24 and 25 for detail of calculation. Updated Selected Financial Analyses For New AM Revised Budget 13 Equivalent DCF / DPS6.9 % Yield7.7 % Yield9.1 % Yield Yield Assumes 9% Ke
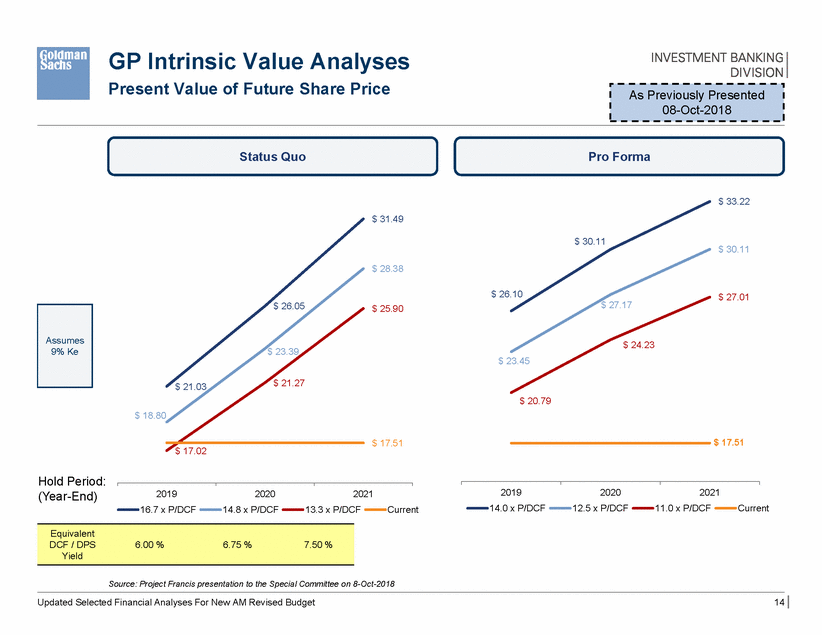
GP Intrinsic Value Analyses Present Value of Future Share Price Status Quo Pro Forma $ 33.22 $ 31.49 $ 30.11 $ 30.11 $ 28.38 $ 26.10 $ 27.01 $ 27.17 $ 26.05 $ 25.90 $ 24.23 $ 23.39 $ 23.45 $ 21.27 $ 21.03 $ 20.79 $ 18.80 $ 17.51 $ 17.51 $ 17.02 Hold Period: (Year-End) 2019 14.0 x P/DCF 2020 12.5 x P/DCF 2021 2019 16.7 x P/DCF 2020 14.8 x P/DCF 2021 11.0 x P/DCF Current 13.3 x P/DCF Current Source: Project Francis presentation to the Special Committee on 8-Oct-2018 Updated Selected Financial Analyses For New AM Revised Budget 14 Equivalent DCF / DPS6.00 %6.75 %7.50 % Yield Assumes 9% Ke As Previously Presented 08-Oct-2018
Appendix A: Cost of Capital Materials
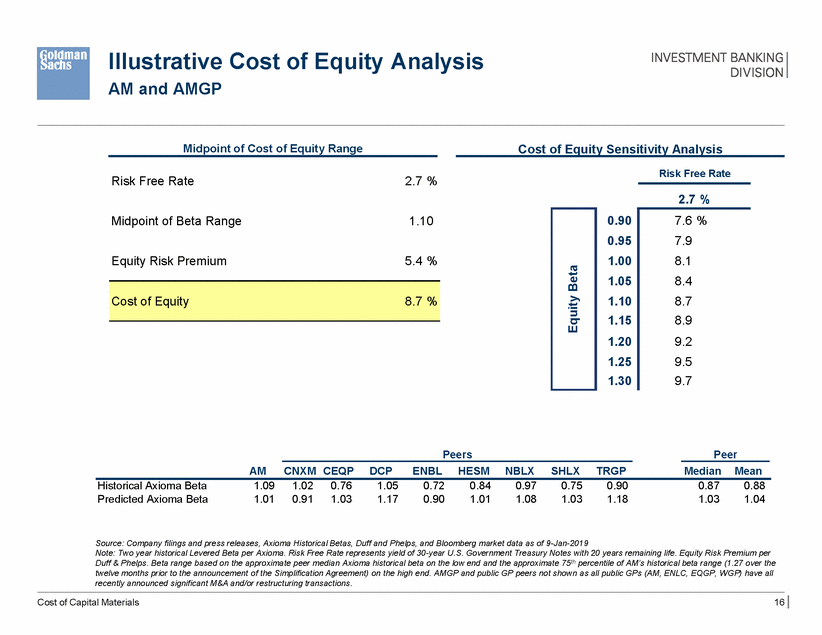
Illustrative Cost of Equity AM and AMGP Analysis Midpoint of Cost of Equity Range Cost of Equity Sensitivity Analysis Risk Free Rate Risk Free Rate 2.7 % 2.7 % Midpoint of Beta Range 1.10 0.90 0.95 1.00 1.05 1.10 1.15 1.20 1.25 1.30 Equity Risk Premium 5.4 % Peers Peer AM CNXM CEQP DCP ENBL HESM NBLX SHLX TRGP Median Mean Historical Axioma Beta Predicted Axioma Beta 1.09 1.01 1.02 0.91 0.76 1.03 1.05 1.17 0.72 0.90 0.84 1.01 0.97 1.08 0.75 1.03 0.90 1.18 0.87 1.03 0.88 1.04 Source: Company filings and press releases, Axioma Historical Betas, Duff and Phelps, and Bloomberg market data as of 9-Jan-2019 Note: Two year historical Levered Beta per Axioma. Risk Free Rate represents yield of 30-year U.S. Government Treasury Notes with 20 years remaining life. Equity Risk Premium per Duff & Phelps. Beta range based on the approximate peer median Axioma historical beta on the low end and the approximate 75th percentile of AM’s historical beta range (1.27 over the twelve months prior to the announcement of the Simplification Agreement) on the high end. AMGP and public GP peers not shown as all public GPs (AM, ENLC, EQGP, WGP) have all recently announced significant M&A and/or restructuring transactions. Cost of Capital Materials 16 Cost of Equity8.7 % 7.6 % 7.9 8.1 8.4 8.7 8.9 9.2 9.5 9.7 Equity Beta
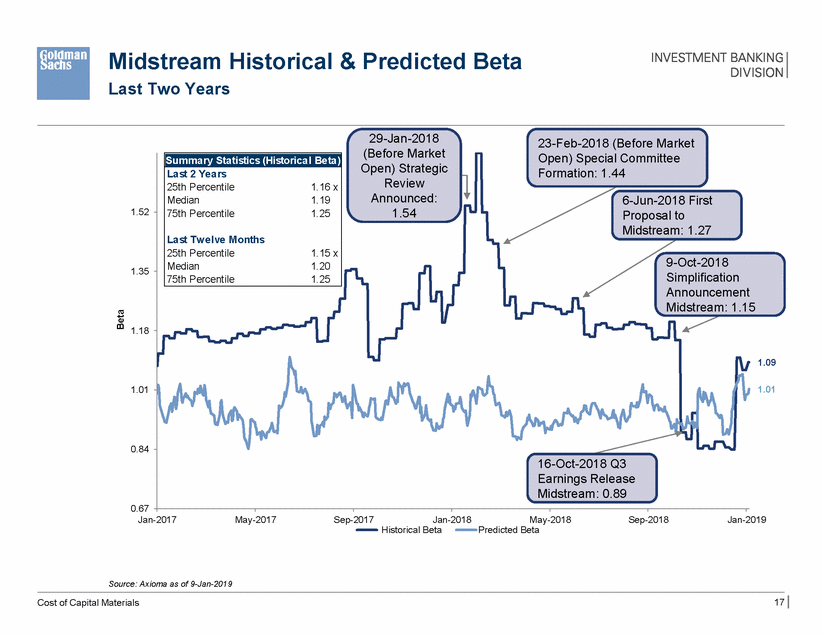
Midstream Historical Last Two Years & Predicted Beta 29-Jan-2018 (Before Market 23-Feb-2018 (Before Market Open) Strategic Formation: 1.44 Announced: 6-Jun-2018 First 1.52 1.35 5 1.18 1.09 1.01 1.01 0.84 0.67 Jan-2017 May-2017 Sep-2017 Jan-2018 May-2018 Predicted Beta Sep-2018 Jan-2019 Historical Beta Source: Axioma as of 9-Jan-2019 17 Cost of Capital Materials Beta Open) Special Committee Review 1.54Proposal to Midstream: 1.27 9-Oct-2018 Simplification Announcement Midstream: 1.1 16-Oct-2018 Q3 Earnings Release Midstream: 0.89 Summary Statistics (Historical Beta) Last 2 Years 25th Percentile 1.16 x Median 1.19 75th Percentile 1.25 Last Twelve Months 25th Percentile 1.15 x Median 1.20 75th Percentile 1.25
Appendix B: Additional Valuation Reference Materials
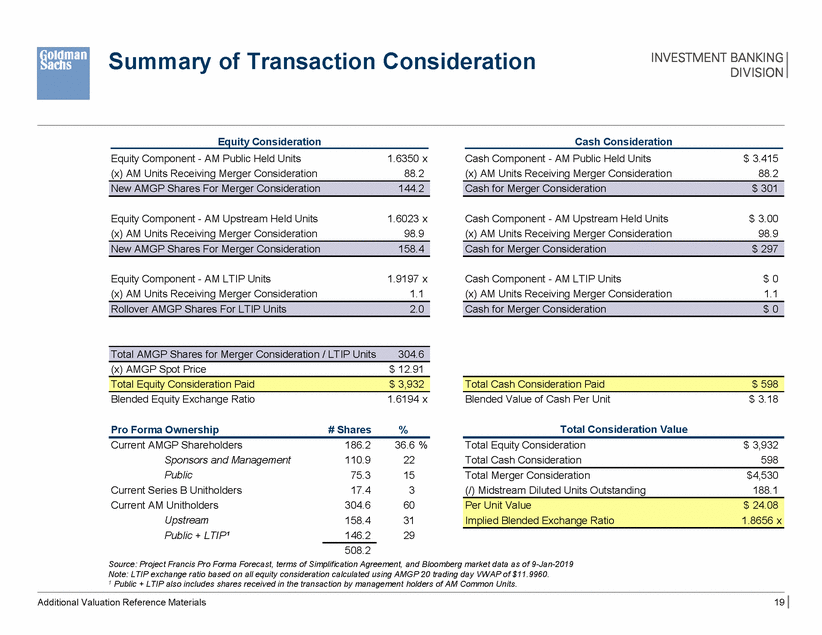
Summary of Transaction Consideration Equity Consideration Cash Consideration Equity Component - AM Public Held Units (x) AM Units Receiving Merger Consideration 1.6350 x 88.2 Cash Component - AM Public Held Units (x) AM Units Receiving Merger Consideration $ 3.415 88.2 Equity Component - AM Upstream Held Units (x) AM Units Receiving Merger Consideration 1.6023 x 98.9 Cash Component - AM Upstream Held Units (x) AM Units Receiving Merger Consideration $ 3.00 98.9 Equity Component - AM LTIP Units (x) AM Units Receiving Merger Consideration 1.9197 x 1.1 Cash Component - AM LTIP Units (x) AM Units Receiving Merger Consideration $ 0 1.1 (x) AMGP Spot Price $ 12.91 Blended Equity Exchange Ratio 1.6194 x Blended Value of Cash Per Unit $ 3.18 Total Consideration Value Pro Forma Ownership # Shares % Current AMGP Shareholders Sponsors and Management Public Current Series B Unitholders Current AM Unitholders Upstream Public + LTIP¹ 186.2 110.9 75.3 17.4 304.6 158.4 146.2 36.6 % 22 15 3 60 31 29 Total Equity Consideration Total Cash Consideration $ 3,932 598 Total Merger Consideration (/) Midstream Diluted Units Outstanding $4,530 188.1 508.2 Source: Project Francis Pro Forma Forecast, terms of Simplification Agreement, and Bloomberg market data as of 9-Jan-2019 Note: LTIP exchange ratio based on all equity consideration calculated using AMGP 20 trading day VWAP of $11.9960. 1 Public + LTIP also includes shares received in the transaction by management holders of AM Common Units. Additional Valuation Reference Materials 19 Per Unit Value$ 24.08 Implied Blended Exchange Ratio1.8656 x Total Cash Consideration Paid$ 598 Total Equity Consideration Paid$ 3,932 Total AMGP Shares for Merger Consideration / LTIP Units304.6 Cash for Merger Consideration$ 0 Rollover AMGP Shares For LTIP Units2.0 Cash for Merger Consideration$ 297 New AMGP Shares For Merger Consideration158.4 Cash for Merger Consideration$ 301 New AMGP Shares For Merger Consideration144.2
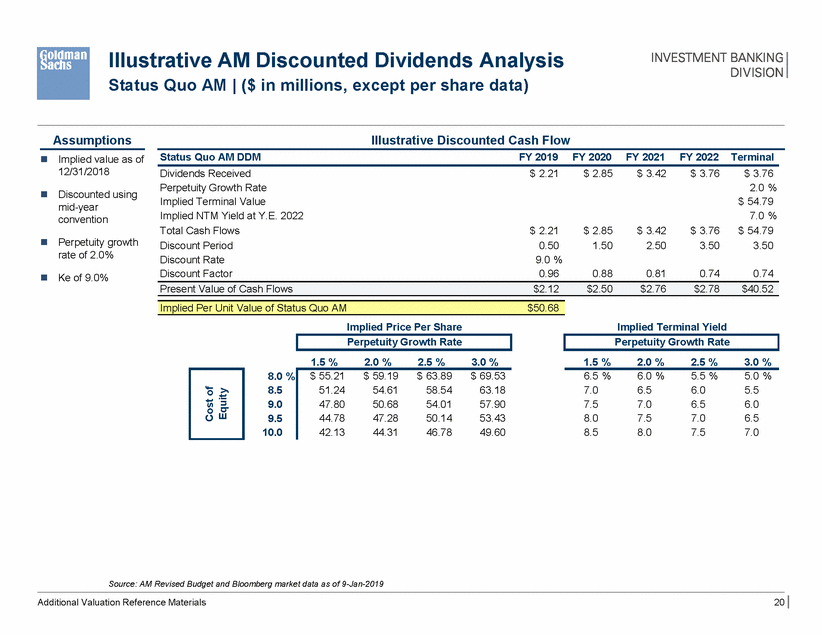
Illustrative AM Discounted Dividends Analysis Status Quo AM | ($ in millions, except per share data) Assumptions Illustrative Discounted Cash Flow Status Quo AM DDM FY 2019 FY 2020 FY 2021 FY 2022 Terminal Implied value as of 12/31/2018 Dividends Received Perpetuity Growth Rate Implied Terminal Value Implied NTM Yield at Y.E. 2022 Total Cash Flows Discount Period Discount Rate Discount Factor $ 2.21 $ 2.85 $ 3.42 $ 3.76 $ 3.76 2.0 % $ 54.79 7.0 % $ 54.79 3.50 Discounted using mid-year convention $ 2.21 0.50 9.0 % 0.96 $ 2.85 1.50 $ 3.42 2.50 $ 3.76 3.50 Perpetuity growth rate of 2.0% 0.88 0.81 0.74 0.74 Ke of 9.0% Implied Price Per Share Implied Terminal Yield 1.5 % 2.0 % 2.5 % 3.0 % 1.5 % 2.0 % 2.5 % 3.0 % 8.0 % 8.5 9.0 9.5 10.0 6.5 % 7.0 7.5 8.0 8.5 6.0 % 6.5 7.0 7.5 8.0 5.5 % 6.0 6.5 7.0 7.5 5.0 % 5.5 6.0 6.5 7.0 Source: AM Revised Budget and Bloomberg market data as of 9-Jan-2019 Additional Valuation Reference Materials 20 $ 55.21$ 59.19$ 63.89$ 69.53 51.2454.615.5463.18 47.8050.6854.0157.90 44.7847.2850.1453.43 42.1344.3146.7849.60 Cost of Equity Perpetuity Growth Rate Perpetuity Growth Rate Implied Per Unit Value of Status Quo AM$50.68 Present Value of Cash Flows$2.12$2.50$2.76$2.78$40.52
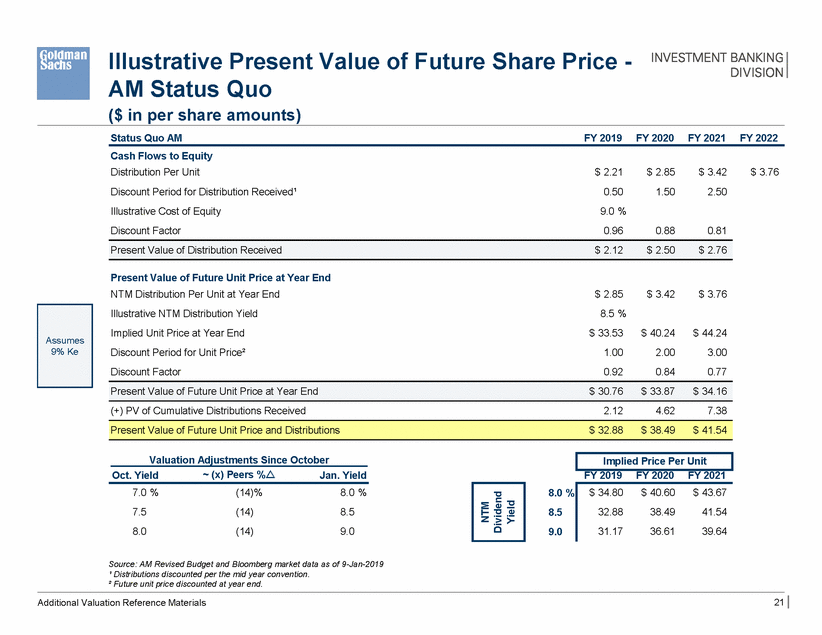
Illustrative Present Value of Share Price - AM Status Quo ($ in per share amounts) Status Quo AM FY 2019 FY 2020 FY 2021 FY 2022 Cash Flows to Equity Distribution Per Unit Discount Period for Distribution Received¹ Illustrative Cost of Equity Discount Factor $ 2.21 0.50 9.0 % 0.96 $ 2.85 1.50 $ 3.42 2.50 $ 3.76 0.88 0.81 Present Value of Future Unit Price at Year End NTM Distribution Per Unit at Year End Illustrative NTM Distribution Yield Implied Unit Price at Year End Discount Period for Unit Price² Discount $ 2.85 8.5 % $ 33.53 1.00 0.92 $ 3.42 $ 3.76 $ 40.24 2.00 0.84 $ 44.24 3.00 0.77 (+) PV of Cumulative Distributions Received 2.12 4.62 7.38 Valuation Adjustments Since October ~ (x) Peers %r Oct. Yield Jan. Yield FY 2019 FY 2020 FY 2021 7.0 % 7.5 8.0 (14)% (14) (14) 8.0 % 8.5 9.0 8.0 % 8.5 9.0 Source: AM Revised Budget and Bloomberg market data as of 9-Jan-2019 ¹ Distributions discounted per the mid year convention. ² Future unit price discounted at year end. 21 Additional Valuation Reference Materials $ 34.80 $ 40.60 $ 43.67 32.88 38.49 41.54 31.17 36.61 39.64 NTM Dividend Yield Implied Price Per Unit Present Value of Future Unit Price and Distributions $ 32.88 $ 38.49 $ 41.54 Present Value of Future Unit Price at Year End $ 30.76 $ 33.87 $ 34.16 Assumes 9% Ke Present Value of Distribution Received $ 2.12 $ 2.50 $ 2.76
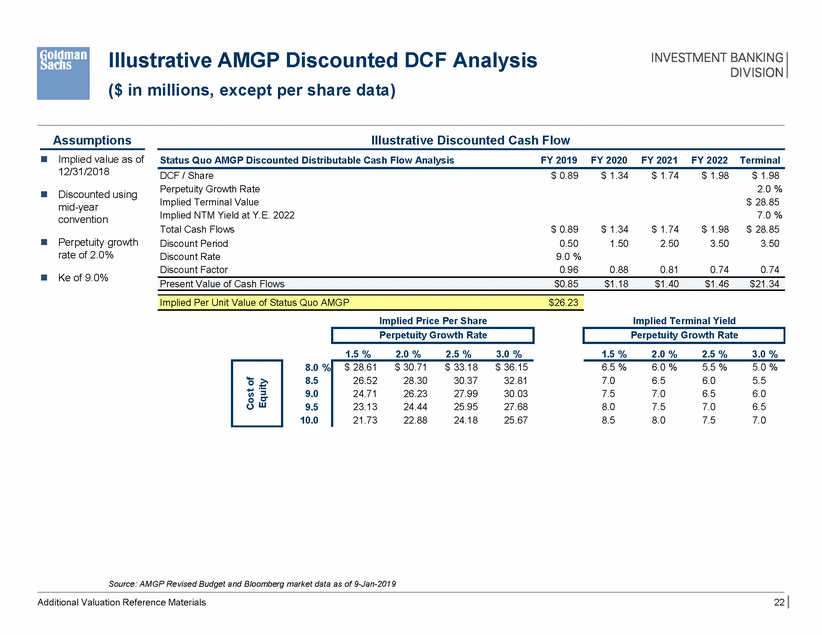
Illustrative AMGP Discounted DCF Analysis ($ in millions, except per share data) Assumptions Illustrative Discounted Cash Flow Implied value as of 12/31/2018 Status Quo AMGP Discounted Distributable Cash Flow Analysis FY 2019 FY 2020 FY 2021 FY 2022 Terminal DCF / Share Perpetuity Growth Rate Implied Terminal Value Implied NTM Yield at Y.E. 2022 Total Cash Flows Discount Period Discount Rate Discount Factor $ 0.89 $ 1.34 $ 1.74 $ 1.98 $ 1.98 2.0 % $ 28.85 7.0 % $ 28.85 3.50 Discounted using mid-year convention $ 0.89 0.50 9.0 % 0.96 $ 1.34 1.50 $ 1.74 2.50 $ 1.98 3.50 Perpetuity growth rate of 2.0% 0.88 0.81 0.74 0.74 Ke of 9.0% Implied Price Per Share Implied Terminal Yield 1.5 % 2.0 % 2.5 % 3.0 % 1.5 % 2.0 % 2.5 % 3.0 % 8.0 % 8.5 9.0 9.5 10.0 6.5 % 7.0 7.5 8.0 8.5 6.0 % 6.5 7.0 7.5 8.0 5.5 % 6.0 6.5 7.0 7.5 5.0 % 5.5 6.0 6.5 7.0 Source: AMGP Revised Budget and Bloomberg market data as of 9-Jan-2019 Additional Valuation Reference Materials 22 $ 28.61 $ 30.71 $ 33.18 $ 36.15 26.52 28.30 30.37 32.81 24.71 26.23 27.99 30.03 23.13 24.44 25.95 27.68 21.73 22.88 24.18 25.67 Cost of Equity Perpetuity Growth Rate Perpetuity Growth Rate Implied Per Unit Value of Status Quo AMGP $26.23 Present Value of Cash Flows $0.85 $1.18 $1.40 $1.46 $21.34
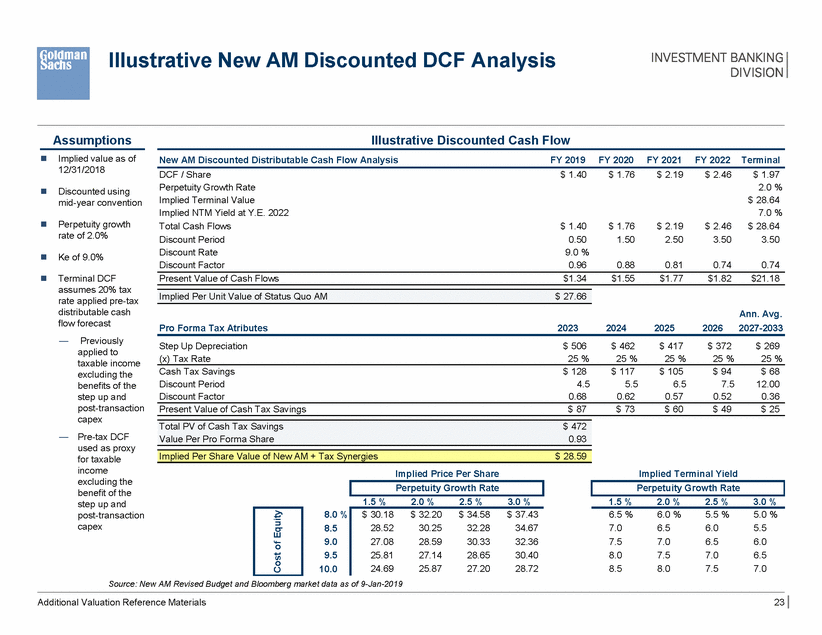
Illustrative New AM Discounted DCF Analysis Assumptions Illustrative Discounted Cash Flow Implied value as of 12/31/2018 New AM Discounted Distributable Cash Flow Analysis FY 2019 FY 2020 FY 2021 FY 2022 Terminal DCF / Share Perpetuity Growth Rate Implied Terminal Value Implied NTM Yield at Y.E. 2022 Total Cash Flows Discount Period Discount Rate Discount Factor $ 1.40 $ 1.76 $ 2.19 $ 2.46 $ 1.97 2.0 % $ 28.64 7.0 % $ 28.64 3.50 Discounted using mid-year convention Perpetuity growth rate of 2.0% $ 1.40 0.50 9.0 % 0.96 $ 1.76 1.50 $ 2.19 2.50 $ 2.46 3.50 Ke of 9.0% 0.88 0.81 0.74 0.74 Terminal DCF assumes 20% tax rate applied pre-tax distributable cash flow forecast Present Value of Cash Flows $1.34 $1.55 $1.77 $1.82 $21.18 Ann. Avg. 2027-2033 Pro Forma Tax Atributes 2023 2024 2025 2026 — Previously applied to taxable income excluding the benefits of the step up and post-transaction capex Pre-tax DCF used as proxy for taxable income excluding the benefit of the step up and post-transaction capex Step Up Depreciation (x) Tax Rate $ 506 25 % $ 462 25 % $ 417 25 % $ 372 25 % $ 269 25 % Cash Tax Savings Discount Period Discount Factor $ 128 4.5 0.68 $ 117 5.5 0.62 $ 105 6.5 0.57 $ 94 7.5 0.52 $ 68 12.00 0.36 Present Value of Cash Tax Savings $ 87 $ 73 $ 60 $ 49 $ 25 — Implied Price Per Share Implied Terminal Yield 1.5 % 2.0 % 2.5 % 3.0 % 1.5 % 2.0 % 2.5 % 3.0 % 8.0 % 8.5 9.0 9.5 10.0 6.5 % 7.0 7.5 8.0 8.5 6.0 % 6.5 7.0 7.5 8.0 5.5 % 6.0 6.5 7.0 7.5 5.0 % 5.5 6.0 6.5 7.0 Source: New AM Revised Budget and Bloomberg market data as of 9-Jan-2019 Additional Valuation Reference Materials 23 $ 30.18$ 32.20$ 34.58$ 37.43 28.5230.2532.2834.67 27.0828.5930.3332.36 25.8127.1428.6530.40 24.6925.8727.2028.72 Cost of Equity Perpetuity Growth Rate Perpetuity Growth Rate Implied Per Share Value of New AM + Tax Synergies$ 28.59 Total PV of Cash Tax Savings$ 472 Value Per Pro Forma Share0.93 Implied Per Unit Value of Status Quo AM$ 27.66
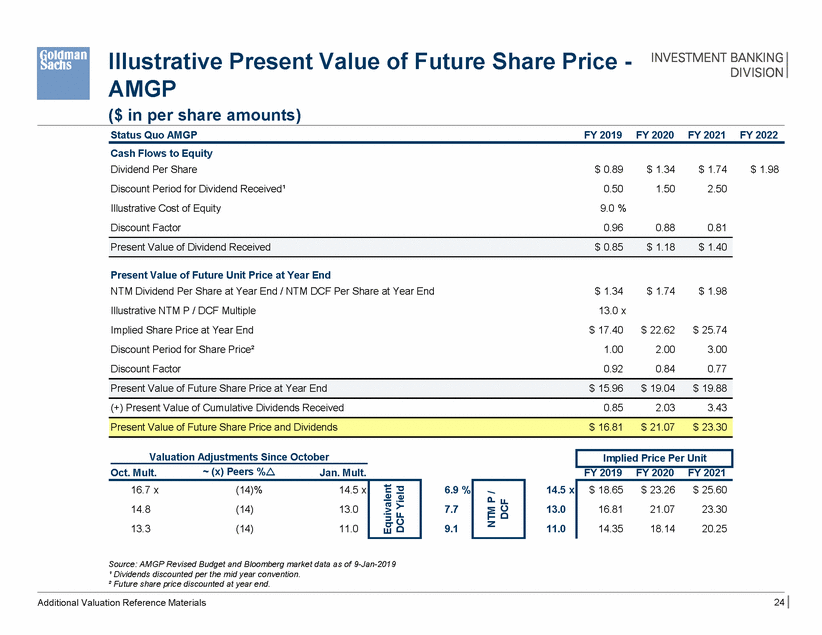
Illustrative Present Value of Future Share Price - AMGP ($ in per share amounts) Status Quo AMGP FY 2019 FY 2020 FY 2021 FY 2022 Cash Flows to Equity Dividend Per Share Discount Period for Dividend Received¹ Illustrative Cost of Equity Discount Factor $ 0.89 0.50 9.0 % 0.96 $ 1.34 1.50 $ 1.74 2.50 $ 1.98 0.88 0.81 Present Value of Future Unit Price at Year End NTM Dividend Per Share at Year End / NTM DCF Per Share at Year End Illustrative NTM P / DCF Multiple Implied Share Price at Year End Discount Period for Share Price² Discount Factor $ 1.34 13.0 x $ 17.40 1.00 0.92 $ 1.74 $ 1.98 $ 22.62 2.00 0.84 $ 25.74 3.00 0.77 (+) Present Value of Cumulative Dividends Received 0.85 2.03 3.43 Valuation Adjustments Since October ~ (x) Peers %r Oct. Mult. Jan. Mult. FY 2019 FY 2020 FY 2021 6.9 % 7.7 9.1 14.5 x 13.0 11.0 Source: AMGP Revised Budget and Bloomberg market data as of 9-Jan-2019 ¹ Dividends discounted per the mid year convention. ² Future share price discounted at year end. 24 Additional Valuation Reference Materials $ 18.65 $ 23.26 $ 25.60 16.81 21.07 23.30 14.35 18.14 20.25 NTM P / DCF 16.7 x (14)% 14.5 x 14.8 (14) 13.0 13.3 (14) 11.0 Equivalent DCF Yield Implied Price Per Unit Present Value of Future Share Price and Dividends $ 16.81 $ 21.07 $ 23.30 Present Value of Future Share Price at Year End $ 15.96 $ 19.04 $ 19.88 Present Value of Dividend Received $ 0.85 $ 1.18 $ 1.40
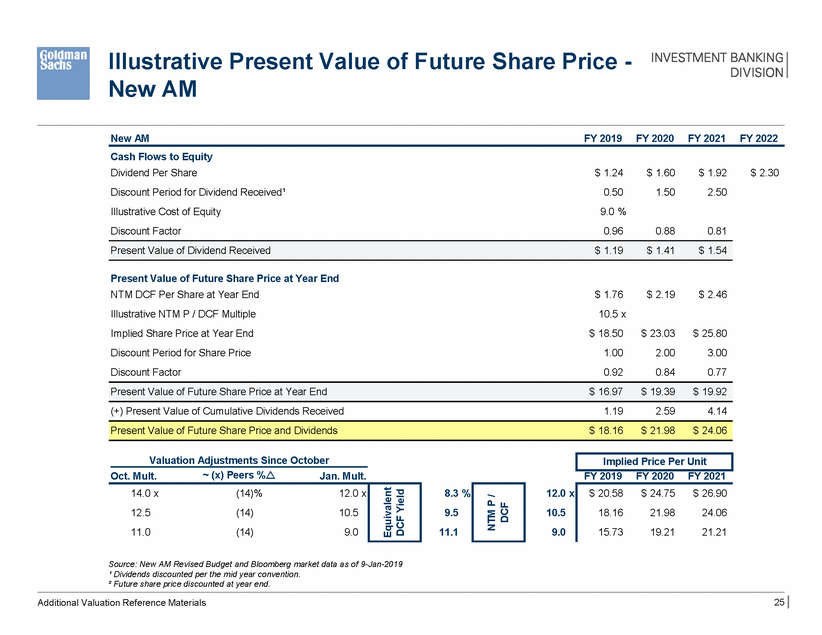
Illustrative New AM Present Value of Future Share Price - New AM FY 2019 FY 2020 FY 2021 FY 2022 Cash Flows to Equity Dividend Per Share Discount Period for Dividend Received¹ Illustrative Cost of Equity Discount Factor $ 1.24 0.50 9.0 % 0.96 $ 1.60 1.50 $ 1.92 2.50 $ 2.30 0.88 0.81 Present Value of Future Share Price at Year End NTM DCF Per Share at Year End Illustrative NTM P / DCF Multiple Implied Share Price at Year End Discount Period for Share Price Discount Factor $ 1.76 10.5 x $ 18.50 1.00 0.92 $ 2.19 $ 2.46 $ 23.03 2.00 0.84 $ 25.80 3.00 0.77 (+) Present Value of Cumulative Dividends Received 1.19 2.59 4.14 Valuation Adjustments Since October ~ (x) Peers %r Oct. Mult. Jan. Mult. FY 2019 FY 2020 FY 2021 8.3 % 9.5 11.1 12.0 x 10.5 9.0 Source: New AM Revised Budget and Bloomberg market data as of 9-Jan-2019 ¹ Dividends discounted per the mid year convention. ² Future share price discounted at year end. 25 Additional Valuation Reference Materials $ 20.58 $ 24.75 $ 26.90 18.16 21.98 24.06 15.73 19.21 21.21 NTM P / DCF 14.0 x (14)% 12.0 x 12.5 (14) 10.5 11.0 (14) 9.0 Equivalent DCF Yield Implied Price Per Unit Present Value of Future Share Price and Dividends $ 18.16 $ 21.98 $ 24.06 Present Value of Future Share Price at Year End $ 16.97 $ 19.39 $ 19.92 Present Value of Dividend Received $ 1.19 $ 1.41 $ 1.54
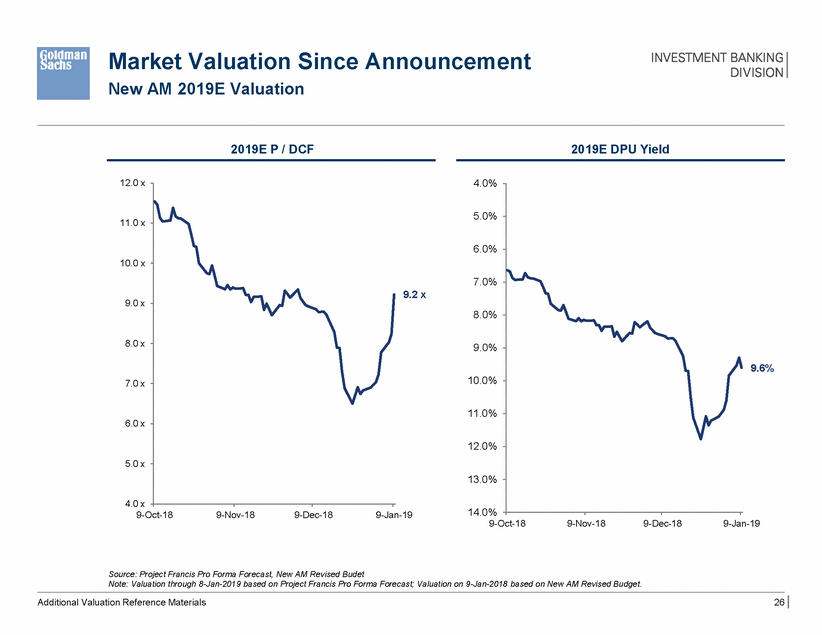
Market Valuation Since Announcement New AM 2019E Valuation 2019E P / DCF 2019E DPU Yield 12.0 x 4.0% 5.0% 11.0 x 6.0% 10.0 x 7.0% 9.2 x 9.0 x 8.0% 8.0 x 9.0% 9.6% 10.0% 7.0 x 11.0% 6.0 x 12.0% 5.0 x 13.0% 4.0 x 14.0% 9-Oct-18 9-Nov-18 9-Dec-18 9-Jan-19 9-Oct-18 9-Nov-18 9-Dec-18 9-Jan-19 Source: Project Francis Pro Forma Forecast, New AM Revised Budet Note: Valuation through 8-Jan-2019 based on Project Francis Pro Forma Forecast; Valuation on 9-Jan-2018 based on New AM Revised Budget. Additional Valuation Reference Materials 26
